
Solar power, electric vehicles (EVs) and other clean-energy technologies drove more than a third of the growth in China’s economy in 2025 – and more than 90% of the rise in investment.
Clean-energy sectors contributed a record 15.4tn yuan ($2.1tn) in 2025, some 11.4% of China’s gross domestic product (GDP) – comparable to the economies of Brazil or Canada.
The new analysis for Carbon Brief, based on official figures, industry data and analyst reports, shows that China’s clean-energy sectors nearly doubled in real value between 2022-25 and – if they were a country – would now be the 8th-largest economy in the world.
Other key findings from the analysis include:
- Without clean-energy sectors, China would have missed its target for GDP growth of “around 5%”, expanding by 3.5% in 2025 instead of the reported 5.0%.
- Clean-energy industries are expanding much more quickly than China’s economy overall, with their annual growth rate accelerating from 12% in 2024 to 18% in 2025.
- The “new three” of EVs, batteries and solar continue to dominate the economic contribution of clean energy in China, generating two-thirds of the value added and attracting more than half of all investment in the sectors.
- China’s investments in clean energy reached 7.2tn yuan ($1.0tn) in 2025, roughly four times the still sizable $260bn put into fossil-fuel extraction and coal power.
- Exports of clean-energy technologies grew rapidly in 2025, but China’s domestic market still far exceeds the export market in value for Chinese firms.
These investments in clean-energy manufacturing represent a large bet on the energy transition in China and overseas, creating an incentive for the government and enterprises to keep the boom going.
However, there is uncertainty about what will happen this year and beyond, particularly for solar power, where growth has slowed in response to a new pricing system and where central government targets have been set far below the recent rate of expansion.
An ongoing slowdown could turn the sectors into a drag on GDP, while worsening industrial “overcapacity” and exacerbating trade tensions.
Yet, even if central government targets in the next five-year plan are modest, those from local governments and state-owned enterprises could still drive significant growth in clean energy.
This article updates analysis previously reported for 2023 and 2024.
Clean-energy sectors outperform wider economy
China’s clean-energy economy continues to grow far more quickly than the wider economy. This means that it is making an outsize contribution to annual economic growth.
The figure below shows that clean-energy technologies drove more than a third of the growth in China’s economy overall in 2025 and more than 90% of the net rise in investment.
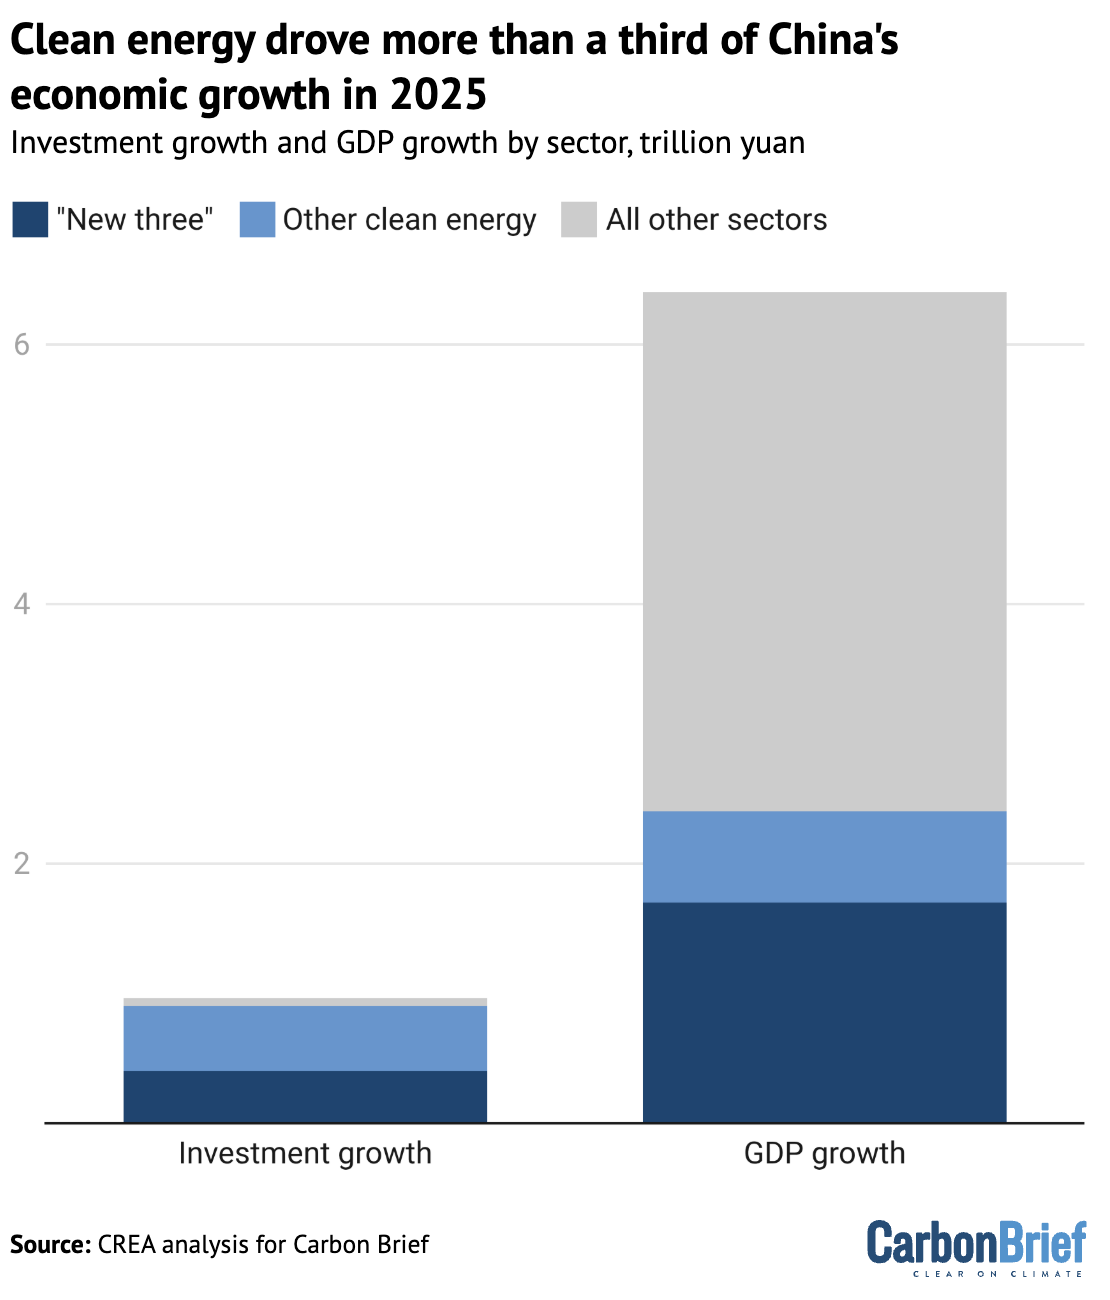
In 2022, China’s clean-energy economy was worth an estimated 8.4tn yuan ($1.2tn). By 2025, the sectors had nearly doubled in value to 15.4tn yuan ($2.1tn).
This is comparable to the entire output of Brazil or Canada and positions the Chinese clean-energy industry as the 8th-largest economy in the world. Its value is roughly half the size of the economy of India – the world’s fourth largest – or of the US state of California.
The outperformance of the clean-energy sectors means that they are also claiming a rising share of China’s economy overall, as shown in the figure below.
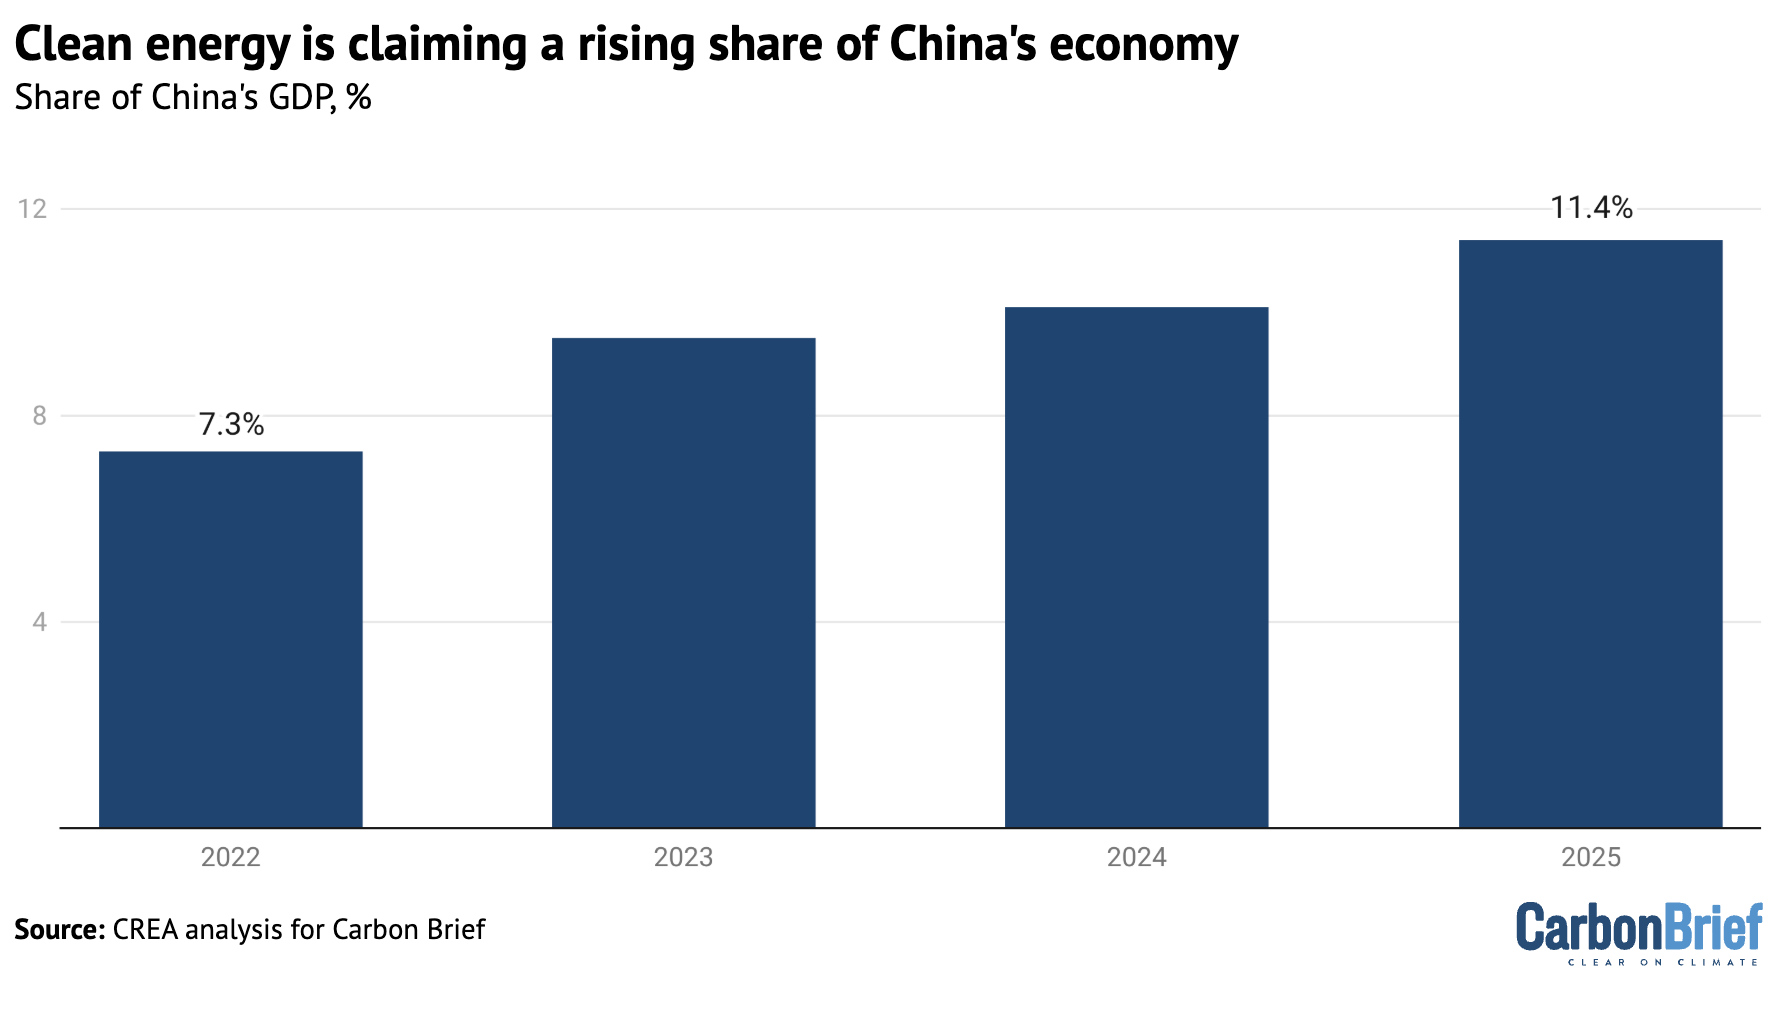
This share has risen from 7.3% of China’s GDP in 2022 to 11.4% in 2025.
Without clean-energy sectors, China’s GDP would have expanded by 3.5% in 2025 instead of the reported 5.0%, missing the target of “around 5%” growth by a wide margin.
Clean energy thus made a crucial contribution during a challenging year, when promoting economic growth was the foremost aim for policymakers.
The table below includes a detailed breakdown by sector and activity.
| Sector | Activity | Value in 2025, CNY bln | Value in 2025, USD bln | Year-on-year growth | Growth contribution | Value contribution | Value in 2025, CNY trn | Value in 2024, CNY trn | Value in 2023, CNY trn | Value in 2022, CNY trn |
|---|---|---|---|---|---|---|---|---|---|---|
| EVs | Investment: manufacturing capacity | 1,643 | 228 | 18% | 10.4% | 10.7% | 1.6 | 1.4 | 1.2 | 0.9 |
| EVs | Investment: charging infrastructure | 192 | 27 | 58% | 2.9% | 1.2% | 0.192 | 0.122 | 0.1 | 0.08 |
| EVs | Production of vehicles | 3,940 | 548 | 29% | 36.4% | 25.6% | 3.94 | 3.065 | 2.26 | 1.65 |
| Batteries | Investment: battery manufacturing | 277 | 38 | 35% | 3.0% | 1.8% | 0.277 | 0.205 | 0.32 | 0.15 |
| Batteries | Exports: batteries | 724 | 101 | 51% | 10.1% | 4.7% | 0.724 | 0.48 | 0.46 | 0.34 |
| Solar power | Investment: power generation capacity | 1,182 | 164 | 15% | 6.3% | 7.7% | 1.182 | 1.031 | 0.808 | 0.34 |
| Solar power | Investment: manufacturing capacity | 506 | 70 | -23% | -6.5% | 3.3% | 0.506 | 0.662 | 0.95 | 0.51 |
| Solar power | Electricity generation | 491 | 68 | 33% | 5.1% | 3.2% | 0.491 | 0.369 | 0.26 | 0.19 |
| Solar power | Exports of components | 681 | 95 | 21% | 4.9% | 4.4% | 0.681 | 0.562 | 0.5 | 0.35 |
| Wind power | Investment: power generation capacity, onshore | 612 | 85 | 47% | 8.1% | 4.0% | 0.612 | 0.417 | 0.397 | 0.21 |
| Wind power | Investment: power generation capacity, offshore | 96 | 13 | 98% | 2.0% | 0.6% | 0.096 | 0.048 | 0.086 | 0.06 |
| Wind power | Electricity generation | 510 | 71 | 13% | 2.4% | 3.3% | 0.51 | 0.453 | 0.4 | 0.34 |
| Nuclear power | Investment: power generation capacity | 173 | 24 | 18% | 1.1% | 1.1% | 0.17 | 0.15 | 0.09 | 0.07 |
| Nuclear power | Electricity generation | 216 | 30 | 8% | 0.7% | 1.4% | 0.216 | 0.2 | 0.19 | 0.19 |
| Hydropower | Investment: power generation capacity | 54 | 7 | -7% | -0.2% | 0.3% | 0.05 | 0.06 | 0.06 | 0.06 |
| Hydropower | Electricity generation | 582 | 81 | 3% | 0.6% | 3.8% | 0.582 | 0.567 | 0.51 | 0.51 |
| Rail transportation | Investment | 902 | 125 | 6% | 2.1% | 5.8% | 0.902 | 0.851 | 0.764 | 0.714 |
| Rail transportation | Transport of passengers and goods | 1,020 | 142 | 3% | 1.3% | 6.6% | 1.02 | 0.99 | 0.964 | 0.694 |
| Electricity transmission | Investment: transmission capacity | 644 | 90 | 6% | 1.5% | 4.2% | 0.64 | 0.61 | 0.53 | 0.5 |
| Electricity transmission | Transmission of clean power | 52 | 7 | 14% | 0.3% | 0.3% | 0.052 | 0.046 | 0.04 | 0.04 |
| Energy storage | Investment: Pumped hydro | 53 | 7 | 5% | 0.1% | 0.3% | 0.05 | 0.05 | 0.04 | 0.03 |
| Energy storage | Investment: Grid-connected batteries | 232 | 32 | 52% | 3.3% | 1.5% | 0.232 | 0.152 | 0.08 | 0.02 |
| Energy storage | Investment: Electrolysers | 11 | 2 | 29% | 0.1% | 0.1% | 0.011 | 0.009 | 0 | 0 |
| Energy efficiency | Revenue: Energy service companies | 620 | 86 | 17% | 3.8% | 4.0% | 0.62 | 0.528003 | 0.52 | 0.45 |
| Total | Investments | 7,198 | 1001 | 15% | 38.2% | 46.7% | 7.20 | 6.28 | 6.00 | 4.11 |
| Total | Production of goods and services | 8,216 | 1,143 | 22% | 61.8% | 53.3% | 8.22 | 6.73 | 5.58 | 4.32 |
| Total | Total GDP contribution | 15,414 | 2144 | 18% | 100.0% | 100.0% | 15.41 | 13.01 | 11.58 | 8.42 |
EVs and batteries were the largest drivers of GDP growth
In 2024, EVs and solar had been the largest growth drivers. In 2025, it was EVs and batteries, which delivered 44% of the economic impact and more than half of the growth of the clean-energy industries. This was due to strong growth in both output and investment.
The contribution to nominal GDP growth – unadjusted for inflation – was even larger, as EV prices held up year-on-year while the economy as a whole suffered from deflation. Investment in battery manufacturing rebounded after a fall in 2024.
The major contribution of EVs and batteries is illustrated in the figure below, which shows both the overall size of the clean-energy economy and the sectors that added the most to the rise from year to year.

The next largest subsector was clean-power generation, transmission and storage, which made up 40% of the contribution to GDP and 30% of the growth in 2025.
Within the electricity sector, the largest drivers were growth in investment in wind and solar power generation capacity, along with growth in power output from solar and wind, followed by the exports of solar-power equipment and materials.
Investment in solar-panel supply chains, a major growth driver in 2022-23, continued to fall for the second year. This was in line with the government’s efforts to rein in overcapacity and “irrational” price competition in the sector.
Finally, rail transportation was responsible for 12% of the total economic output of the clean-energy sectors, but saw relatively muted growth year-on-year, with revenue up 3% and investment by 6%.
Note that the International Energy Agency (IEA) world energy investment report projected that China invested $627bn in clean energy in 2025, against $257bn in fossil fuels.
For the same sectors as the IEA report, this analysis puts the value of clean-energy investment in 2025 at a significantly more conservative $430bn. The higher figures in this analysis overall are therefore the result of wider sectoral coverage.
Electric vehicles and batteries
EVs and vehicle batteries were again the largest contributors to China’s clean-energy economy in 2025, making up an estimated 44% of value overall.
Of this total, the largest share of both total value and growth came from the production of battery EVs and plug-in hybrids, which expanded 29% year-on-year. This was followed by investment into EV manufacturing, which grew 18%, after slower growth rates in 2024.
Investment in battery manufacturing also rebounded after a drop in 2024, driven by new battery technology and strong demand from both domestic and international markets. Battery manufacturing investment grew by 35% year-on-year to 277bn yuan.
The share of electric vehicles (EVs) will have reached 12% of all vehicles on the road by the end of 2025, up from 9% a year earlier and less than 2% just five years ago.
The share of EVs in the sales of all new vehicles increased to 48%, from 41% in 2024, with passenger cars crossing the 50% threshold. In November, EV sales crossed the 60% mark in total sales and they continue to drive overall automotive sales growth, as shown below.

Electric trucks experienced a breakthrough as their market share rose from 8% in the first nine months of 2024 to 23% in the same period in 2025.
Policy support for EVs continues, for example, with a new policy aiming to nearly double charging infrastructure in the next three years.
Exports grew even faster than the domestic market, but the vast majority of EVs continue to be sold domestically. In 2025, China produced 16.6m EVs, rising 29% year-on-year. While exports accounted for only 21% or 3.4m EVs, they grew by 86% year-on-year. Top export destinations for Chinese EVs were western Europe, the Middle East and Latin America.
The value of batteries exported also grew rapidly by 41% year-on-year, becoming the third largest growth driver of the GDP. Battery exports largely went to western Europe, north America and south-east Asia.
In contrast with deflationary trends in the price of many clean-energy technologies, average EV prices have held up in 2025, with a slight increase in average price of new models, after discounts. This also means that the contribution of the EV industry to nominal GDP growth was even more significant, given that overall producer prices across the economy fell by 2.6%. Battery prices continued to drop.
Clean-power generation
The solar power sector generated 19% of the total value of the clean-energy industries in 2025, adding 2.9tn yuan ($41bn) to the national economy.
Within this, investment in new solar power plants, at 1.2tn yuan ($160bn), was the largest driver, followed by the value of solar technology exports and by the value of the power generated from solar. Investment in manufacturing continued to fall after the wave of capacity additions in 2023, reaching 0.5tn yuan ($72bn), down 23% year-on-year.
In 2025, China achieved another new record of wind and solar capacity additions. The country installed a total of 315GW solar and 119GW wind capacity, adding more solar and two times as much wind as the rest of the world combined.
Clean energy accounted for 90% of investment in power generation, with solar alone covering 50% of that. As a result, non-fossil power made up 42% of total power generation, up from 39% in 2024.
However, a new pricing policy for new solar and wind projects and modest targets for capacity growth have created uncertainty about whether the boom will continue.
Under the new policy, new clean-power generation has to compete on price against existing coal power in markets that place it at a disadvantage in some key ways.
At the same time, the electricity markets themselves are still being introduced and developed, creating investment uncertainty.
Investment in solar power generation increased year-on-year by 15%, but experienced a strong stop-and-go cycle. Developers rushed to finish projects ahead of the new pricing policy coming into force in June and then again towards the end of the year to finalise projects ahead of the end of the current 14th five-year plan.
Investment in the solar sector as a whole was stable year-on-year, with the decline in manufacturing capacity investment balanced by continued growth in power generation capacity additions. This helped shore up the utilisation of manufacturing plants, in line with the government’s aim to reduce “disorderly” price competition.
By late 2025, China’s solar manufacturing capacity reached an estimated 1,200GW per year, well ahead of the global capacity additions of around 650GW in 2025. Manufacturers can now produce far more solar panels than the global market can absorb, with fierce competition leading to historically low profitability.
China’s policymakers have sought to address the issue since mid-2024, warning against “involution”, passing regulations and convening a sector-wide meeting to put pressure on the industry. This is starting to yield results, with losses narrowing in the third quarter of 2025.
The volume of exports of solar panels and components reached a record high in 2025, growing 19% year-on-year. In particular, exports of cells and wafers increased rapidly by 94% and 52%, while panel exports grew only by 4%.
This reflects the growing diversification of solar-supply chains in the face of tariffs and with more countries around the world building out solar panel manufacturing capacity. The nominal value of exports fell 8%, however, due to a fall in average prices and a shift to exporting upstream intermediate products instead of finished panels.
Hydropower, wind and nuclear were responsible for 15% of the total value of the clean-energy sectors in 2025, adding some 2.2tn yuan ($310bn) to China’s GDP in 2025.
Nearly two-thirds of this (1.3tn yuan, $180bn) came from the value of power generation from hydropower, wind and nuclear, with investment in new power generation projects contributing the rest.
Power generation grew 33% from solar, 13% from wind, 3% from hydropower and 8% from nuclear.
Within power generation investment, solar remained the largest segment by value – as shown in the figure below – but wind-power generation projects were the largest contributor to growth, overtaking solar for the first time since 2020.

In particular, offshore wind power capacity investment rebounded as expected, doubling in 2025 after a sharp drop in 2024.
Investment in nuclear projects continued to grow but remains smaller in total terms, at 17bn yuan. Investment in conventional hydropower continued to decline by 7%.
Electricity storage and grids
Electricity transmission and storage were responsible for 6% of the total value of the clean-energy sectors in 2025, accounting for 1.0 tn yuan ($140bn).
The most valuable sub-segment was investment in power grids, growing 6% in 2025 and reaching $90bn. This was followed by investment in energy storage, including pumped hydropower, grid-connected battery storage and hydrogen production.
Investment in grid-connected batteries saw the largest year-on-year growth, increasing by 50%, while investments in electrolysers also grew by 30%. The transmission of clean power increased an estimated 13%, due to rapid growth in clean-power generation.
China’s total electricity storage capacity reached more than 213GW, with battery storage capacity crossing 145GW and pumped hydro storage at 69GW. Some 66GW of battery storage capacity was added in 2025, up 52% year-on-year and accounting for more than 40% of global capacity additions.
Notably, capacity additions accelerated in the second half of the year, with 43GW added, compared with the first half, which saw 23GW of new capacity.
The battery storage market initially slowed after the renewable power pricing policy, which banned storage mandates after May, but this was quickly replaced by a “market-driven boom”. Provincial electricity spot markets, time-of-day tariffs and increasing curtailment of solar power all improved the economics of adding storage.
By the end of 2025, China’s top five solar manufacturers had all entered the battery storage market, making a shift in industry strategy.
Investment in pumped hydropower continued to increase, with 15GW of new capacity permitted in the first half of 2025 alone and 3GW entering operation.
Railways
Rail transportation made up 12% of the GDP contribution of the clean-energy sectors, with revenue from passenger and goods rail transportation the largest source of value. Most growth came from investment in rail infrastructure, which increased 6% year-on-year
The electrification of transport is not limited to EVs, as rail passenger, freight and investment volumes saw continued growth. The total length of China’s high-speed railway network reached 50,000km in 2025, making up more than 70% of the global high-speed total.
Energy efficiency
Investment in energy efficiency rebounded strongly in 2025. Measured by the aggregate turnover of large energy service companies (ESCOs), the market expanded by 17% year-on-year, returning to growth rates last seen during 2016-2020.
Total industry turnover has also recovered to its previous peak in 2021, signalling a clear turnaround after three years of weakness.
Industry projections now anticipate annual turnover reaching 1tn yuan in annual turnover by 2030, a target that had previously been expected to be met by 2025.
China’s ESCO market has evolved into the world’s largest. Investment within China’s ESCO market remains heavily concentrated in the buildings sector, which accounts for around 50% of total activity. Industrial applications make up a further 21%, while energy supply, demand-side flexibility and energy storage together account for approximately 16%.
Implications of China’s clean-energy bet
Ongoing investment of hundreds of billions of dollars into clean-energy manufacturing represents a gigantic economic and financial bet on a continuing global energy transition.
In addition to the domestic investment covered in this article, Chinese firms are making major investments in overseas manufacturing.
The clean-energy industries have played a crucial role in meeting China’s economic targets during the five-year period ending this year, delivering an estimated 40%, 25% and 37% of all GDP growth in 2023, 2024 and 2025, respectively.
However, the developments next year and beyond are unclear, particularly for solar power generation, with the new pricing system for renewable power generation leading to a short-term slowdown and creating major uncertainty, while central government targets have been set far below current rates of clean-electricity additions.
Investment in solar-power generation and solar manufacturing declined in the second half of the year, while investment in generation clocked growth for the full year, showing the risk to the industries under the current power market set-ups that favour coal-fired power.
The reduction in the prices of clean-energy technology has been so dramatic that when the prices for GDP statistics are updated, the sectors’ contribution to real GDP – adjusted for inflation or, in this case deflation – will be revised down.
Nevertheless, the key economic role of the industry creates a strong motivation to keep the clean-energy boom going. A slowdown in the domestic market could also undermine efforts to stem overcapacity and inflame trade tensions by increasing pressure on exports to absorb supply.
A recent CREA survey of experts working on climate and energy issues in China found that the majority believe that economic and geopolitical challenges will make the “dual carbon” goals – and with that, clean-energy industries – only more important.
Local governments and state-owned enterprises will also influence the outlook for the sector. Their previous five-year plans played a key role in creating the gigantic wind and solar power “bases” that substantially exceeded the central government’s level of ambition.
Provincial governments also have a lot of leeway in implementing the new electricity markets and contracting systems for renewable power generation. The new five-year plans, to be published this year, will therefore be of major importance.
About the data
Reported investment expenditure and sales revenue has been used where available. When this is not available, estimates are based on physical volumes – gigawatts of capacity installed, number of vehicles sold – and unit costs or prices.
The contribution to real growth is tracked by adjusting for inflation using 2022-2023 prices.
All calculations and data sources are given in a worksheet.
Estimates include the contribution of clean-energy technologies to the demand for upstream inputs such as metals and chemicals.
This approach shows the contribution of the clean-energy sectors to driving economic activity, also outside the sectors themselves, and is appropriate for estimating how much lower economic growth would have been without growth in these sectors.
Double counting is avoided by only including non-overlapping points in value chains. For example, the value of EV production and investment in battery storage of electricity is included, but not the value of battery production for the domestic market, which is predominantly an input to these activities.
Similarly, the value of solar panels produced for the domestic market is not included, as it makes up a part of the value of solar power generating capacity installed in China. However, the value of solar panel and battery exports is included.
In 2025, there was a major divergence between two different measures of investment. The first, fixed asset investment, reportedly fell by 3.8%, the first drop in 35 years. In contrast, gross capital formation saw the slowest growth in that period but still inched up by 2%.
This analysis uses gross capital formation as the measure of investment, as it is the data point used for GDP accounting. However, the analysis is unable to account for changes in inventories, so the estimate of clean-energy investment is for fixed asset investment in the sectors.
The analysis does not explicitly account for the small and declining role of imports in producing clean-energy goods and services. This means that the results slightly overstate the contribution to GDP but understate the contribution to growth.
For example, one of the most important import dependencies that China has is for advanced computing chips for EVs. The value of the chips in a typical EV is $1,000 and China’s import dependency for these chips is 90%, which suggests that imported chips represent less than 3% of the value of EV production.
The estimates are likely to be conservative in some key respects. For example, Bloomberg New Energy Finance estimates “investment in the energy transition” in China in 2024 at $800bn. This estimate covers a nearly identical list of sectors to ours, but excludes manufacturing – the comparable number from our data is $600bn.
China’s National Bureau of Statistics says that the total value generated by automobile production and sales in 2023 was 11tn yuan. The estimate in this analysis for the value of EV sales in 2023 is 2.3tn yuan, or 20% of the total value of the industry, when EVs already made up 31% of vehicle production and the average selling prices for EVs was slightly higher than for internal combustion engine vehicles.


The post Analysis: Clean energy drove more than a third of China’s GDP growth in 2025 appeared first on Carbon Brief.
Analysis: Clean energy drove more than a third of China’s GDP growth in 2025
Climate Change
Analysis: UK newspapers have already printed 63 editorials in 2026 backing North Sea drilling
UK newspapers have already published 63 editorials this year calling for more oil and gas extraction in the North Sea, according to Carbon Brief analysis.
The national outlets, including the Sun, the Daily Telegraph and the Times, argue that the nation “needs” more North Sea drilling to provide “home-sourced oil and gas” amid a “full-blown energy crisis”.
These newspapers seek to blame energy secretary Ed Miliband’s “net-zero crusade” for curbing UK fossil-fuel production – despite supplies dwindling for decades before he took the role.
The push for North Sea drilling in newspaper editorials – considered a publication’s formal “voice” – is part of a wider rejection of net-zero policies by the UK’s right-leaning press.
Figures ranging from ex-Labour prime minister Tony Blair to hard-right Reform UK leader Nigel Farage have repeated similar arguments that more drilling will “boost” the UK economy.
Even US president Donald Trump has weighed in, attributing, in part, the resignation of Keir Starmer as UK prime minister to him “fail[ing] badly” on North Sea oil.
Despite these claims, experts say trying to extract the last barrels of domestic oil and gas would have no impact on people’s energy bills and very little effect on energy security.
More drilling
North Sea oil and gas production is a highly politically charged issue in the UK, especially under the current Labour government.
When Labour won the general election in 2024, the new government committed to a “phased and responsible” transition away from fossil-fuel extraction in the North Sea.
As part of this pledge, it ruled out issuing new exploration licences for oil and gas. Since then, the government has allowed some “tiebacks”, where new drilling is undertaken close to existing sites.
Roughly 90% of the fossil fuels that are likely to be extracted in the North Sea have already been burned. North Sea oil and gas extraction was, therefore, already on a clear downward trajectory long before Labour came to power, having dropped 75% between 2000 and 2024.
Nevertheless, many newspapers have relentlessly called for more oil and gas production, framing the Labour policy as “self-destructive” and compromised by “green ideology”.
This has ramped up significantly in 2026. Just six months into the year, newspapers have already published 63 pro-North Sea editorials, according to analysis by Carbon Brief. This is more than double the number published in 2025, as shown in the figure below.
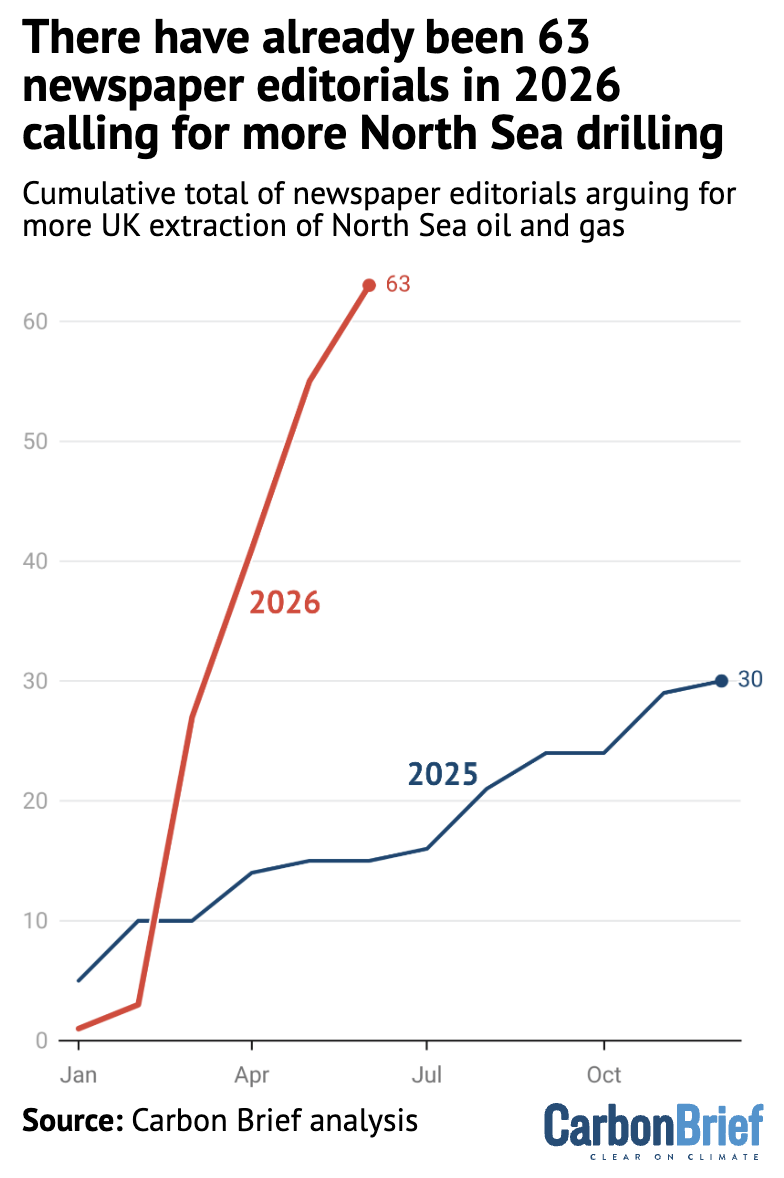
Right-leaning newspapers have led this campaign, with the Sun alone publishing 25 editorials, while the Daily Telegraph and the Times have published 10 each.
‘Full-blown energy crisis’
The biggest surge in pro-North Sea drilling editorials came in March, as the Iran war escalated and a global energy crisis began to take shape. Newspapers published 24 such editorials that month, despite the crisis largely arising from the world’s reliance on fossil fuels.
The Daily Express said the UK needed more “home-sourced oil and gas” and the Daily Mail highlighted the “perverse limit on domestic fossil-fuel production”.
As the weeks progressed, the Sun lamented price rises and potential fuel shortages, proposing North Sea drilling as a solution to the “full-blown energy crisis”.
Yet, UK oil and gas is sold by private companies on the open market at international rates. This means UK consumers have no particular right to the fuels or control over the prices they are bought for.
The Sun claimed – without evidence – that if the North Sea had been prioritised, the UK “might just have the cheapest electricity in the world”. It also said net-zero “forces us to spend billions” on imports.
In fact, the UK’s high energy prices are primarily the result of its reliance on gas to generate electricity.
The nation is reliant on oil and gas imports, in part, because the North Sea is a “mature basin” that saw its output collapse long before the UK even had a net-zero target.
Renewables and low-carbon technologies – often dismissed by the same newspapers – are expected to have a far greater impact on cutting imports than new drilling ever could.
Miliband’s ‘crusade’
Much of the criticism by these newspapers of Labour’s North Sea stance is tied to their highly personal criticism of Miliband. Of the 63 editorials arguing for more drilling, nearly three-quarters also attacked him as a “net-zero zealot” on a “green crusade”.
The Times said the energy and net-zero secretary was pursuing a “masochistic policy” by not expanding North Sea drilling and that he had “cloaked his zealotry in spurious rationality”.
This all fits with a broader trend that has seen right-leaning newspapers launch frequent, personal attacks on Miliband.
In the roughly two years since Labour won the election, giving the government a clear mandate for its net-zero policies, there have been around 230 editorials criticising Miliband.
(These have redoubled in recent days, amid rumours that he may be made chancellor under Andy Burnham, if the new Makerfield MP becomes the next prime minister, as is widely expected.)
Such attacks have increasingly spilled over into politics. Conservative shadow energy secretary Claire Coutinho has accused Miliband of “fanaticism” and Conservative leader Kemi Badenoch has even likened him to a “Nigerian military dictator”.
The newspapers have also interpreted any support for North Sea drilling as a rebuke of Miliband. Both the Sun and the Daily Telegraph welcomed an essay by Blair, in which he argued that “we must…use what is left of our North Sea oil and gas resources”.
The Sun heralded Blair as Labour’s “most successful election winner” and said he “nailed the chief mistakes” of the current government, including:
“Allowing Ed Miliband free rein on net-zero – especially the banning of North Sea drilling.”
Several of the newspapers have also thrown their support behind the Conservative party, as it frames itself as an anti-net-zero, pro-fossil fuel alternative to Labour.
The Daily Mail described Badenoch’s proposal to drill more in the North Sea as a “concrete plan”, while the Sun – in an echo of Trump’s slogan – has simply urged her to “drill, Kemi, drill”.


The post Analysis: UK newspapers have already printed 63 editorials in 2026 backing North Sea drilling appeared first on Carbon Brief.
Analysis: UK newspapers have already printed 63 editorials in 2026 backing North Sea drilling
Climate Change
Cropped 1 July 2026: Heatwave scorches Europe | UK 2050 farm plan | What’s next for the High Seas Treaty
We handpick and explain the most important stories at the intersection of climate, land, food and nature over the past fortnight.
This is an online version of Carbon Brief’s fortnightly Cropped email newsletter.
Subscribe for free here.
Key developments
Heatwave scorches European agriculture
‘PUSHED TO THEIR LIMITS’: The record-breaking heatwave that swept through much of western and central Europe in recent weeks had myriad impacts across the continent, reported Carbon Brief. Martin Lines, chief executive of the Nature Friendly Farming Network, explained: “Prolonged high temperatures place huge stress on livestock, dry out soils and reduce crop resilience, all while putting more pressure on nature.” The Times noted that “refrigerated warehouses were pushed to their limits” by the high temperatures.
POULTRY PROBLEMS: “At least several hundred thousand poultry” perished in France due to the extreme temperatures, the head of a French poultry-industry group told Reuters. A separate Reuters article said that “cows and pigs were suffering from heat stress” in Belgium, “which has raised concerns about milk and meat production”. Meanwhile, UK government data obtained by Carbon Brief showed that “twice as many animals died due to heat stress en route to slaughterhouses” amid record heat in 2025, compared to 2024.
FIRE AND ICE: The heatwave also had widespread impacts on the natural world. A wildfire scorched 200 hectares of moorland in Derbyshire, reported the Times. Derbyshire’s fire service said: “The ground is tinder dry and the slightest spark…could soon escalate to a major incident.” Agence France-Presse reported that “Swiss glaciers are set to lose an enormous amount of ice”, noting that this is the “second-earliest arrival on record of the tipping point known as ‘glacier-loss day’”.
UK 2050 farm plan
FARM CHANGES: The UK government launched a 2050 “farming roadmap” for England, setting out aims to make agriculture more resilient to climate change, increase domestic food production and boost nature recovery. The plan is “full of ambition”, but “falls short” on action and delivery, said National Farmers’ Union president Tom Bradshaw in a statement. Meanwhile, the government also announced £47m in funding for peatland protection and restoration schemes.
FOREST LOSS: UK companies may soon be required to “check that their supply chains are free from products linked to illegal land clearances”, reported the Times. The government revived plans for anti-deforestation rules for products such as soya, palm oil, cocoa and rubber, said the newspaper. The rules will initially target goods linked to illegal deforestation, but later move to a “blanket ‘deforestation-free’ standard”, it noted, adding that similar plans in the EU have been repeatedly delayed.
FRAUGHT FUND: UK energy secretary Ed Miliband was “poised to announce” a £400m commitment to the Tropical Forest Forever Facility, but the plan was “shelved over ‘optics concerns’” amid a “bitter row over defence spending”, said the Times. Meanwhile, one of Europe’s oldest and largest trees died after “becoming stressed by a series of hot, dry summers”, reported the Guardian. The Major Oak, which has grown in England’s Sherwood Forest “for at least 1,000 years”, did not produce leaves this year, said the newspaper.
News and views
- OCEAN ACTION: The Our Ocean Conference concluded in Mombasa, Kenya, with more than 300 voluntary commitments from governments, civil-society groups, non-governmental organisations and others, said Carbon Brief. Observers told the outlet that “these pledges must now be backed up by action”.
- HOT SEAS: Record-high global ocean temperatures in June could lead the world to “uncharted territory”, said the Financial Times. Meanwhile, the Independent reported that a species of sea star thought to be extinct was found off the coast of California.
- EU PLANS: The European parliament approved rules to allow the use of gene-edited plants, marking a “major shift” in the EU’s approach to modified crops, reported Bloomberg. Meanwhile, Grilled, a new investigative newsletter, said the EU is “considering an overhaul of how it measures methane emissions from livestock”.
- BRAZIL BLAZES: Last year, fires caused a “significant spike in forest loss” across three areas in Brazil home to Indigenous peoples living in “voluntary isolation”, according to Mongabay. Indigenous leaders told the outlet that fire “affects their productive practices and destroys the biodiversity and vegetation they depend on”.
- DISCLOSURE DISPARITY: The Biodiversity Footprint Company analysed the climate- and biodiversity-related disclosures of “120 of the world’s largest listed companies”. It found that “companies disclose roughly two-thirds of assessed climate information, yet less than one-20th of the equivalent biodiversity information”.
- FRUITLESS: Fruit growers across the US south-western state of Utah “are reporting near-total harvest losses”, reported High Country News. It noted that a warm, dry winter, followed by a “record-breaking spring heatwave”, led orchards to bloom early, but the crop was then “devasta[ed]” by a “series of April freezes”.
Spotlight
‘Up and running immediately’: what’s next for the High Seas Treaty

This week, Carbon Brief speaks to Rebecca Hubbard, director of the High Seas Alliance, about the High Seas Treaty (also known as the agreement on the conservation and sustainable use of marine biological diversity of areas beyond national jurisdiction, or BBNJ). This interview was conducted at the Our Ocean Conference in Mombasa, Kenya.
This interview has been lightly edited for clarity and length.
Carbon Brief: What connects BBNJ and climate change?
Rebecca Hubbard: The high seas cover half of the planet, or two-thirds of the global ocean. The ocean is essential for many things, including producing oxygen, absorbing carbon and absorbing the enormous amount of excessive heat we’ve produced as a result of burning fossil fuels. The ocean, including the high seas, cannot perform its critical climate-regulating role without healthy populations, without being healthy, and – at the moment – the high seas are not protected.
In fact, only around 1% of the high seas are protected and they’re under immense pressure from shipping, fishing, pollution [and] climate change – both heating and acidification. The High Seas Treaty, for the first time ever, gives us the legal framework to be able to protect the high seas. By being able to protect and better manage the high seas, we are assuring its critical role in protecting us from the worst of climate change.
CB: What were your hopes or expectations coming into this conference?
RH: My hopes were that we would get strong engagement and leadership from African states in the High Seas Treaty and we have seen that, which is really fantastic. There’s been a lot of support, a lot of leadership from African governments on the treaty and on their ambitions to not just complete their ratification processes, but to also start looking at creating marine protected areas. They want to be engaged and involved in leading and delivering those processes and I think that’s really exciting. It’s a great opportunity for the whole world. We can really get some exciting collaborations.
CB: What has been missing from the conversation here?
RH: I actually don’t think much has been missing, because I think there’s been a lot of different conversations. There’s been conversations around the need for finance to implement the treaty and this is something that’s common across all multilateral environmental agreements – certainly no stranger to the climate process. We’re going to need this huge amount of resources to implement the treaty. Where is that money coming from?
CB: We’ve got almost exactly six months until COP1 [the first Conference of the Parties for the High Seas Treaty scheduled for January 2027]. What needs to happen between now and then?
RH: We need as many more countries to ratify as possible. We hope that well over 100 countries will be party to the agreement by COP1, so that they can be at the decision-making table. We need countries to really prepare for that COP, so that they’re ready to really efficiently make the decisions founded off all of the work that we’re done through the PrepCom [preparatory commission] meetings [and] so that we can get the rules of procedure and the subsidiary bodies that are going to be essential to an effective implementation up and running immediately.
There is so much to do and we do not have time to waste with circular negotiations, rehashing resolved issues. We also need countries to continue to prepare for implementation, particularly back in their capitals – establishing inter-ministerial committees, so that you have a cohesive and united approach from governments that reflects a whole-of-government approach. That’s what’s going to be essential for effective implementation.
Watch, read, listen
‘ELEPHANT MARSH’: Mongabay delved into the knock-on effects of a 2023 cyclone on farming households living in Malawi wetlands.
REEF RESILIENCE: In bioGraphic, journalist Claudia Geib explored the unexpected resilience of a coral reef in Miami that is home to some critically endangered species.
TRUMP VS ALGAE: The Guardian Science Weekly podcast discussed the causes of algal blooms, in light of the green algae saga at the Lincoln Memorial reflecting pool in Washington DC.
FRAUGHT FARMING: A century-old state law protects the water rights of just a handful of users on the Deschutes River at the expense of the region’s farmers, said Oregon Public Broadcasting.
New science
- Growing oil crops, such as oil palm and coconuts, potentially caused the long-term loss of 1.5% of global plant and animal species between 1995 and 2020, with largest impacts in the tropics | Nature Food
- “Climate-smart agriculture” is improving household resilience in Ethiopia, but scaling its benefits requires addressing “local realities and inequalities” | Mitigation and Adaptation Strategies for Global Change
- Drought has been linked to “abundance declines” and range shifts in 40% of 37 birds species living in the deserts of the western US | Conservation Letters
In the diary
- 1-3 July: UN Food and Agriculture Organization global conference on “smart farming” | Rome (webcast available)
- 13-31 July: Meeting of the International Seabed Authority assembly and council | Kingston, Jamaica
- 14 July: Launch of the “state of food security and nutrition in the world” report | New York City
- 27 July-1 August: Scientific and technical subsidiary body meeting of the UN Convention on Biological Diversity | Nairobi, Kenya

The post Cropped 1 July 2026: Heatwave scorches Europe | UK 2050 farm plan | What’s next for the High Seas Treaty appeared first on Carbon Brief.
Climate Change
Proposal for ‘Hyperscale’ data centre in remote Northern Territory demonstrates need for urgent moratorium
SYDNEY, Wednesday 1 July 2026 — The proposal for the ‘Project Ares’ data centre in remote Northern Territory, which would be powered by off-grid gas and renewables, has prompted renewed calls from Greenpeace for an urgent moratorium, citing serious concerns about emissions and environmental harm.
The application for the project under the EPBC Act reveals the gas-fired generation for the project would be approximately 1,038MW at full build-out, which would more than double the NT’s current gas-fired generating capacity.
A recent report by Greenpeace Australia Pacific and independent expert Ketan Joshi, Energy Vampires: the AI data centres draining Australia, revealed how the frenzied rollout of AI data centres in Australia is set to derail the renewable energy transition, entrench gas and turbocharge climate pollution.
Solaye Snider, Campaigner at Greenpeace Australia Pacific, said: “Proposals like Project Ares, which would have significant off-grid gas powered generation and emissions, should not be moving along while there are still zero binding regulations to limit the impacts of AI data centres on our communities and environment.
“This hyperscale project proposes massive new off-grid gas infrastructure, making a mockery of the Federal Government’s unenforceable ‘expectations’ that data centres will cover their own power use with renewables. Communities will pay the price for the data centre industry’s endless hunger for energy at any cost.
“This proposal also raises serious questions about where this new gas would come from. Could it come from fracking the Beetaloo? Communities deserve to have the full picture before this project is approved.
“The Australian Government is asleep at the wheel when it comes to the rapid roll-out of AI data centres. We need an urgent moratorium on the construction and approval of new data centres, so our government can take appropriate time to legislate the regulations and safeguards we so desperately need.”
-ENDS-
Media contact
Lucy Keller on 0491 135 308 or lucy.keller@greenpeace.org


Analysis: UK newspapers have already printed 63 editorials in 2026 backing North Sea drilling

Cropped 1 July 2026: Heatwave scorches Europe | UK 2050 farm plan | What’s next for the High Seas Treaty

Best of Sustainability In Your Ear: Building The Circular Economy With Glacier CEO Rebecca Hu-Thrams
-
Greenhouse Gases11 months ago
Guest post: Why China is still building new coal – and when it might stop
-
Climate Change11 months ago
Guest post: Why China is still building new coal – and when it might stop
-

 Greenhouse Gases2 years ago
嘉宾来稿:满足中国增长的用电需求 光伏加储能“比新建煤电更实惠”
-

 Climate Change2 years ago
嘉宾来稿:满足中国增长的用电需求 光伏加储能“比新建煤电更实惠”
-

 Renewable Energy8 months ago
Sending Progressive Philanthropist George Soros to Prison?
-
Climate Change2 years ago
Bill Discounting Climate Change in Florida’s Energy Policy Awaits DeSantis’ Approval
-

 Carbon Footprint2 years ago
US SEC’s Climate Disclosure Rules Spur Renewed Interest in Carbon Credits
-
Greenhouse Gases12 months ago
嘉宾来稿:探究火山喷发如何影响气候预测