
尽管中国电力需求快速增长,但清洁能源发电的增长首次使该国的二氧化碳(CO2)排放量出现下降。
Carbon Brief的最新分析显示,2025年第一季度,中国的碳排放量同比下降了1.6%,过去12个月则下降了1%。
新增风电、太阳能和核电的装机容量所带来的出力,足以应对电力需求激增,从而削减燃煤发电量;而此前的排放下降则主要被归因于经济增长放缓。
这项基于官方数据和商业数据的分析显示,中国的碳排放量一年多来一直保持稳定或下降。
不过,该排放量仅比最近的峰值低1%,这意味着只要出现短期反弹,中国的碳排放就可能创下新高。
其他主要发现包括:
- 清洁能源发电增长速度已经超过当前及长期电力需求增长平均值,从而压低了化石燃料的使用量。
- 截至2025年3月的12个月内,电力行业的碳排放同比下降了2%。
- 若这一趋势得以保持,意味着中国电力行业排放可能已达峰并开始持续下降。
- 美国总统特朗普发动的“贸易战”促使中国更加努力将经济重心从出口转向内需。
- 新出台的可再生能源电价政策催生了“抢装潮”,企业争相在政策实施前完成项目建设。
- 如果中国要实现在《巴黎协定》下承诺的2030年排放目标,仍面临日益扩大的差距需要弥补。

如果这种因清洁能源增长而带来的电力行业碳排放下降趋势得以延续,可能预示着Carbon Brief此前在分析中预测的结构性排放下降的开始。
电力行业碳排放下降的趋势很可能在2025年继续。
然而,未来的走势在很大程度上将取决于中国即将于明年公布的下一份五年规划中所设定的清洁能源与减排目标,以及中国对特朗普政府敌对贸易政策的应对策略。
中国碳排放因清洁能源而下降
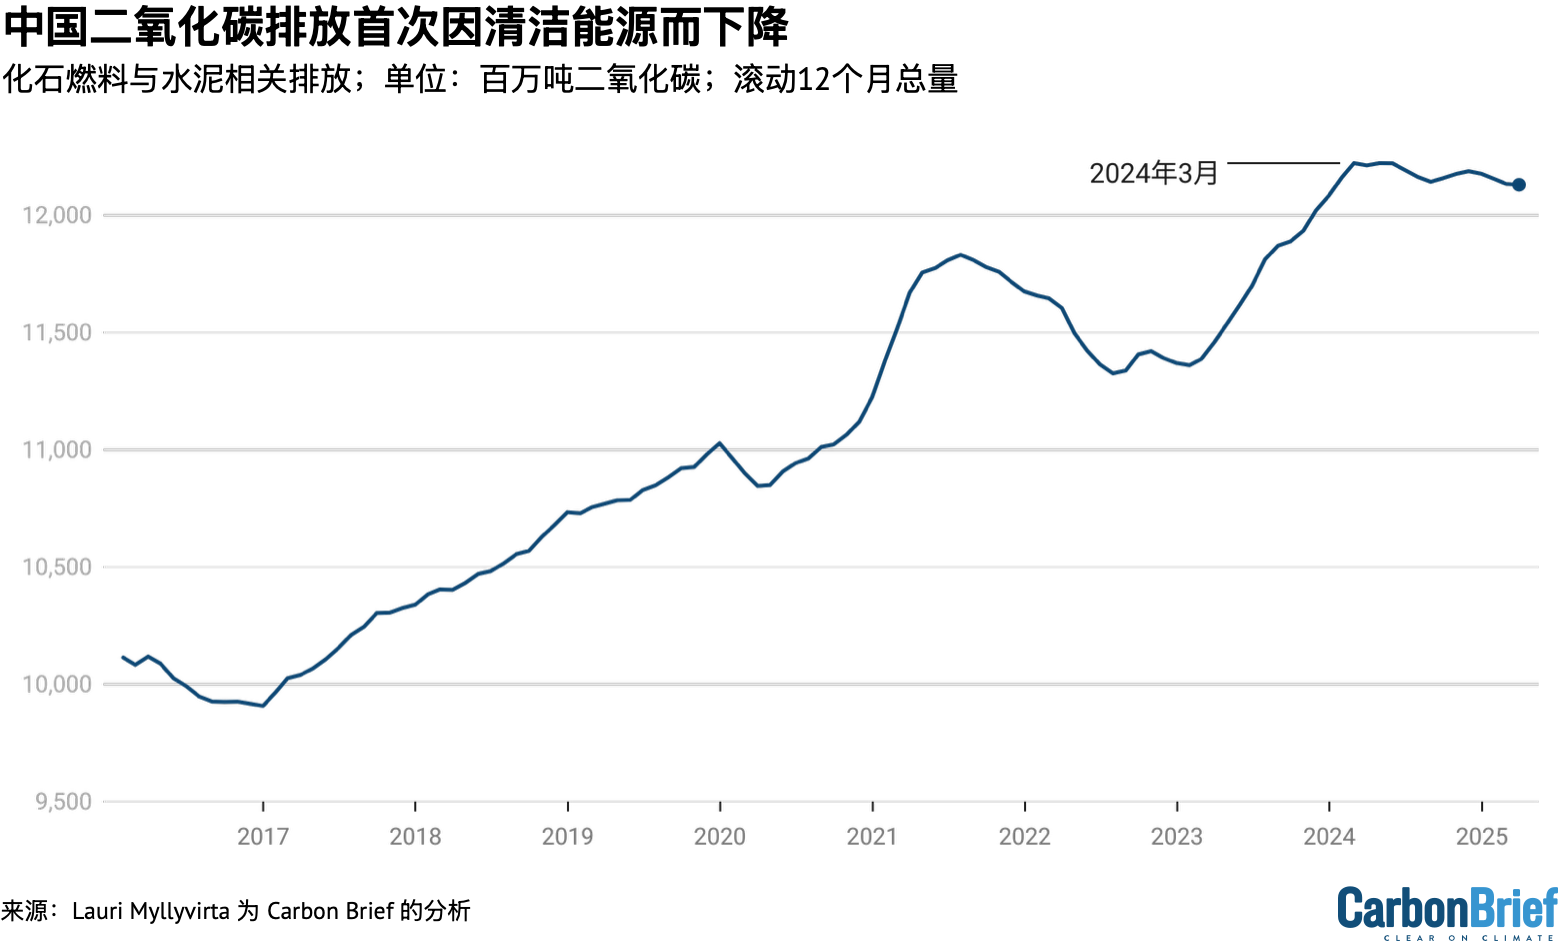
过去十年来,尽管中国化石燃料和水泥行业的碳排放量有高低起伏,但总体上升了20%。
最新数据显示,该排放量可能已经接近达峰以及趋稳,甚至正步入结构性下降的阶段。
截至2025年第一季度的最新数据显示,中国的碳排放量已经连续一年多呈现稳定或下降趋势,如下图所示。
不过,由于该排放量仅比最近的峰值低1%,这意味着其仍有可能在短期内反弹并创下新高。
因此,中国未来的碳排放走向尚未确定,这取决于各经济部门的趋势,以及中国对特朗普关税政策的应对方式。
电力行业排放下降,其它行业却现反弹
2025年第一季度中国碳排放的下降主要源于电力行业排放下降了5.8%。尽管整体电力需求增长了2.5%,但火电(主要是燃煤和燃气发电)却减少了4.7%。
由于大量新建风电、太阳能和核电装机投入运行,发电量的增长足以弥补需求的增长。水电发电量也有所上升,虽然其受季节因素影响,但同样对化石能源的替代发挥了作用。
电力行业碳排放降幅超过化石能源发电量降幅,因为生物质和天然气的占比上升,同时燃煤电厂的平均能效也有所提升。
具体而言,燃煤电厂度电煤耗平均下降了0.9%。
下图底部显示了第一季度电力行业煤炭使用造成的碳排放量减少情况,该数据低于其他行业的碳排放量变化。
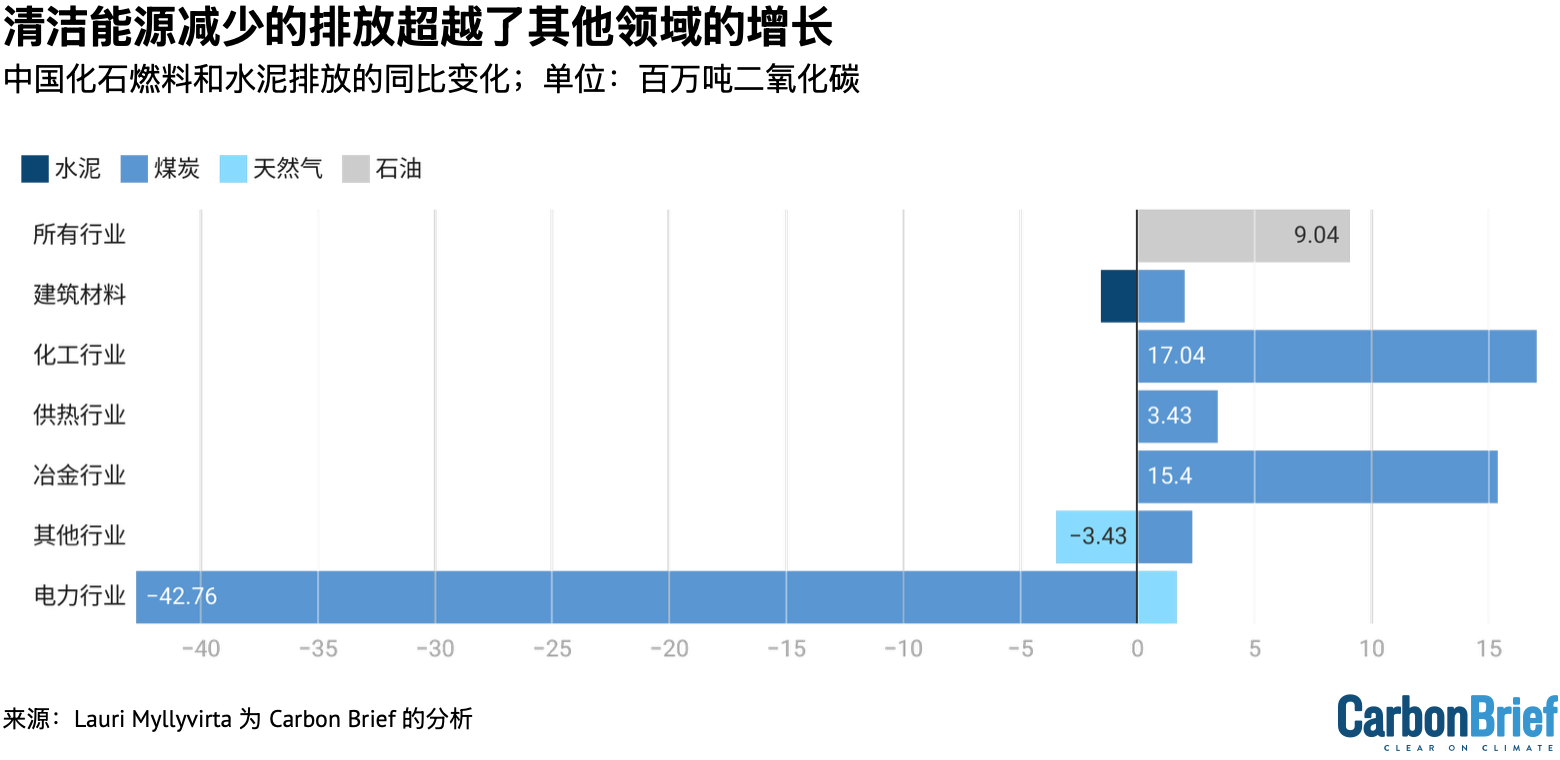
而在电力行业之外,碳排放量增长了3.5%,其中以金属和化工行业的煤炭使用增幅最大。
煤制化工产业正在快速扩张,背后的推动力包括对进口油气依赖的担忧。2025年第一季度,由于煤价走低而油价偏高,该产业的经济性更具吸引力。
粗钢产量同比增长了0.6%,金属制品增长6%,有色金属产量增长2%。这些增长主要集中在3月份,企业赶在关税生效前集中出口,带动金属需求激增,而高产出一直持续到4月。
房地产开工量同比下降24%,新房销售下降3%,反映出建筑行业对水泥、钢材和玻璃的需求持续疲软。
相比之下,汽车和机械制造的经济产出分别增长了12%和13%,表明对金属的需求正在上升。
水泥产量同比下降1.4%,降幅低于往年,可能是由于气温偏高使得依赖天气的施工活动提前启动。
由于燃气发电装机容量增长14%,尽管燃气发电的平均利用率下降,但电力行业的天然气消费量估计增长了6%。但在其他行业,天然气消费减少,总体上抵消了电力行业天然气需求量的增长。
石油制品消费略有上升,如图中最上方所示。由于天气偏暖,依赖天气的施工和农业活动与往年相比提前开工。
然而,从结构性角度来看,汽车电动化和货运行业改用液化天然气,预示着石油需求将持续走低。
中国是否已经碳达峰?
在2025年第一季度排放量同比下降1.6%之际,中国的碳排放自2024年3月以来已连续一年多保持平稳或下降态势。
然而,截至2025年3月底的12个月内,排放量仅比近期峰值下降了1%,这意味着只要出现短期反弹,排放量就可能再创新高。
继一季度大幅下降后,电力行业过去12个月的排放量同比也出现下滑。
在过去40年里,这种情况曾经发生过四次——分别是在2009年、2012年、2015年和2022年。但此次下降首次主要得益于清洁能源发电的增长。

2025年一季度清洁能源发电增速不仅超过整体用电需求增长,也高于过去15年电力需求的平均增长,如上图虚线所示。
此外,过去六个月水电发电量同比保持稳定,这意味着这轮清洁能源的增长是由太阳能、风能和核电装机容量的增长所推动的,而非水电的逐年波动所致。
除发电行业外,2024年12月到2025年3月期间,各行业碳排放均有所下降,但煤化工是个例外。
要使中国整体碳排放量达峰并开始下降,各下降行业的减排总量需超过仍在增长行业的排放增量。
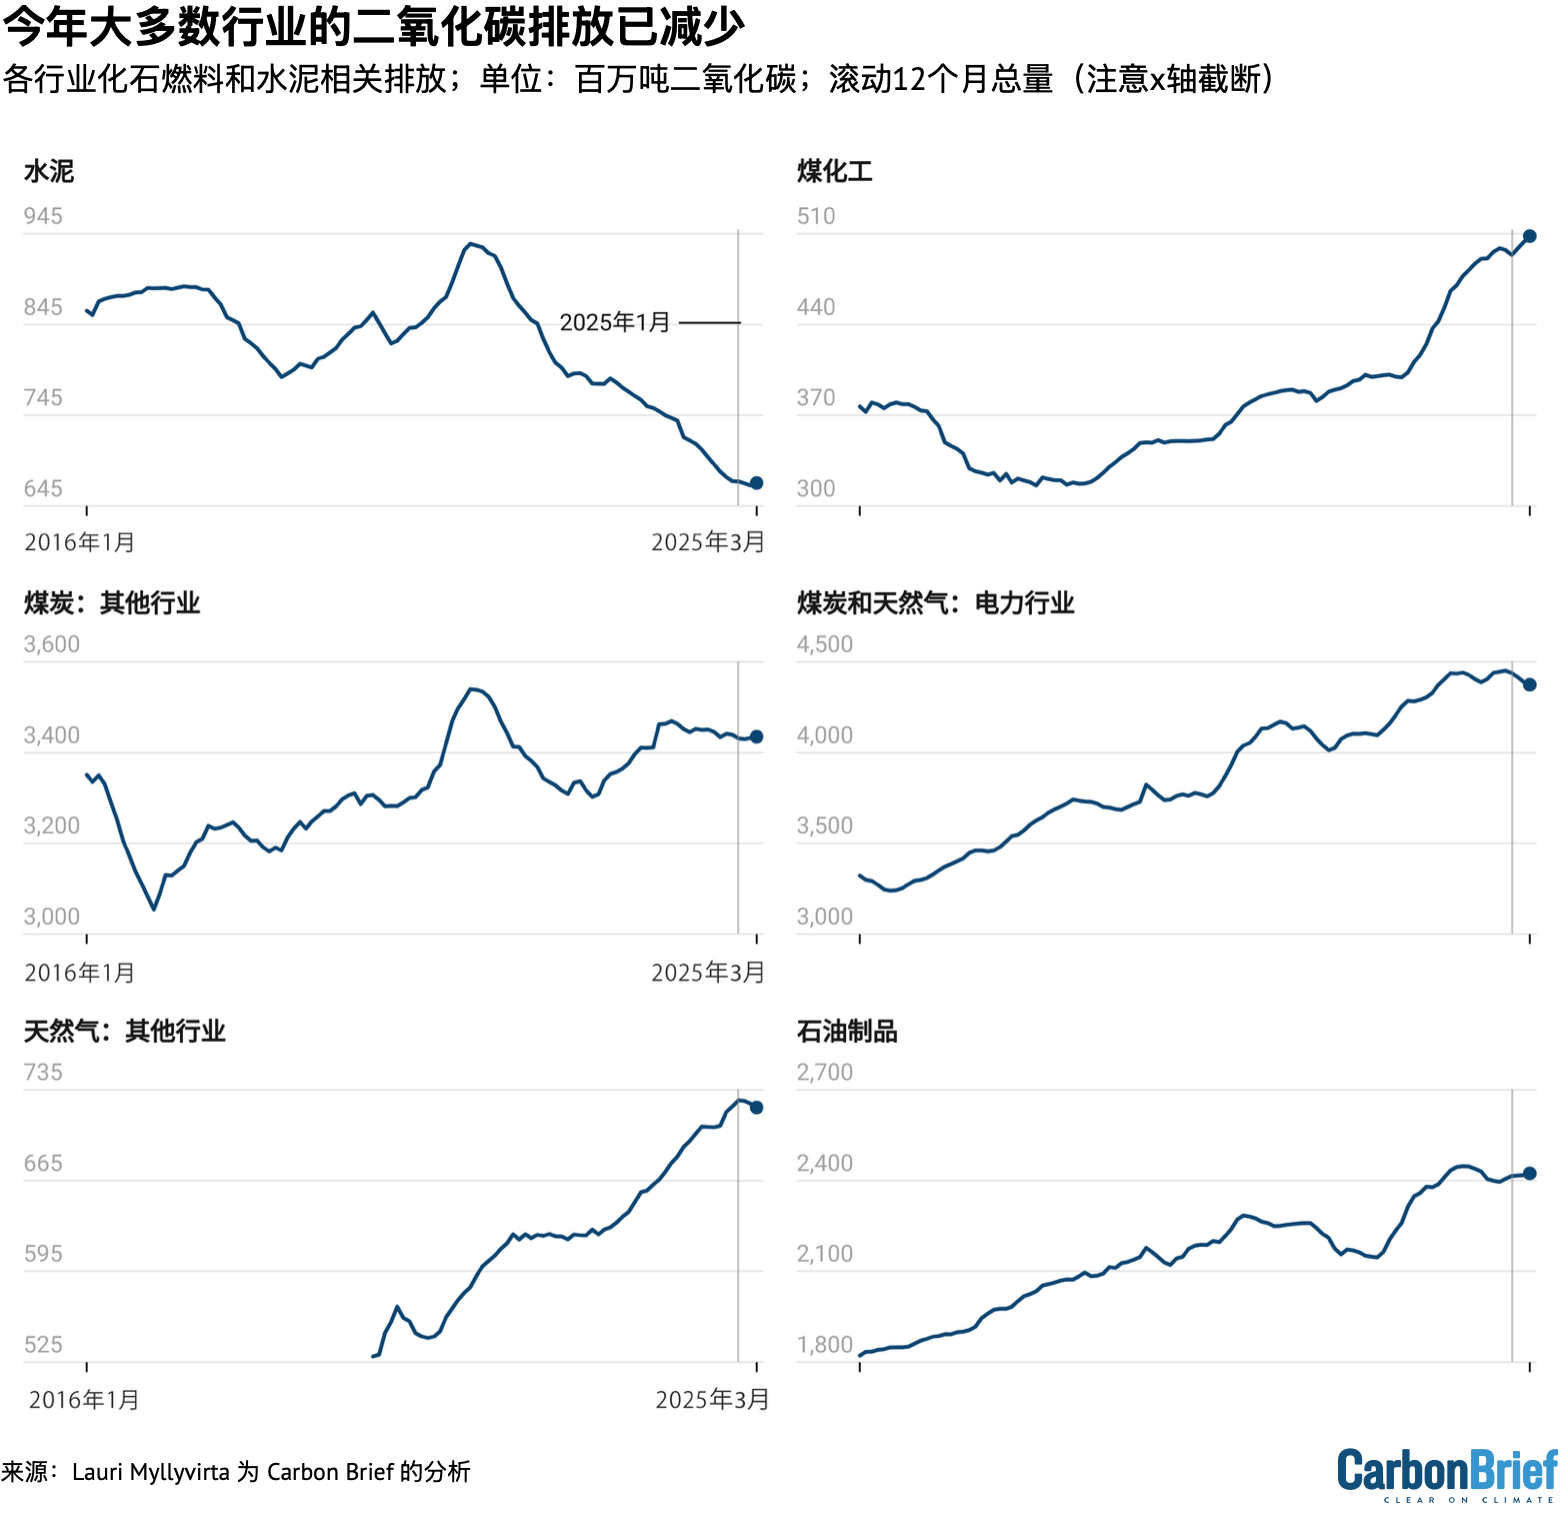
电力和化工以外的煤炭使用量与水泥行业同时达峰,但此后一直在反弹,目前已接近之前的峰值水平。
中国煤炭工业协会预计,钢铁和建材行业的煤炭使用量将下降,而化工行业的煤炭消费量将继续增长。
对煤炭未来需求增长的预期主要集中在化工行业,这也代表着煤炭从单纯的燃料向燃料和原料双重角色的转变。
该协会还认为,燃煤发电将至少在短期内恢复增长,但他们已将2025年的预测下调,与2024年底的展望相比有所保守。
“关税战”可能影响了预期。有分析指出,如果中国GDP因关税下降0.5到1个百分点,可能导致主要用于发电站的燃煤需求也出现类似的下降。
疫情后经济反弹到2024年3月结束,石油产品的消费量自此下降,较峰值减少了2%。尽管化工和航空领域的需求在上升,但由于交通运输领域电气化趋势增强,预计其长期仍呈下降趋势。
天然气的使用量近几个月有所下降,但总体趋势仍可能保持上升。
下表列出了每个行业在12 个月周期内的最高排放量,以及自最新峰值以来的减排量。
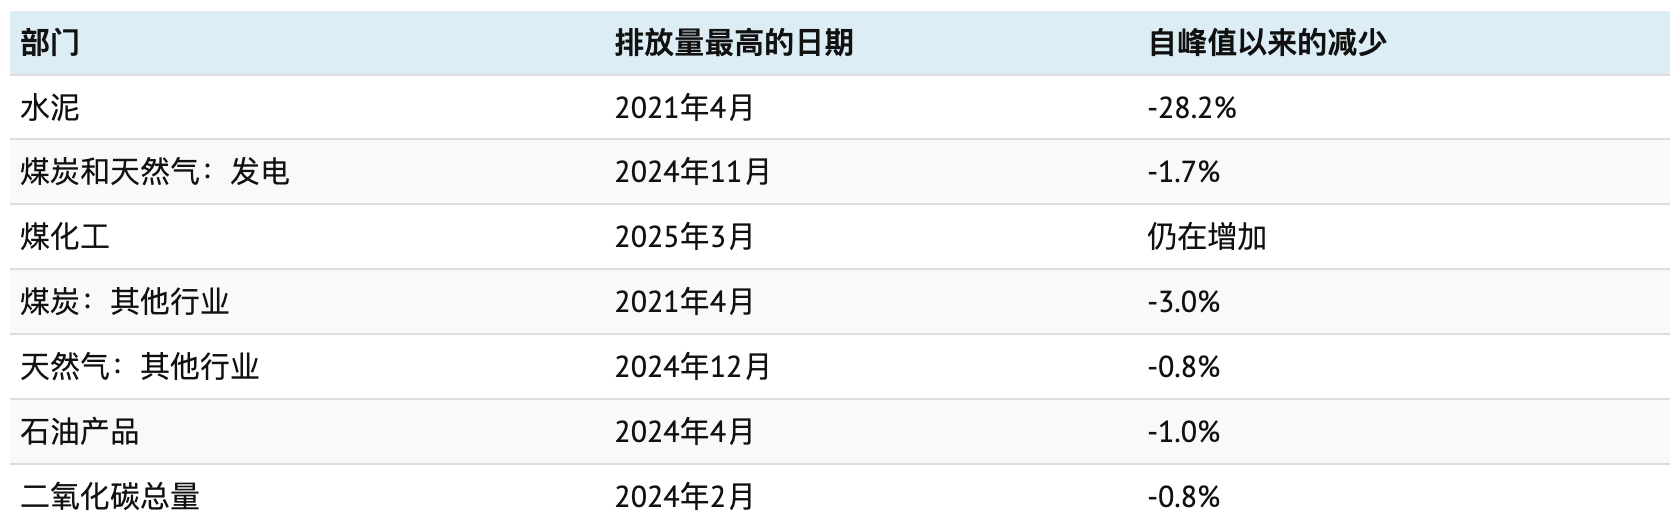
除了水泥生产之外,其他行业目前还不能明确判断是否已达排放峰值。然而,有迹象表明,其他行业的峰值也可能已经过去。
诚然,对于石油产品消费和钢铁生产而言,行业预测表明未来排放趋势可能会下降。
对于电力行业而言,只要新增清洁能源装机容量维持在当前或更高水平,就有望带来结构性的排放峰值——因为清洁能源的增长足以覆盖新增的电力需求。
这些行业碳排放量合计占全国八成以上。若这些行业均进入结构性下降阶段,那么中国碳排放总量很可能将开启持续下降通道。
中国推动内需应对美国关税
特朗普政府实施的史无前例的贸易关税政策,以及中国的反制措施,将影响今年及未来中国的经济和碳排放前景。
关税措施实施后,首当其冲的是中国沿海出口大省的工厂减产,从而导致排放下降,同时也可能波及投资和消费支出。
但因双方随后达成90天休战协议,反而刺激美国订单短期内激增,以弥补短暂的贸易放缓,并在休战结束前囤积商品。
中国对关税的反应主要集中在通过刺激措施抵消其经济影响。
虽然暂时的休战会降低出台刺激政策的紧迫性,但当前美国对中国的平均关税税率仍高达40%,远高于特朗普上台前的水平,因此中国领导层也很可能在为未来再次加征关税做好准备。
中国的重点将是为那些原本出口至美国的产品开拓国内市场。这一转向或将助力中国实现长期以来所希望推动的经济向消费驱动型增长转型,而成功实现经济再平衡,有望带来更低能耗的经济增长。
中国的应对措施还包括加大对“新质生产力”的重视,该概念强调新兴科技的发展。
这一概念涵盖了清洁能源产业,该产业如今已成为中国经济的重要引擎,因此难以在刺激计划中被忽视。
中国发改委最新公布的低碳示范项目清单,明确了清洁能源投资的重点方向。绿氢、储能、“虚拟电厂”以及基于氢能的工业脱碳是新的增长领域。
从碳排放角度来看,中国对特朗普关税的反应最关键的问题在于:针对这些优先领域(包括新兴的低碳领域及其他清洁能源产业)的刺激措施,是否足够有力。
新风光电价政策加剧不确定性
中国碳排放面临的另一个不确定性来源,是即将于今年6月生效的新可再生能源电力电价政策。
新政策取消了与煤电价格挂钩的价格保障机制,要求新的风电和太阳能发电项目与购电方直接签订电力合同。这可能导致新建风电和太阳能发电项目的售电价格下降。
不过,政策也为满足中央政府能源目标所需的新增装机容量提供了更有利的价格机制——“差价结算”。
该政策的直接影响可能是大量项目争相在6月前完成投产,以确保能够按现行政策享有机制电价。
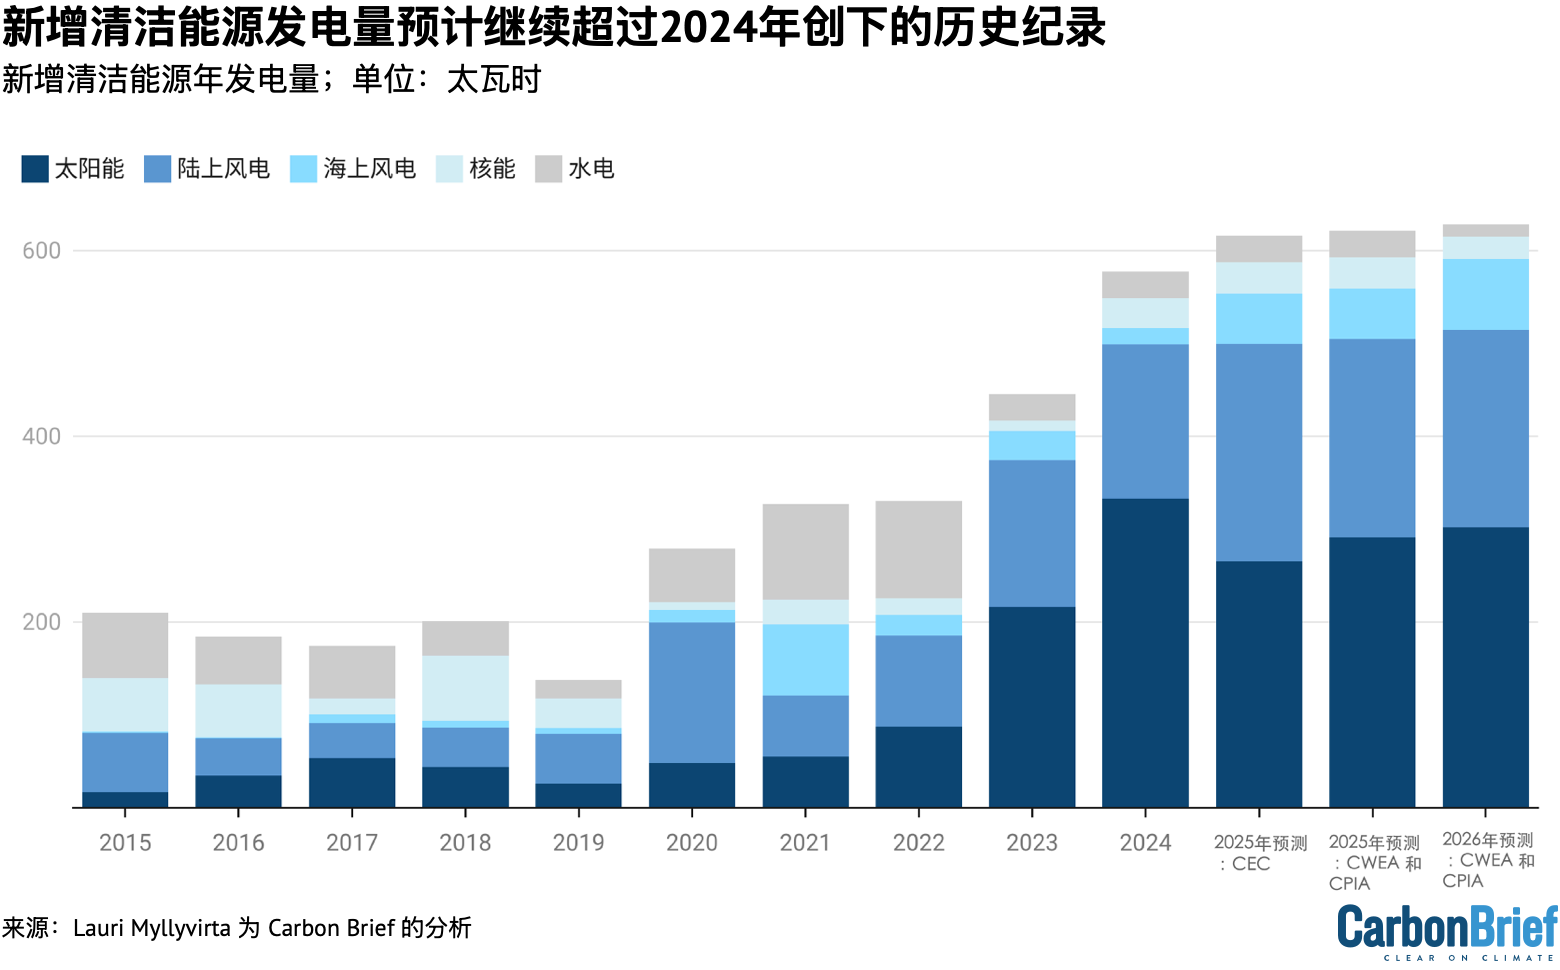
其效果已经体现在最新数据中:仅 3 月份中国就增加了 23 吉瓦 (GW) 的太阳能和13GW的风能,比该月之前的新增太阳能和新增风能的最高记录高出80%和110%。
下图根据不同的预测显示,预计2025年和2026年新增清洁能源发电量仍将高于去年创纪录的水平。
然而,这一政策也带来了更大的不确定性。一些行业,尤其是分布式光伏,将经历上半年装机量的激增而下半年放缓的艰难时期。
不确定性主要集中在两个方面。首先是地方如何执行这一政策,因为省级政府拥有相当大的回旋余地。考虑到清洁能源对许多省份经济的重要性,预计地方政府会力求以尽量不扰乱行业的方式来落实政策。
第二个不确定性来自中央政府的能源目标。新电价政策将更优惠的价格与中央政府的能源目标挂钩。而在过去几年中,清洁能源增长远远超过了官方设定的目标。
这凸显了即将出台的“十四五”规划中能源目标的关键作用。国家能源局设定的目标是“年均新增2亿千瓦(200吉瓦)以上新能源的合理消纳利用”,这一数字远低于去年实际新增的360吉瓦。
当然,电价政策的最终效果也取决于市场环境。当前中国煤电项目仍在快速上马,存在产能过剩风险。
中国与巴黎承诺之间的差距扩大
中国风电光伏发展面临的不确定性,也对该国履行《巴黎协定》下的国际气候承诺带来影响。
2020-2023年碳强度(即单位经济产出的排放量)下降进度明显滞后,中国已经明显偏离实现其2030年碳强度承诺的路径,几乎可以肯定将无法实现2025年的阶段性目标。2024年中国的碳强度下降了3.4%,未达到实现2025年和2030年目标所需的改善速度。
2025年政府工作计划中并未设定碳强度目标,仅包含单位国内生产总值能耗降幅超过3%(不包括原材料消耗)的目标。
这可以间接反映碳强度的改善幅度。2024年,中国的碳强度下降了3.4%,而化石能源使用强度下降了3.8%。如果2025年两者之间的比例相似,那么碳强度可能只能下降大约2.5%。在这种情况下,如果GDP增长达到5%的目标,碳排放量仍可能上升超过2%。
政府工作计划中没有设定碳强度目标,也没有特别强调碳强度的下降,显示出当局当前并未将实现这一目标作为优先事项。
政府工作报告中强调了“双碳”目标,即在2030年前实现碳达峰、2060年前实现碳中和。
然而,按照这些目标,2030年前碳排放仍可继续增长。这意味着到该年度,绝对排放量可能在2024年的水平上大幅增加。因此,即便“双碳”目标得以实现,也不能确保中国当前最核心的国际气候承诺——2030年碳强度目标——能够兑现。
即便今年碳排放有所下降,未来五年也需要大幅加快碳强度改善步伐,才能兑现中国2030年《巴黎协定》承诺。
如果中国仍然致力于兑现2030年承诺,那么该过程就需要体现在下一个五年规划设定的目标中。
2025年及未来展望
过去12个月可能标志着中国二氧化碳排放的一个重要转折点:清洁能源的增长首次超过电力需求增长,并在电力领域取代了化石燃料的使用。
尽管新的电价政策带来了一定的不确定性,但预计2025年仍将迎来创纪录的清洁能源新增装机容量,这表明这种趋势将在今年持续。
中国碳排放的未来长期走势将在很大程度上取决于即将出台的五年规划中设定的目标,以及北京应对美国关税和其他经济压力所采取的政策。
从短期看,美国加征关税将抑制能源需求增长和排放水平。为抵消特朗普关税影响而制定的经济政策,很可能会进一步推动清洁能源产业的发展,并可能促使经济重心转向国内消费,这意味着能源消费的增长将相对于GDP增长更少。
但另一方面,中国此前的经济刺激措施往往伴随着排放的急剧上升。中国若想转向消费和新技术驱动的刺激政策,而非高碳排的基建重工业,就必须突破传统发展模式。
电力行业的排放是否已经达峰,将取决于清洁能源供应增长与总体电力需求增长之间的竞赛。
按行业来看,除了电力行业,建筑材料、钢铁以及石油制品消费等领域的排放也可能已经达峰。
这些行业合计占中国与化石燃料相关碳排放的80%以上。然而,在所有这些行业中,都存在短期反弹的可能和不确定性。
目前仍有较大排放增长潜力的行业是煤化工。美国加征关税后国际油价的下跌将削弱该行业的盈利能力,可能导致即便新增产能增加,其工厂利用率也将下降。中国对自美国进口石化产品征收的报复性关税本可能本可能使煤化工行业受益,但这些关税据报已被豁免。
总体而言,这些因素可能推动中国未来五年排放持续下降,并有望在未来五年内实现大幅绝对减排。
然而,若政策出现转向,也同样可能导致碳排放在通往2030年的过程中继续上升。


The post 分析:清洁能源首次助力中国碳排放下降 appeared first on Carbon Brief.
https://www.carbonbrief.org/translations-analysis-clean-energy-just-put-chinas-co2-emissions-into-reverse-for-first-time/
The UK has abandoned projects worth tens of millions of pounds that were meant to help protect Congo rainforests and support local people.
Together, these initiatives would have made up around half of the £200m that the UK pledged to support conservation in the Congo basin – the world’s second-largest rainforest.
When it hosted COP26 in Glasgow, the UK led a new initiative to end forest loss, which included a collective pledge by 12 donors of “at least” $1.5bn (£1.1bn) for Congo rainforest nations by 2025.
Development minister Jenny Chapman revealed last week that, as of 2024, the UK had only provided £39.8m towards this goal.
Alongside the US and much of Europe, the UK has significantly cut its aid budget in recent years, leading to much of its Congo rainforest spending being cancelled or reappraised.
The government says it still plans to “prioritise” rainforest regions, including the Congo basin, but civil society groups and MPs are concerned about the lack of “ring-fenced” forest funding in the UK’s new aid strategy.
COP pledge
At COP26, the UK – led by then prime minister Boris Johnson – launched the “Glasgow leaders’ declaration”, with a goal to “halt and reverse forest loss” by 2030. This was backed by more than 140 nations.
The UK also made various funding pledges, including £200m to protect the Congo basin, £350m for tropical forests in Indonesia and “up to £300m” for the Amazon.
These commitments target the world’s three largest rainforests, all of which face major forest loss due to threats such as agriculture, logging and climate change.
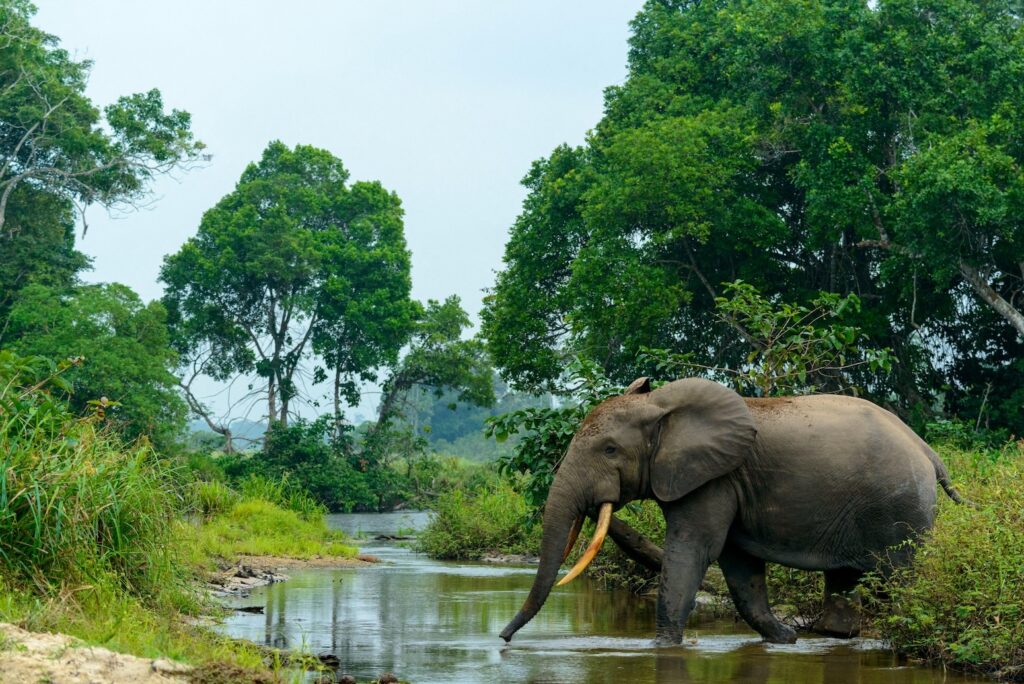
The Congo basin is the planet’s largest forested carbon sink. Yet, its six host nations are among the poorest in the world and face significant funding barriers.
This has global ramifications. An official UK assessment warned that “degradation or collapse” of the Amazon or Congo rainforests “threaten UK national security and prosperity”.
Forest cuts
Following successive aid cuts introduced by both the Conservative and then Labour governments – tracking a global trend – the UK’s Congo funding is under threat.
The Congo basin forest action programme (CBFA) was launched by the UK at COP27. It was explicitly set up to provide “roughly half” of the UK’s £200m Congo pledge.
CBFA set out to “empower central African nations”, such as the Democratic Republic of the Congo (DRC), with support for “community forests” and other measures to curb forest loss.
Now, after reporting delays, the UK has slashed the CBFA as part of the Labour government’s recent aid cuts, intended to free up money for defence spending.
Its original £90m budget has now been reduced to £18.8m. Government data shows that £15m of this has already been spent.
This is not the only Congo project that has been dropped due to this latest round of aid cuts.
The Congo part of the biodiverse landscapes fund – championed by the previous government and worth at least £12.3m – has been closed, just two years into its seven-year schedule.
Government documents reveal more Congo forest funding is at risk as the UK scales back its aid budget, including the UK’s two largest remaining projects in the region.
One initiative, intended to “incubate forest-friendly enterprises” in DRC, faces “reduc[ed] budgets”. Officials working on the other, while more optimistic, reported that the project may be forced to operate in fewer countries as the cuts set in.
Documents also reveal the difficulties that come when operating in the Congo, including “complex political economies” and, in Gabon, a military coup – which “complicated matters”.
‘Breaking promises’
Damian Fleming, a senior director of forests at WWF International tells Carbon Brief:
“Tropical forest countries are making long-term policy and development choices in expectation that international partners will honour their commitments.”
In a series of recent parliamentary responses, Chapman revealed that the UK had only spent £39.8m on Congo forest finance, as of 2024. (She declined to provide any information on the Indonesia and Amazon regional goals.)
Despite being presented as the UK’s “contribution” to the £1.1bn-by-2025 global goal agreed at COP26, the £200m target has a deadline of 2029.
Therefore, while the collective goal has been met, the UK’s contribution so far has been relatively small.
Zac Goldsmith, a former Conservative minister who oversaw the forest targets at COP26, tells Carbon Brief that, in his view, the UK has “discarded” its regional pledges:
“We have gone from being perhaps the leader on protecting nature internationally to breaking promises to countries around the world for whom the environment is an existential issue.”
Future targets
The Labour government says it has met the five-year “climate finance” target of £11.6bn that expires this year.
Ministers also say the government has met “and exceeded” the £3bn and £1.5bn sub-goals for “preserving nature” and forests, respectively, within the £11.6bn. These are the funding streams that include support for the Congo basin and other rainforests.
The UK has funded a variety of projects in line with its forest goals, including mangrove restoration in Indonesia, support for carbon-offsetting projects in Brazil and promoting “forest stewardship” among farmers in Cameroon.
Chapman has stated that the UK will continue to “prioritise” the Congo rainforest, in line with its new plan for aid spending in Africa. The UK even helped to launch a new “call to action” for Congo basin funding at COP30 last year.
The UK government also says it supported the creation of Brazil’s flagship “Tropical Forest Forever Facility” (TFFF). However, so far it has not provided any funding for the facility.
When the government announced a new climate finance pledge for 2026 onwards, it stressed that nature would still be a “focus” and said it would also generate billions in “climate and nature positive investments”. Nevertheless, it dropped the “ring-fenced” amounts for nature and forests that had appeared in its previous pledge.
The UK, alongside other developed countries, has pledged to provide biodiversity finance to developing countries, under the Kunming-Montreal Global Biodiversity Framework (GBF) – a non-binding global pact to halt and reverse nature loss by 2030.
Sarah Champion, chair of the international development committee of MPs, says “sub-pledges” for nature and forests are a “cost-effective and impactful” way to ensure this finance is provided, alongside climate finance. She tells Carbon Brief that she was “concerned” about the move away from this approach:
“When the minister recently appeared before the international development committee, I was concerned to hear her characterise this shift as a ‘gamble’.”
A government spokesperson tells Carbon Brief:
“We remain committed to providing finance for forests, including in the Congo basin, as a core element of our overall climate funding.”
A shorter version of this article was first published in Cropped, Carbon Brief’s fortnightly newsletter that provides a digest of food, land and nature news, on 15 July 2026. Subscribe for free.

The post UK withdraws millions in funding from world’s second-largest rainforest in Congo appeared first on Carbon Brief.
UK withdraws millions in funding from world’s second-largest rainforest in Congo
Climate Change
Cropped 15 July 2026: Uganda starves | Trump opens endangered habitats | UK cuts rainforest aid
We handpick and explain the most important stories at the intersection of climate, land, food and nature over the past fortnight.
This is an online version of Carbon Brief’s fortnightly Cropped email newsletter.
Subscribe for free here.
Key developments
Global drought and heat
DRY THEN WET: A recent heatwave and months of low rainfall has led to a prolonged drought for Uganda, resulting in at least 16 deaths from hunger and significant crop losses, reported BBC News. Bastille Post Global suggested that “a developing El Niño later this year could bring heavier rainfall to parts of the region, raising the risk of flooding in areas now struggling with drought”.
FUNDING FOOD: The UN Food and Agriculture Organization (FAO) and the World Food Programme (WFP) have appealed for $200m in funding to help African nations deal with the impact of El Niño, stated Deutsche Welle. This would target 22 high-risk countries with measures, including “cash transfers, climate-resilient seeds, livestock protection and flood control.” The Guardian explained how El Niño could still “cause a severe shock to global food prices lasting into 2028”.
FARMING FEARS: Extreme weather has devastated agriculture across the world. India saw its driest June in 12 years, reported BBC News, and France has had a “double-digit production” decline, according to Le Monde. The Financial Times reported that farmers in the UK are mitigating the impacts of extreme heat by eliminating “chemicals and intensive ploughing to improve soil quality so it retains water”.
EURO FIRES: Wildfires have spread across Europe, with Spain reporting at least 12 deaths so far, according to the Guardian, and France experiencing road closures, said Reuters. Wildfire Today reported that the most extreme conditions are “across France, Spain and northern Portugal, the Alpine arc extending into northern Italy, the south of the UK and south-east Ireland”. CNN explained how “the climate crisis is driving hotter, drier weather, which is setting the stage for fiercer fire seasons”.
Endangering species
REDEFINING HARM: The Trump administration “reversed decades of longstanding environmental law protecting endangered species…opening up sensitive habitats…to drilling, mining, farming and real estate development”, reported CNN. According to the story, the change “redefines what constitutes ‘harm’” to endangered species, which historically prohibited habitat modification or degradation. Agence France-Presse reported that US environmental groups sued the Trump government over the move, arguing that it had violated “common sense, biological science and federal law”.
OPEN SEASON: Reuters reported that the change “limits the reach of the 50-year-old Endangered Species Act” (ESA), which is a “key regulatory consideration” when granting permits for “oil and gas, mining, electric transmission and other operations on federal lands and water”. Legal scholars told the New York Times the US government “was acting without conducting scientific research into the impact” of the change, while the National Mining Association “applauded the announcement”.
News and views
- INTERNATIONAL WATERS: After a significant delay, the UK ratified the Biodiversity Beyond National Jurisdiction Agreement (BBNJ), also known as the High Seas Treaty. Oceanographic detailed how this will allow for “marine protected areas across international waters for the first time”, but also stressed that the “hard part” starts now.
- SCOPE-FREE: The world’s largest meat supplier JBS “scrapped a key climate goal” in its net-zero plan that accounts for its suppliers’ emissions, “which make up the vast bulk of the company’s environmental footprint”, reported the Financial Times. The company told the paper it was difficult to control these “indirect” emissions.
- DEEP TROUBLE: Pacific gray whales are facing a “catastrophic die-off” as sea-ice loss threatens their food sources, said the Guardian. Separately, conservationists warned that more than half of all molluscs that “cluster around underwater vents” could face extinction from deep-sea mining, reported Reuters.
- ETHANOL PUSHBACK: India’s new rules to promote 100% ethanol fuel and make ethanol-blended fuel mandatory at pumps “triggered a political row”, reported the Times of India. While the Indian government defended the push to automobile owners, a Hindu editorial and an Indian Express comment warned against incentivising fuels made from “water-intensive” sugarcane and rice.
- AMAZON ACTION: Deforestation in the Brazilian Amazon fell to its lowest level in a decade, but president Lula’s plans to “end illegal deforestation by 2030” could be hampered if he is not re-elected, reported Al Jazeera. Meanwhile, Colombia’s outgoing environment minister warned of greater environmental and climate risk under the incoming government, said the Associated Press.
- WAR WORRIES: The International Energy Agency (IEA) warned of the impact of the Iran war on Africa’s clean cooking efforts as disruption in the strait of Hormuz has stunted supplies and increased prices of liquefied petroleum gas (LPG), explained Climate Home News.
Spotlight
UK ‘discards’ Congo rainforest funding
Amid worldwide cuts to aid spending, Carbon Brief explores how the UK is backtracking on funding for the Congo basin – the world’s second-largest rainforest.
The UK has abandoned projects worth tens of millions of pounds that were meant to help protect Congo rainforests and support local people.
Together, these initiatives would have made up half of the £200m that the UK pledged to support forest conservation in the Congo basin.
When it hosted COP26 in Glasgow, the UK led a new initiative to end forest loss, which included a collective pledge of “at least” $1.5bn (£1.1bn) for Congo rainforest nations by 2025.
Development minister Jenny Chapman revealed last week that, as of 2024, the UK had only provided £39.8m towards this goal.
COP pledge
At COP26, the UK – led by then prime minister Boris Johnson – launched the “Glasgow leaders’ declaration”, with a goal to “halt and reverse forest loss” by 2030.
The UK also made various regional funding pledges, including £200m for the Congo basin, £350m for tropical forests in Indonesia and “up to £300m” for the Amazon.
All of these rainforests face major forest loss. The Congo basin is the planet’s largest forested carbon sink, but its six host nations are among the poorest in the world and face significant funding barriers.
This has global ramifications. An official UK assessment warned that “degradation or collapse” of the Amazon or Congo rainforests “threaten UK national security and prosperity”.
Forest cuts
Following successive aid cuts introduced by both Conservative and Labour governments – tracking a global trend – the UK’s Congo funding is under threat.
The Congo basin forest action programme (CBFA) was explicitly set up to provide “roughly half” of the UK’s £200m Congo pledge.
Now, after reporting delays, the UK has slashed the CBFA as part of the Labour government’s aid cuts. Its £90m budget has been “quietly reduced by 79% to £18.8m”, according to the Times.
This is not the only Congo project that has been dropped due to aid cuts. The Congo part of the biodiverse landscapes fund – worth at least £12.3m – has closed five years early.
Official documents reveal more Congo forest funding is at risk, including the UK’s two largest remaining projects in the region. One initiative, intended to “incubate forest-friendly enterprises” in DRC, faces “reduc[ed] budgets”.
Documents also show the difficulties operating in the Congo, including “complex political economies” and, in Gabon, a military coup – which “complicated matters”.
‘Breaking promises’
Damian Fleming, a senior forests director at WWF International told Carbon Brief:
“Tropical forest countries are making long-term policy and development choices in expectation that international partners will honour their commitments.”
In a parliamentary response, Chapman said that the UK had spent £39.8m towards its £200m Congo target, as of 2024.
Despite being described as the UK’s contribution to the £1.1bn-by-2025 global goal agreed at COP26, the £200m target has a deadline of 2029. Therefore, while the collective goal has been met, the UK’s contribution was relatively small.
Zac Goldsmith, a former Conservative minister who oversaw the forest targets at COP26, told Carbon Brief that, in his view, the UK has “discarded” its regional pledges:
“We have gone from being perhaps the leader on protecting nature internationally to breaking promises to countries around the world.”
The Labour government says it has met its overarching “climate finance” goals and still intends to “prioritise” the Congo rainforest.
However, civil society groups and MPs are concerned about the lack of “ring-fenced” forest funding in the UK’s new aid strategy.
Watch, read, listen
TOXIC TROUBLES: DeSmog unpacked a new report that said Northern Ireland is being turned into a “toxic” pig and poultry farming “sacrifice zone” to satiate the UK’s meat appetite.
NEED TO NOAA: Laid-off scientists from the US’s National Oceanic and Atmospheric Administration (NOAA) launched Climate.Us – an independent, public-backed version of the climate information website shut down by Trump last year.
DRY FRUIT: A Dialogue Earth long read looked at how climate change is impacting apricot harvests in the “stark, high-altitude desert” region of Ladakh, India.
READING ALOUD: A London Review of Books podcast discussed Robin Wall Kimmerer’s influential book “Braiding Sweetgrass”, weighing its compelling themes and where it veers into “scientific overreach”.
New science
- Climate change could cause Indigenous peoples in the Amazon to lose 28-34% of their plant species and 18-23% of their associated services | Nature
- Biodiversity in forests can act as a “buffer” against compound extreme weather events | Nature Communications
- Zero-deforestation commitments in Indonesia’s palm oil sector have had “no additional impacts” on reducing forest loss | Proceedings of the National Academy of Sciences
In the diary
- 7-15 July: High-level political forum on sustainable development | New York City
- 13-31 July: Meeting of the International Seabed Authority assembly and council | Kingston, Jamaica
- 16 July: International Energy Agency critical minerals outlook 2026, online
- 27 July-1 August: Scientific and technical subsidiary body meeting of the UN Convention on Biological Diversity | Nairobi, Kenya
This edition of Cropped was written by Jess Milligan, Josh Gabbatiss and Aruna Chandrasekhar. Cropped is edited by Dr Giuliana Viglione. This edition was edited by Daisy Dunne. Please send tips and feedback to cropped@carbonbrief.org.
The post Cropped 15 July 2026: Uganda starves | Trump opens endangered habitats | UK cuts rainforest aid appeared first on Carbon Brief.
Cropped 15 July 2026: Uganda starves | Trump opens endangered habitats | UK cuts rainforest aid
Climate Change
Campaigners oppose Dangote’s planned Kenya refinery over climate and ecological risks
Climate and environment campaigners have urged the Kenyan government to halt plans for a proposed 700,000-barrel-per-day oil refinery backed by Africa’s richest man, Aliko Dangote, warning the project threatens one of East Africa’s most ecologically sensitive coastlines.
The refinery, which is planned to be situated in Lamu County on Kenya’s northern coast, will be East Africa’s largest refining project and is expected to take up to three years to build. Once finished, it would supply refined petroleum products to Kenya, Uganda, Tanzania and Rwanda, among others, helping to reduce the region’s dependence on imported fuels.
Campaigners are questioning the viability of such a large refinery at a time when renewable energy and electric transportation are expanding rapidly.
Mohamed Adow, director of a Kenya-based climate and energy think-tank Power Shift Africa, said the decision to give Dangote the green light for the refinery is “an extraordinary act of environmental recklessness and economic short-sightedness”, arguing it would tie Kenya to “yesterday’s energy system” just as global demand for petroleum products faces increasing uncertainty.
-
Nigeria gives fossil gas a bigger role as “transition fuel” in climate plan
Officials say the country needs time and money to ramp up renewables, but critics say betting on gas is a risky strategy that could prolong the “oil curse” -
Gas flaring soars in Niger Delta post-Shell, afflicting communities
Since the multinational sold its assets in Nigeria’s oil hub, data analysis for Climate Home News shows flaring has risen, harming locals and the climate


Campaigners argue the refinery risks coming online just as transport – the largest market for petrol and diesel – is beginning to electrify across the continent.
Kenya launched a National Electric Mobility Policy earlier this year to speed up the uptake of electric vehicles (EVs) and reduce the country’s roughly $5 billion annual fuel import bill. Ethiopia has already banned imports of non-electric vehicles and now has more than 100,000 EVs on its roads, while Rwanda is expanding its electric mobility programme with plans to convert its fleet of around 100,000 motorcycles to electric.
Adow said the project risks billions of dollars in investment in infrastructure that could become obsolete as the world moves away from oil.
“Building a refinery today assumes decades of robust demand for fuels that much of the world is actively trying to phase out,” he said in a statement.
Ecological concerns
Lamu – the proposed site for the project – is home to the UNESCO World Heritage-listed Lamu Old Town and an archipelago containing extensive mangrove forests, coral reefs and seagrass beds that support fisheries, tourism and coastal livelihoods.
Locating the refinery in Lamu would “place one of Africa’s largest fossil fuel developments in one of the continent’s most ecologically sensitive and culturally significant coastal regions,” Power Shift Africa said.
Major emitting countries knew of climate risks decades earlier than claimed
Sherelee Odayar, oil and gas campaigner at Greenpeace Africa, warned that a refinery of this scale could increase the risk of habitat destruction, marine pollution, oil spills and air pollution in one of East Africa’s most fragile coastal ecosystems.
She said the risks stem not only from the refinery itself – including storage tanks, pipelines and fuel handling facilities – but also from the large volumes of crude oil that would need to be shipped into Lamu and refined products exported by sea. Increased tanker traffic and fuel transfers, she said, would raise the likelihood of accidents in ecologically sensitive coastal waters.
Odayar added that Lamu’s low-lying, flood-prone coastline could compound those risks by damaging infrastructure and carrying contaminants from storage facilities into nearby fishing grounds and marine ecosystems.
“Lamu’s mangroves, coral reefs and seagrass beds are not expendable; they support fisheries, livelihoods and coastal protection,” Odayar added.
She said Kenyan authorities should suspend any approvals until an independent environmental and social impact assessment is completed, with genuine public participation and transparent scrutiny of the long-term economic, health and ecological risks.
“Any review must assess cumulative impacts on Lamu’s mangroves, coral reefs, seagrass beds and fishing livelihoods, alongside the wider economic risk of locking Kenya into costly fossil fuel infrastructure as the global energy transition accelerates”.
Dangote Group declined to answer questions from Climate Home News when contacted by phone.
Technological change threaten project’s future
The Kenya refinery would replicate Dangote’s 650,000-barrel-per-day refinery in Lagos, currently Africa’s largest, which has plans to more than double capacity to 1.4 million barrels per day by 2028.
Adow of Power Shift Africa said projects like this represent “a breathtaking failure to recognise where the global economy is heading”, pointing out that the East African refinery risks arriving when Africa is experiencing an unprecedented clean energy boom.
Referencing Africa’s solar boom, global electric vehicles uptake and the International Energy Agency’s projection that global oil demand is set to enter a decline later this decade, the think-tank founder said African governments risk anchoring the continent’s future to an industry facing mounting economic uncertainty.
Loss and damage fund delays first project approvals as needs dwarf resources
The organisation said the project faces a bigger threat aside from environmental opposition and that is technological change. “The danger is not simply that the refinery will pollute, it is that it will become obsolete long before it has paid for itself,” he added.
Kenyan President William Ruto said the project will create about 60,000 jobs for Kenyans and supply refined fuel to eight East and Central African countries.
GreenPeace Africa’s Odayar said the promise of ‘thousands of jobs’ cannot be used to hide the true cost of the investment which is that large fossil fuel projects often create temporary jobs while undermining existing livelihoods in fishing, tourism and small-scale local economies.
“The enormous capital required for a project of this scale could instead help accelerate Kenya’s renewable energy future through solar, wind, geothermal, storage and better energy access,” she added.
The post Campaigners oppose Dangote’s planned Kenya refinery over climate and ecological risks appeared first on Climate Home News.
Campaigners oppose Dangote’s planned Kenya refinery over climate and ecological risks


-
Climate Change11 months ago
Guest post: Why China is still building new coal – and when it might stop
-
Greenhouse Gases11 months ago
Guest post: Why China is still building new coal – and when it might stop
-

 Greenhouse Gases2 years ago
嘉宾来稿:满足中国增长的用电需求 光伏加储能“比新建煤电更实惠”
-

 Climate Change2 years ago
嘉宾来稿:满足中国增长的用电需求 光伏加储能“比新建煤电更实惠”
-
Climate Change2 years ago
Bill Discounting Climate Change in Florida’s Energy Policy Awaits DeSantis’ Approval
-

 Renewable Energy9 months ago
Sending Progressive Philanthropist George Soros to Prison?
-

 Carbon Footprint2 years ago
US SEC’s Climate Disclosure Rules Spur Renewed Interest in Carbon Credits
-
Greenhouse Gases1 year ago
嘉宾来稿:探究火山喷发如何影响气候预测