

Tariffs can encourage companies to invest in domestic production and create jobs. At the same time, they can also spark trade wars, leading to job losses in affected industries. Their economic impact is certainly complicated. At present, the U.S. is in a major tariff conflict with Canada, Mexico, and China after President Trump raised tariffs significantly.
He imposed a 25% duty on imports from Mexico and Canada and doubled tariffs on Chinese goods to 20%. This led to new trade disputes with important partners. Industry experts say these tariffs could affect $2.2 trillion in annual trade, impacting many industries.
But Trump firmly believes these tariffs aim to reduce the trade deficit. By making imported goods costlier, they are pushing Americans to buy local products.
-
As per nbcnews, in 2024, Mexico, China, and Canada account for 42% of U.S. imports, making them key players in any trade conflict.

How Canada, China, and Mexico Fired Back
Canada reacted quickly. Prime Minister Justin Trudeau announced 25% tariffs on $20.7 billion worth of U.S. goods. He plans to expand these tariffs if the current ones remain. This mainly affects energy and minerals.
Similarly, China responded with 15% tariffs on some U.S. farm products like cotton, wheat, corn, and chicken. They added a 10% tariff on other goods, including dairy, fruits, vegetables, pork, beef, and soybeans. These tariffs will start on March 10. As per credible news sources, China’s commerce ministry also limited exports to 15 U.S. companies and added 10 U.S. firms to its “unreliable entity list.”
These trade barriers follow a pattern from earlier administrations. Last year, the White House decided to raise tariffs on Chinese semiconductors to 50%, while duties on Chinese electric vehicles quadrupled to over 100%. A new set of 25% tariffs on aluminum and steel will take effect soon, escalating tensions further.
Mexico’s President Claudia Sheinbaum stated the country has backup plans to handle U.S. tariffs.

U.S. Dependence on Imported Critical Minerals
A report from the Center for Strategic and International Studies highlights the U.S.’s reliance on imports for critical minerals. The U.S. relies entirely on imports for 12 of the 50 identified critical minerals and for over 50% of another 29.
Consequently, tariffs on Canada, Mexico, and China could raise costs for the U.S. These nations supplied 41% of U.S. metal and mineral imports in 2023. China leads the global production of 29 critical minerals and controls processing for rare earths, graphite, lithium, cobalt, and copper and is a major supplier for the U.S.

Doug Ford Warns of Nickel Cutoff Over U.S. Tariffs
Ontario Premier Doug Ford ripped off Trump’s exorbitant tariff rates on Canada. He threatened to halt nickel and electricity exports to the U.S. in response to the 25% tariffs on Canadian goods set to take effect tomorrow.
In an interview with NBC News NOW on Monday, Ford called the tariffs an “absolute disaster” for both nations, warning they would create “massive problems” for residents on both sides of the border.
Ford said,
“We will respond strongly and we don’t want to. “On the critical minerals I will stop shipments going into the U.S. for nickel. I will shut down manufacturing because 50 per cent of the nickel you use is coming from Ontario.”
He further opined,
”You need our uranium, you need our potash, you need our high-grade nickel. I will stockpile our high-grade nickel, that 50 percent of your military and manufacture needs. Your aluminum, your steel, your lumber. It will be an absolute disaster and this is all due to one person. That is President Trump.”
- READ MORE: Trump’s Tactic to Make America Great Again: Expanding Domestic Oil, Gas, and Critical Minerals
U.S. Aluminum Imports and Tariffs: Impact on Costs and Supply Chains
Domestic production of aluminum is just one third of its needs. According to Statista, the United States imported about 4.8 million metric tons of aluminum for consumption in 2024.
Mexico and Canada supply around 90% of U.S. aluminum scrap imports. The U.S. heavily relies on aluminum and steel imports, with Canada providing 58% of aluminum and 23% of steel imports.
Meanwhile, the apparent consumption of aluminum totaled about 4.3 million metric tons. Canada is a top aluminum supplier to the U.S., sending most of its primary aluminum for use in American manufacturing.
Imports of aluminum for consumption in the United States from 2010 to 2024 (in 1,000 metric tons)

Disrupting these supply chains will raise costs for industries such as automotive manufacturing. In this industry, parts often cross borders several times before the final assembly.
Tariff History Repeats Itself
The U.S. aluminum sector has faced trade measures before. In 2018, then-President Donald Trump imposed a 10% tariff on imported aluminum and 25% on steel to boost domestic production. These tariffs later extended to the EU, Canada, and Mexico.
In August 2024, under President Joe Biden, aluminum tariffs rose to 25%, increasing the U.S. Midwest premium by over 30%. Trump’s potential re-election could lead to further tariff hikes, creating market uncertainty.
Increased Aluminum Prices
The U.S. Midwest premium, a key indicator of aluminum tariff risk, has risen since Trump’s election win. S&P Global revealed the current price (as of February 25, 2024) for the US Aluminum P1020 Midwest Transaction Premium is 41.75 cents per pound.
Midwest Transaction Premium (MWP) Price History
The U.S. and Canada both want to secure critical mineral supply chains, even with trade tensions. This is because collaborating in mineral exploration, processing, and production boosts long-term stability and economic security.
However, building new domestic processing facilities and securing alternative mineral sources will take years. Thus, short-term reliance on Canadian and Mexican metals is unavoidable.
Winners and Losers: The Effects of New Tariffs on U.S. Industries
The latest tariffs will have mixed effects across industries. Some domestic producers will benefit from less foreign competition, while others will face rising production costs. Goldman Sachs has recently rolled out an evaluation report that highlights the potential winners and losers of Trump tariffs.
Winners: Industries producing aluminum, steel, and oil and gas extraction will likely benefit the most. Higher tariffs on imports in these sectors will protect domestic producers. As these industries compete with imports, new tariffs will make foreign goods pricier, boosting demand for U.S.-made products.

Losers: The biggest losers will be secondary steel and aluminum producers and petroleum product manufacturers. These sectors rely heavily on imported raw materials. Higher tariffs on steel, aluminum, and oil will significantly raise their production costs. Midstream manufacturers of products like auto parts, beverage cans, and window frames will also feel the pressure.

Tariffs on Canadian and Chinese aluminum could disrupt global supply chains, raising costs for U.S. manufacturers. Supply shortages may arise as producers redirect exports to other markets. The long-term fix is to boost North American supply chains. We need to invest in local processing. Also, the U.S. and Canada must work together for steady access to key materials.
Can the U.S. Really Be Self-Reliant with Trump’s Tariffs?
Trade tensions are shaking up industries and slowing investments. Tariffs on key imports like steel, semiconductors, oil, gas, and medicine could hurt U.S. businesses more than those on Chinese goods.
Many American companies rely on these imports to stay competitive. If tariffs keep changing, businesses may hold back on investing due to rising costs and supply issues.
Industry experts speculate higher tariffs on critical imports could do more damage than those targeting China. The last trade war (2018-2019) showed how foreign retaliation can hit U.S. exports hard. More significantly the U.S. National security could also at risk—China has already cut off supplies of key minerals like gallium and germanium, which are essential for defense.
However, a possible solution lies in stronger U.S.-Canada ties with favourable tariffs. A stable North American supply chain for critical minerals can reduce reliance on foreign sources and protect both the economy and national security.
- FURTHER READING: Trump’s Tariffs and Climate Rollbacks: How 2025 is Shaking Copper Markets and Clean Energy Goals
The post Trump’s Tariffs on Canada, China, and Mexico: A Risky Bet for U.S. Critical Minerals and Aluminum? appeared first on Carbon Credits.
Carbon Footprint
Climate Impact Partners Unveils High-Quality Carbon Credits from Sabah Rainforest in Malaysia

The voluntary carbon market is changing. Buyers are no longer focused only on large volumes of cheap credits. Instead, they want projects with strong science, long-term monitoring, and clear proof that carbon has truly been removed from the atmosphere. That shift is drawing more attention to high-integrity, nature-based projects.
One project now gaining that spotlight is the Sabah INFAPRO rainforest rehabilitation project in Malaysia. Climate Impact Partners announced that the project is now issuing verified carbon removal credits, opening access to one of the highest-quality nature-based removals currently available in the global market.
Restoring One of the World’s Richest Rainforest Ecosystems
The project is located in Sabah, Malaysia, on the island of Borneo. This region is home to tropical dipterocarp rainforest, one of the richest forest ecosystems on Earth. These forests store huge amounts of carbon and support extraordinary biodiversity. Some dipterocarp trees can grow up to 70 meters tall, creating habitat for orangutans, pygmy elephants, gibbons, sun bears, and the critically endangered Sumatran rhino.
However, the forest within the INFAPRO project area was not intact. In the 1980s, selective logging removed many of the most valuable tree species, especially large dipterocarps. That caused serious ecological damage. Once the key mother trees were gone, natural regeneration became much harder. Young seedlings also had to compete with dense vines and shrubs, which slowed the forest’s recovery.
To repair that damage, the INFAPRO project was launched in the Ulu-Segama forestry management unit in eastern Sabah.
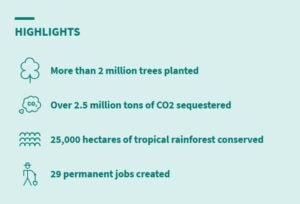
- The project has restored more than 25,000 hectares of logged-over rainforest.
- It was developed by Face the Future in cooperation with Yayasan Sabah, while Climate Impact Partners has supported the project and helped bring its credits to market.
Why Sabah’s Carbon Removals are Attracting Attention
What makes Sabah INFAPRO different is not only the size of the restoration effort. It is also the way the project measured carbon gains.
Many forest carbon projects issue credits in annual vintages based on year-by-year growth estimates. Sabah INFAPRO followed a different path. It used a landscape-scale monitoring system and waited until the forest moved through its strongest natural growth period before issuing removal credits.
- This approach gives the credits more weight. Rather than relying mainly on short-term annual estimates, the project measured carbon sequestration over a longer period. That helps show that the forest delivered real, sustained, and measurable carbon removal.
The scientific backing is also unusually strong. Since 2007, the project has maintained nearly 400 permanent monitoring plots. These plots have allowed researchers, independent auditors, and technical specialists to observe the full growth cycle of dipterocarp forest recovery. The result is a large body of field data that supports carbon calculations and strengthens confidence in the credits.
In simple terms, buyers are not just being asked to trust a model. They are being shown years of direct forest monitoring across the project landscape.
Strong Ratings Support Market Confidence
Independent assessment has also lifted the project’s profile. BeZero awarded Sabah INFAPRO an A.pre overall rating and an AA score for permanence. That places the project among the highest-rated Improved Forest Management, or IFM, projects in the world.
The rating reflects several important strengths. First, the project has very low exposure to reversal risk. Second, it has a long and stable operating history. Third, its measured carbon gains align well with peer-reviewed ecological research and independent analysis.
These points matter in today’s market. Buyers have become more cautious after years of debate over the quality of some forest carbon credits. As a result, they now look more closely at durability, transparency, and third-party validation. Sabah INFAPRO’s rating helps answer those concerns and makes the project more attractive to companies looking for credible carbon removal.
The project is also registered with Verra’s Verified Carbon Standard under the name INFAPRO Rehabilitation of Logged-over Dipterocarp Forest in Sabah, Malaysia. That adds another level of market recognition and verification.
A Wider Model for Rainforest Recovery
Sabah INFAPRO also shows why high-quality nature-based projects are about more than carbon alone. The restoration effort supports broader ecological recovery in one of the world’s most important rainforest regions.
Climate Impact Partners said it has worked with project partners to restore degraded areas, run local training programs, carry out monthly forest patrols, and distribute seedlings to support rainforest recovery beyond the project boundary. These efforts help strengthen the wider landscape and expand the project’s environmental impact.
That broader value is becoming more important for buyers. Companies increasingly want projects that support biodiversity, ecosystem health, and local engagement, along with carbon removal. Sabah INFAPRO offers that mix, making it a stronger fit for the market’s shift toward higher-integrity credits.
The post Climate Impact Partners Unveils High-Quality Carbon Credits from Sabah Rainforest in Malaysia appeared first on Carbon Credits.
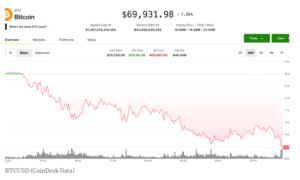
Bitcoin’s recent drop below $70,000 reflects more than short-term market pressure. It signals a deeper shift. The world’s largest cryptocurrency is becoming increasingly tied to global energy markets.
For years, Bitcoin has moved mainly on investor sentiment, adoption trends, and regulation. Today, another force is shaping its direction: the cost of energy.
As oil prices rise and electricity markets tighten, Bitcoin is starting to behave less like a tech asset and more like an energy-dependent system. This shift is changing how investors, analysts, and policymakers understand crypto.
A Global Power Consumer: Inside Bitcoin’s Energy Use
Bitcoin depends on mining, a process that uses powerful computers to verify transactions. These machines run continuously and consume large amounts of electricity.
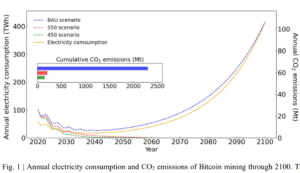
Data from the U.S. Energy Information Administration shows Bitcoin mining used between 67 and 240 terawatt-hours (TWh) of electricity in 2023, with a midpoint estimate of about 120 TWh.

Other estimates place consumption closer to 170 TWh per year in 2025. This accounts for roughly 0.5% of global electricity demand. Recently, as of February 2026, estimates see Bitcoin’s energy use reaching over 200 TWh per year.
That level of energy use is significant. Global electricity demand reached about 27,400 TWh in 2023. Bitcoin’s share may seem small, but it is comparable to the power use of mid-sized countries.
The network also requires steady power. Estimates suggest it draws around 10 gigawatts continuously, similar to several large power plants operating at full capacity. This constant demand makes energy costs central to Bitcoin’s economics.
When Oil Rises, Bitcoin Falls
Bitcoin mining is highly sensitive to electricity prices. Energy is the highest operating cost for miners. When power becomes more expensive, profit margins shrink.
Recent market movements show this link clearly. As oil prices rise and inflation concerns persist, energy costs have increased. At the same time, Bitcoin prices have weakened, falling below the $70,000 level.
This is not a coincidence. Studies show a direct relationship between Bitcoin prices, mining activity, and electricity use. When Bitcoin prices rise, more miners join the network, increasing energy demand. When energy costs rise, less efficient miners may shut down, reducing activity and adding selling pressure.
This creates a feedback loop between crypto and energy markets. Bitcoin is no longer driven only by demand and speculation. It is now influenced by the same forces that affect oil, gas, and power prices.
Cleaner Energy Use Is Growing, but Fossil Fuels Still Matter
Bitcoin’s environmental impact depends on its energy mix. This mix is improving, but it remains uneven.
A 2025 study from the Cambridge Centre for Alternative Finance found that 52.4% of Bitcoin mining now uses sustainable energy. This includes both renewable sources (42.6%) and nuclear power (9.8%). The share has risen significantly from about 37.6% in 2022.
Despite this progress, fossil fuels still account for a large portion of mining energy. Natural gas alone makes up about 38.2%, while coal continues to contribute a smaller share.
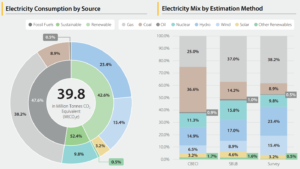
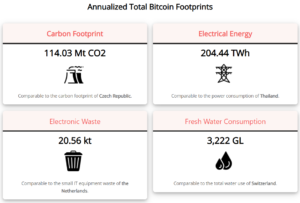
This reliance on fossil fuels keeps emissions high. Current estimates suggest Bitcoin produces more than 114 million tons of carbon dioxide each year. That puts it in line with emissions from some industrial sectors.
The shift toward cleaner energy is real, but it is not complete. The pace of change will play a key role in how Bitcoin fits into global climate goals.
Bitcoin’s Climate Debate Intensifies
Bitcoin’s growing energy demand has placed it at the center of ESG discussions. Its impact is often measured through three key areas:
- Total electricity use, which rivals that of entire countries.
- Carbon emissions are estimated at over 100 million tons of CO₂ annually.
- Energy intensity, with a single transaction using large amounts of power.
At the same time, the industry is evolving. Mining companies are adopting more efficient hardware and exploring new energy sources. Some operations use excess renewable power or capture waste energy, such as flare gas from oil fields.
These efforts show progress, but they do not fully address the concerns. The gap between Bitcoin’s energy use and its environmental impact remains a key issue for investors and regulators.
- MUST READ: Bitcoin Price Hits All-Time High Above $126K: ETFs, Market Drivers, and the Future of Digital Gold
Bitcoin Is Becoming Part of the Energy System
Bitcoin mining is now closely integrated with the broader energy system. Operators often choose locations based on access to cheap or excess electricity. This includes areas with strong renewable generation or underused energy resources.
This integration creates both opportunities and challenges. On one hand, mining can support energy systems by using power that might otherwise go to waste. It can also provide flexible demand that helps stabilize grids.
On the other hand, it can increase pressure on local electricity supplies and extend the use of fossil fuels if cleaner options are not available.
In the United States, Bitcoin mining could account for up to 2.3% of total electricity demand in certain scenarios. This highlights how quickly the sector is scaling and how closely it is tied to national energy systems.
Energy Markets Are Now Key to Bitcoin’s Future
Looking ahead, the connection between Bitcoin and energy is expected to grow stronger. The network’s computing power, or hash rate, continues to reach new highs, which typically leads to higher energy use.
Electricity will remain the main cost for miners. This means Bitcoin will continue to respond to changes in energy prices and supply conditions. At the same time, governments are starting to pay closer attention to crypto’s environmental impact, which could shape future regulations.
Some forecasts suggest Bitcoin’s energy use could rise sharply if adoption increases, potentially reaching up to 400 TWh in extreme scenarios. However, cleaner energy systems could reduce the carbon impact over time.
Bitcoin is no longer just a financial asset. It is also a large-scale energy consumer and a growing part of the global power system.
As a result, understanding Bitcoin now requires a broader view. Energy prices, electricity markets, and carbon trends are becoming just as important as market demand and investor sentiment.
The message is clear. As energy markets move, Bitcoin is likely to move with them.
The post Bitcoin Falls as Energy Prices Rise: Why Crypto Is Now an Energy Market Story appeared first on Carbon Credits.

The post LEGO’s Virginia Factory Goes Big on Solar as Net-Zero Push Speeds Up appeared first on Carbon Credits.


-
Greenhouse Gases7 months ago
Guest post: Why China is still building new coal – and when it might stop
-
Climate Change7 months ago
Guest post: Why China is still building new coal – and when it might stop
-

 Greenhouse Gases2 years ago
嘉宾来稿:满足中国增长的用电需求 光伏加储能“比新建煤电更实惠”
-
Climate Change2 years ago
Bill Discounting Climate Change in Florida’s Energy Policy Awaits DeSantis’ Approval
-

 Climate Change2 years ago
嘉宾来稿:满足中国增长的用电需求 光伏加储能“比新建煤电更实惠”
-
Climate Change Videos2 years ago
The toxic gas flares fuelling Nigeria’s climate change – BBC News
-

 Carbon Footprint2 years ago
US SEC’s Climate Disclosure Rules Spur Renewed Interest in Carbon Credits
-

 Renewable Energy5 months ago
Sending Progressive Philanthropist George Soros to Prison?