Connect with us

Published

on

Tesla (TSLA) Stock Rises Over $450, Hits Record Market Value of $1.5T as Q3 Delivery Test Looms

Tesla has once again made headlines after its stock climbed above $450 per share, lifting its market value past $1.5 trillion. This milestone places Tesla among the most valuable companies in the world, alongside tech giants.

The market jump reflects strong investor belief in Tesla’s role as a leader in electric vehicles (EVs) and clean energy. It also shows rising expectations ahead of the company’s upcoming third-quarter delivery results.

While the stock’s performance has impressed many, Tesla now faces new challenges that could affect future demand. One of those challenges has already started to take shape in the U.S. market: leasing costs.

Leasing Gets Pricier as Tax Credit Expires

At the beginning of October, Tesla raised lease prices across most of its American lineup. This change came after a $7,500 federal EV tax credit for leased vehicles expired. The EV giant had previously used the credit to lower monthly lease payments for customers. With the incentive gone, leasing now costs more.

For example, the Model Y saw its monthly lease rate climb by about $50 to $70. The Model 3 also rose by around $80 on some versions. Purchase prices, however, did not change.

This means that buying a Tesla outright still costs the same, but leasing has become less affordable. Leasing has been a popular way for many first-time EV owners to enter the market, so higher rates may slow demand in that segment.

Still, Tesla benefits from the adjustment because it helps protect profit margins at a time when incentives are shifting. This change also ties closely to Tesla’s delivery expectations for the third quarter.

All Eyes on Q3: Can Tesla Deliver Half a Million Cars?

Tesla will soon report how many cars it delivered in the third quarter. Analysts are watching closely, and estimates have been rising. Projections range from 442,000 to more than 500,000 vehicles.

Some firms expect Tesla to deliver around 480,000 units, which would be stronger than expected earlier in the year. Others even believe Tesla could pass the half-million mark, thanks to a last-minute rush of buyers who wanted to take advantage of cheaper leasing before the credit expired.

This boost in sales, however, may create uneven demand. If customers rushed to buy in Q3, the following quarters might see weaker numbers. That possibility has some analysts cautious, even as they raise their short-term forecasts.

Regardless of the exact total, the delivery report will act as a test of Tesla’s ability to keep growing at scale while facing new market pressures.

Investors Fuel Tesla’s $1.5 Trillion Market Cap Surge

The recent stock surge to $459 highlights how much investors believe Tesla can continue to deliver. Moving into the $1.5 trillion market cap club has made Tesla one of the most closely watched companies worldwide.
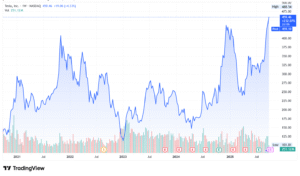
Tesla tsla stock price

The optimism is clear: if Tesla reports strong Q3 deliveries, the stock could climb even higher. But expectations are also very high. Any sign of weakness, either in deliveries or future guidance, could push the stock lower.

This tension between confidence and caution explains why Tesla’s stock is so volatile. Every update on sales, pricing, or government policy has the potential to shift the company’s market value by billions in a single day.

Moreover, Tesla’s latest surge is fueled by a proposed $1 trillion compensation plan for Elon Musk, linking his pay to bold targets. These include lifting Tesla’s value from $1 trillion to $8.5 trillion by 2035.

The company is betting big on AI, with robotaxi services using Model Y cars set for Austin in mid-2025. This is followed by Cybercab production in 2026. Tesla also plans to launch Full Self-Driving software version 14 and deploy thousands of Optimus humanoid robots in factories by year-end.

Still, critics caution that Tesla’s high valuation—around 180 times forward earnings—rests heavily on unproven AI ambitions.

Amid all these, one thing remains: the EV leader’s sustainability and emission reduction drive.

Tesla Balances Emissions Cuts with Supply Chain Challenges

Tesla emphasizes reducing emissions across its operations and product life cycle. In 2024, the company reported a total carbon footprint of about 56 million metric tons CO₂e, combining its own operations and supply chain emissions.
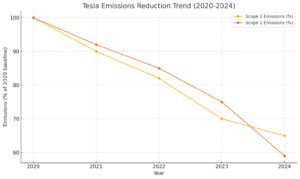
tesla emissions reduction
Source: The Sustainable Innovation

Tesla also notes that in 2023, its customers avoided over 20 million metric tons of CO₂e by driving electric vehicles instead of fossil-fuel cars.

Regulatory credits are another pillar. In 2024, Tesla generated $2.76 billion from selling regulatory carbon credits. This is a 54% increase compared to $1.79 billion in 2023. This revenue comes from providing greenhouse gas (GHG) credits to other automakers that need to meet emissions regulations in the U.S., Europe, and China.

Tesla’s carbon credit sales in 2024 accounted for nearly 39% of its net income for the year, making it a dominant player in the emissions credit market.
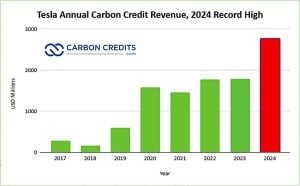
Tesla annual carbon credit revenue in 2024

To support its goals, Tesla operates its Supercharger network with 100% renewable energy, and its Berlin Gigafactory has run on fully renewable power for the past two years. However, the company still faces its biggest challenge in Scope 3 emissions—those tied to its supply chain and the use of its vehicles.

Opportunities and Obstacles on Tesla’s Road Ahead

Tesla’s path forward is full of both opportunities and risks. The company continues to expand globally, invest in new technologies, and explore new business areas such as energy storage and software. At the same time, it must handle challenges like shifting policies, rising competition, and customer affordability.

On the opportunity side, strong U.S. demand could carry Tesla through short-term changes in subsidies. Growth in markets like China and Europe also offers new revenue streams. Tesla’s work in batteries, charging infrastructure, and AI features may help it build a broader ecosystem beyond cars.

But risks are just as clear. Without the leasing credit, some U.S. customers may wait longer or choose competitors. Supply chain costs could rise, cutting into margins. And with global EV competition heating up, especially from Chinese automakers, Tesla’s share of the market may come under pressure. This has been the case in its European sales. 
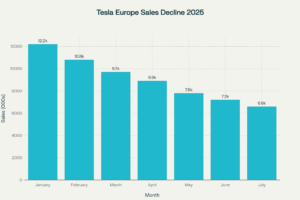
tesla EV sales
Source: Tesla Europe Sales, Jan-July 2025 (Data: European Automobile Manufacturers’ Association; sources: PBS, Yahoo Finance, JATO Dynamics).

Managing these factors will decide whether Tesla’s $1.5 trillion valuation remains justified. Investors are already reacting based on how Tesla balances growth with these headwinds.

Tesla’s Future: Growth Under Pressure

Tesla enters the last part of the year in a strong but demanding position. The company has reached a market value that few automakers in history could have imagined. Yet with that success comes more pressure to deliver not just cars, but also consistent growth and profits.

The rise in leasing costs shows how quickly policies can change the market. The Q3 delivery report will test whether Tesla can handle those changes while keeping demand strong. If results meet or beat forecasts, Tesla may strengthen its image as the EV leader. If results fall short, the stock could face new doubts.

Either way, Tesla’s next moves will be closely watched not only by investors but also by the wider auto industry. As the world transitions to electric transport, Tesla’s performance will continue to serve as a signal of how fast and how strong that shift can be.

The post Tesla (TSLA) Stock Rises Over $450, Hits Record $1.5T Market Cap as Q3 Delivery Test Looms appeared first on Carbon Credits.

Continue Reading

Carbon Footprint

Climate-Linked Supply Chain Risk Is Already in Your P&L

Published

on

The earnings calls that quietly reframed climate from sustainability question to operating risk.

Three earnings calls in the last 18 months tell the story without any help from a press release.

Hershey, May 2024: cocoa price exposure compresses margin, and the company attributes part of the cost shock to West African weather. Olam, July 2024: coffee climate exposure quantified in the annual report. JBS, January 2025: supply chain climate disclosures expanded materially in response to investor pressure and regulatory expectation. None of these companies issued the announcement as climate news. They issued it as financial news. The climate-linked supply chain risk did not arrive with a sustainability framing; it arrived as a P&L line.

You are probably reading this article because you suspect the same thing is happening to your business. This piece walks through what is showing up on which earnings calls, how procurement and finance leaders are quantifying the exposure, and what serious corporates are doing about it before the regulator asks.

Where climate risk has already appeared in earnings

The pattern is consistent across resource-intensive sectors. A weather event compresses supply, the price spikes, the cost flows through the income statement, and the analyst on the call asks whether the event is anomalous or structural. Increasingly, the honest answer is the second one.

Cocoa is the cleanest example. The 2023 to 2024 West African harvest fell sharply on the back of erratic rainfall and disease. Cocoa futures more than tripled. Companies with concentrated West African sourcing absorbed the cost; companies with diversified sourcing absorbed less. The exposure was not climate as ESG topic. It was climate as cost of goods.

Coffee follows the same pattern. Brazilian and Vietnamese harvests have moved on weather more sharply across the last several seasons. Roasters with long-tenor supplier relationships and origin diversification have managed the volatility; roasters with spot-market exposure have not. Wheat, sugar, palm oil, beef: the same dynamic in different commodities, a pattern the IPCC AR6 Working Group II report projects will intensify across agricultural systems through mid-century.

What this means: climate risk is no longer a footnote in the 10-K. It is a line item the CFO has to explain on the call.

The three commodity exposures that hit margin first

For most companies with material Scope 3 exposure, three exposures dominate the near-term P&L risk.

  • Concentrated single-origin sourcing in a climate-vulnerable region. If your tier-one supply for any material commodity sits in one geography, you have a concentration risk that climate amplifies. Diversification across origins is the obvious hedge, but it takes years to build and requires relationships you cannot acquire by tender.
  • Supplier financial fragility under climate stress. Smallholder farmers, who supply a large share of the global cocoa, coffee, and palm oil market, do not carry the balance sheets to absorb yield shocks. When yields collapse, they exit. When they exit, your supply base shrinks, and the surviving suppliers raise prices. The risk is structural, not cyclical.
  • Logistics and storage exposure to extreme weather. Hurricane disruptions to Gulf shipping, drought-driven Panama Canal restrictions, flooding in European inland waterways: each of these has moved input costs in the last three years, a pattern documented in Munich Re’s natural catastrophe data. The exposure shows up as a one-quarter event in the financial press but accumulates over time on the cost line.

TCFD and ISSB disclosure changes

The disclosure architecture has now caught up with the risk. The Task Force on Climate-related Financial Disclosures, whose recommendations are now embedded in the ISSB’s IFRS S2 climate standard, requires companies to disclose climate-related risks across physical and transition categories, with quantification where possible.

For physical risk specifically (the climate-linked supply chain risk you are reading about), the disclosure must address both acute exposures (extreme weather events) and chronic exposures (gradual changes in temperature, precipitation, and growing seasons). The disclosure must address the time horizon over which the risk is material, the parts of the value chain exposed, and the financial impact under different scenarios.

The CSRD imposes similar requirements under European law, with double materiality (both financial and impact materiality) embedded in the assessment. The practical effect: your auditors and your investor relations team now need a defensible answer to the climate-linked supply chain risk question, and the answer needs to be quantified.

What procurement and finance can do now

Three actions matter near-term.

Map your exposure. Most companies do not have a clear view of which tier-one and tier-two suppliers sit in which climate-vulnerable geographies. Without the map, you cannot quantify the risk, and without the quantification, you cannot disclose it credibly. The map is the foundation, and World Resources Institute climate risk research provides useful public tooling to start.

Diversify and deepen, in that order. Diversification across origins reduces concentration risk, but the deeper move is to invest in the resilience of the suppliers you already have. Regenerative practices, agroforestry, soil health interventions: these reduce yield volatility under climate stress and protect your input cost trajectory.

Embed the climate spend inside procurement, not outside it. Treating climate risk as a sustainability cost line subordinates it to the ESG budget. Treating it as a procurement and resilience investment puts it in the budget that matters, which is the cost-of-goods budget that the CFO defends quarterly.

Nature-based supply chain investments are the asset class designed for exactly this purpose. They sit inside the value chain, they reduce climate-linked supply risk, they generate verifiable Scope 3 reductions, and they produce the documentation an auditor and a regulator can both test.

If you are quantifying climate-linked supply chain risk in advance of the next earnings cycle or the next disclosure period, the carbon and sustainability experts at Carbon Credit Capital can help you map your exposure and structure a Dual-Value Model response that addresses reduction, resilience, and disclosure-readiness in a single program. Schedule a consultation.

Continue Reading

Carbon Footprint

Where should an SME start with a carbon action plan?

Published

on

More and more small and medium-sized businesses are hearing the same question from their larger customers: What is your carbon footprint? That question now travels down entire supply chains, and it arrives next to tender requirements, certification criteria, and rising customer expectations.

Continue Reading

Carbon Footprint

Insetting vs Offsetting: Which Actually Counts Toward Your Scope 3 Targets

Published

on

The accounting differences that decide whether your nature investment shows up in inventory, in BVCM, or nowhere at all.

The question reaches a procurement team about three weeks before the next sustainability committee meeting. Someone has read about insetting. Someone else has just signed off on an offset purchase. The CSO wants to know if the two are interchangeable. The answer is no, and the GHG Protocol Land Sector and Removals Standard is the reason why.

This article walks through what each term means at audit-grade specificity, what the standards actually say about how each gets counted, and how to decide which tool fits which target. The insetting vs offsetting question is one of the most-searched in corporate climate strategy, and one of the most poorly answered. By the end of this piece, you should be able to brief a committee on the difference without notes.

The two definitions, in plain English

Offsetting means buying carbon credits generated outside your value chain and retiring them against your residual emissions. The reduction happens somewhere else, financed by you, and the credit is the receipt.

Insetting means investing in emission reductions or removals inside your own value chain, typically with suppliers, where the reduction is directly linked to the products and services you buy. The reduction happens inside the boundary of your Scope 3 inventory, and the accounting treatment is fundamentally different.

The shorthand from the University of Oxford’s Nature-based Insetting Initiative is useful: insetting is what you do with the supply chain you have; offsetting is what you do with the supply chain you do not have.

What the GHG Protocol Land Sector Standard actually says

The GHG Protocol Land Sector and Removals Standard, finalised in 2024 after a multi-year pilot, sets the rules for how land-based emission reductions and removals enter corporate inventories. The Standard distinguishes between inventory accounting (Scope 1, 2, and 3) and project or intervention accounting (a separate methodology for crediting).

For insetting, the practical implication is that supplier-level interventions, when properly measured and attributed, can reduce your Scope 3 category 1 (purchased goods and services) emissions in your inventory. The reduction is not a credit retired against the inventory; it is a lower inventory number, period.

For offsetting, the credit is retired separately. It can be reported as a contribution toward a net-zero claim under the SBTi Beyond Value Chain Mitigation framework or as part of a VCMI Carbon Integrity claim, but it does not lower the inventory number.

A practical consequence: if your Science Based Target requires a 50% absolute reduction in Scope 3 emissions by 2030, insetting moves you toward the target. Offsetting does not. This single point of difference reshapes the procurement decision.

When insetting counts toward Scope 3 (and when it does not)

Insetting counts toward Scope 3 only when several conditions are met:

  • The intervention must occur with an entity in your value chain.
  • The emissions reduction or removal must be measured against a defensible baseline.
  • The reduction must be attributed to your share of that supplier’s output, not double-counted with other buyers.
  • It must follow the inventory accounting rules in the GHG Protocol Land Sector Standard, not the project accounting rules used to generate credits.

The most common failure mode is double counting. If your supplier sells the same reduction as a credit on the voluntary market and also reports it to you as a Scope 3 reduction, the math breaks. The Standard requires you to address this risk, typically by purchasing and retiring the supplier-issued credit as part of your inventory or by contractual provisions that prevent the supplier from selling the reduction twice.

When insetting does not count toward Scope 3: when the intervention sits with a supplier you do not buy from, when the baseline is not defensible, when the attribution is unclear, or when the documentation does not survive audit. Those cases default to Beyond Value Chain Mitigation, which is still useful but operates on a different ledger.

The procurement and supplier engagement question

Insetting is harder than offsetting. That is the unfashionable truth most buyers eventually confront. Offsetting is a transaction; insetting is a relationship.

To run an insetting program, you need supplier mapping precise enough to know which farms or facilities sit at which Scope 3 boundary. You need an engagement model that gets suppliers to participate, which usually requires multi-year commitments and shared economics. You need an MRV architecture that measures the right things and produces audit-ready documentation. And you need a contractual structure that prevents double counting and protects both sides.

The trade-off you receive in return is significant. Reductions count against your inventory rather than your residual. Supplier relationships deepen, which protects sourcing continuity. Yield and quality improvements often follow regenerative interventions, which reduces your input cost over time. And the regulatory file, under CSRD, CSDDD, EUDR, and the SBTi FLAG Guidance, is materially stronger.

Choosing the right tool for the right target

A practical decision rule. If your target is a science-based Scope 3 reduction and you operate in a FLAG sector or source FLAG commodities, insetting is the structurally correct tool. If your target is a net-zero claim that includes neutralising hard-to-abate residual emissions outside your value chain, BVCM via high-integrity offsets is the structurally correct tool. Most companies with material Scope 3 exposure need both, in different proportions, sequenced over time.

The sequencing matters. Insetting takes longer to stand up but produces a permanent reduction in the inventory. Offsetting can be transacted faster but does not change the inventory and now sits under tighter claim restrictions. Treat them as complementary tools with different jobs, not as substitutes. The Accountability Framework Initiative and the IUCN Global Standard for Nature-based Solutions both provide useful guardrails for the insetting side, with biodiversity, human rights, and benefit-sharing requirements that go beyond carbon math.

If you are mapping a Scope 3 reduction roadmap and need to scope which interventions count toward your inventory versus which sit in Beyond Value Chain Mitigation, the carbon and sustainability experts at Carbon Credit Capital can help you structure a nature-based supply chain investment program that fits your FLAG exposure, your target architecture, and your audit horizon. Schedule a consultation.

Continue Reading

Trending

Copyright © 2022 BreakingClimateChange.com

