As it passes its midway point, 2025 is on track to be the second or third warmest year on record, Carbon Brief analysis shows.
However, it is very unlikely to beat 2024 as the hottest year.
This is not surprising, as 2024’s record temperatures were boosted by a strong El Niño event that has now faded.
The analysis also finds there is a less than 10% chance that average temperatures in 2025 will be more than 1.5C above pre-industrial levels.
However, with long-term warming trending strongly upward and, potentially, accelerating, the world is expected to firmly pass the Paris Agreement 1.5C target – which refers to long-term warming, rather than annual temperatures – in the next five years.
So far, 2025 has seen record warm temperatures in January, the third warmest February and June and the second warmest monthly temperatures for March through May on record.
The world, as a whole, has warmed approximately 1.1C since 1970 – and around 1.4C since the mid-1800s.
These records are combined into an aggregate that reflects a single best-estimate, following the approach used by the World Meteorological Organization (WMO).
The first six months of 2025 have been very warm, each of them coming in the top-three warmest on record across all the different scientific groups that report on global surface temperatures. This is despite the presence of moderate La Niña conditions in the tropical Pacific at the start of the year, which typically suppress global temperatures.
The table below shows the rank of each month in 2025 relative to all the months since the dataset began (1850 for NOAA, Hadley/UAE and Berkeley Earth, 1880 for NASA, and 1940 for Copernicus/ECMWF). Hadley/UAE has been unusually slow in reporting data in 2025 and currently only has global mean surface temperature value available up to February.
It demonstrates how January 2025 was the warmest January on record in the WMO aggregate, March, April and May the second warmest and February and June the third warmest.
Monthly rank
NASA
NOAA
Hadley/UAE
Berkeley Earth
Copernicus / ECMWF
WMO avg
Jan
1st
1st
1st
1st
1st
1st
Feb
3rd
3rd
3rd
3rd
3rd
3rd
Mar
2nd
1st
1st
2nd
2nd
Apr
2nd
2nd
2nd
2nd
2nd
May
2nd
2nd
2nd
2nd
2nd
Jun
3rd
3rd
3rd
3rd
3rd
When combined, the first six months of the year in 2025 were the second warmest first half of the year in the historical record. Temperatures averaged at just 0.08C below the record set in 2024 after the peak of a strong El Niño event, as shown in the figure below.
Global mean surface temperature anomalies for the first half of the year from 1850 through 2025 from the WMO aggregate of temperature records. Anomalies plotted with respect to a 1850-1900 baseline. Chart by Carbon Brief.
When combined, the first six months of the year in 2025 were the second warmest first half of the year in the historical record. Temperatures averaged at just 0.08C below the record set in 2024 after the peak of a strong El Niño event, as shown in the figure below.
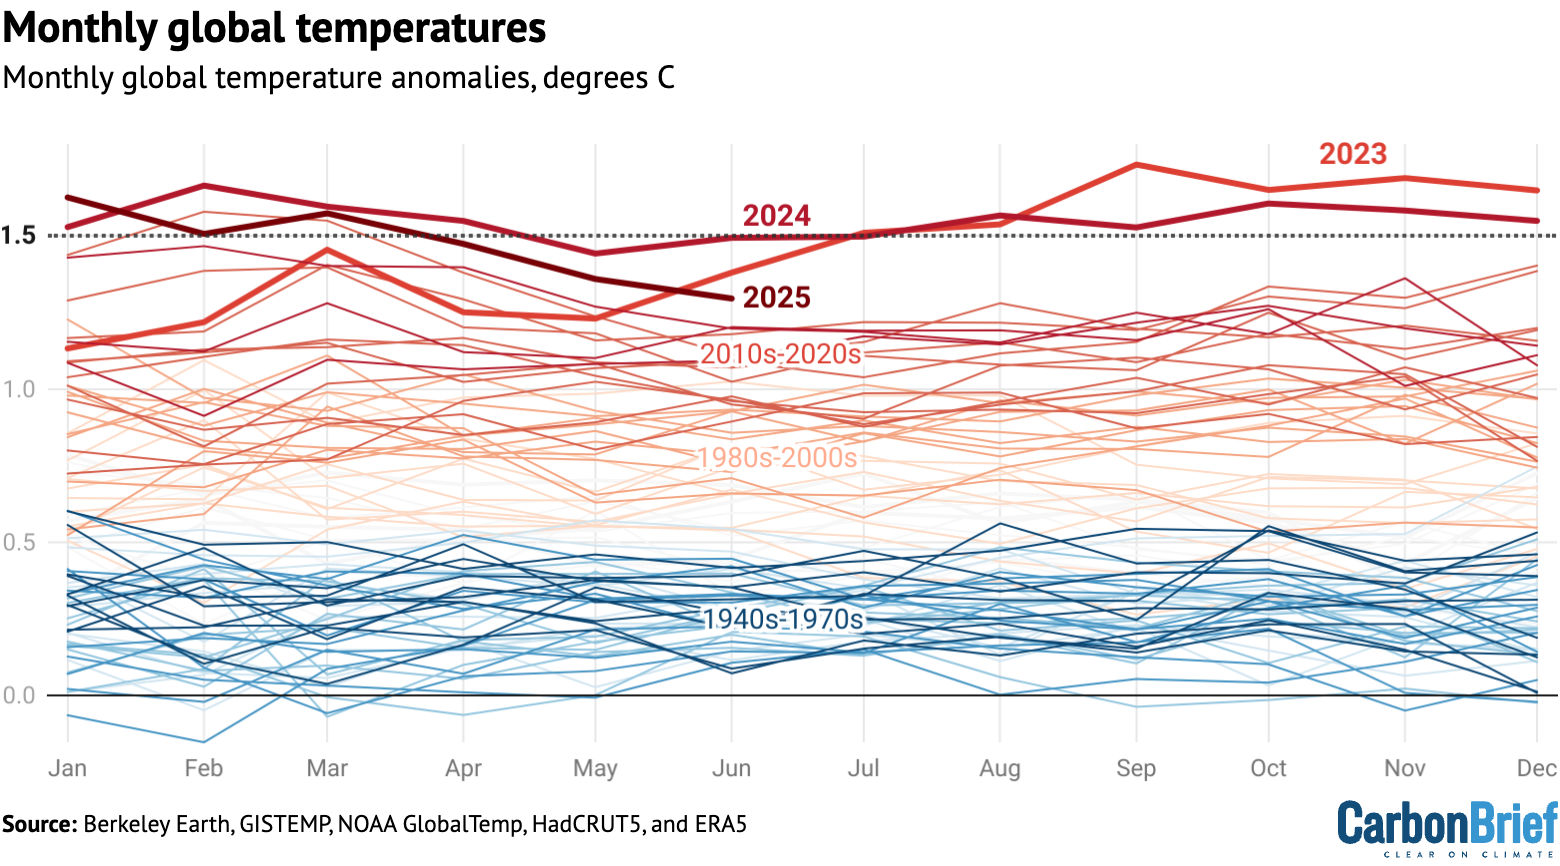
Temperatures for each month from 1940 to 2025 from the WMO aggregate of temperature records. Anomalies plotted with respect to a 1850-1900 baseline. Chart by Carbon Brief.
Global surface temperature is currently around 1.4C above preindustrial levels – in-line with the best estimate of the human contribution to global warming. Most of this warming – around 1.1C – has happened just since 1970.
However, global surface temperatures have been declining in May, April and June from highs at the beginning of 2025. This is driven in part by continued cooling of sea surface temperatures after an El Niño-driven peak in early 2024, as well as a contribution from short-lived weak La Niña conditions at the start of the year.
The figure below shows a range of different forecast models for ENSO conditions for the rest of this year, produced by different scientific groups. The values shown are sea surface temperature variations in the tropical Pacific – known as the El Niño 3.4 region – for overlapping three-month periods.
Neutral ENSO conditions are expected to persist through the start of 2026 in most models, with a handful of models showing a return to weak La Niña conditions (defined as El Niño 3.4 region sea surface temperatures under-0.5C) in the autumn and winter months. No models expect the development of El Niño conditions in 2025 and early 2026.
On track to be the second or third warmest year
Carbon Brief has created a projection of what the final global average temperature for 2025 will likely be by looking at the relationship between January-June temperatures and the annual average for each year since 1970. The projection also takes into account ENSO conditions in the first six months of the year and their projected development.
The analysis includes the estimated uncertainty in 2025 outcomes, given that temperature averages from only the first quarter of the year are available so far.
The chart below shows the expected range of 2025 temperatures using the WMO aggregate – including a best-estimate (red) and year-to-date value (yellow). Temperatures are shown with respect to the pre-industrial baseline period (1850-1900).
Annual global average surface temperature anomalies from the WMO aggregate plotted with respect to a 1850-1900 baseline. To-date 2025 values include January-June. The estimated 2025 annual value is based on the relationship between the January-June temperatures, ENSO conditions, and annual temperatures between 1970 and 2024. Chart by Carbon Brief.
Carbon Brief’s projection suggests that 2025 is virtually certain to be one of the top-three warmest years on record, with a best-estimate suggesting that global average temperatures will be approximately equal to 2023.
Currently, there is a less than 1% chance of 2025 being the warmest year on record, a 51% chance of it being the second warmest and a 49% chance of it being the third warmest. There is a roughly 9% chance that 2025 annual temperatures will exceed 1.5C above pre-industrial levels.
(A single year exceeding 1.5C is not equivalent to a breach of the Paris Agreement goal to limit temperature increases to 1.5C, which has been widely interpreted to mean temperature averages over 20 years.)
The figure below shows Carbon Brief’s estimate of 2025 temperatures using the WMO aggregate, both at the beginning of the year and once each month’s data has come in. The estimate jumped notably after 2025 saw the warmest January on record, but has been relatively stable over the past six months.
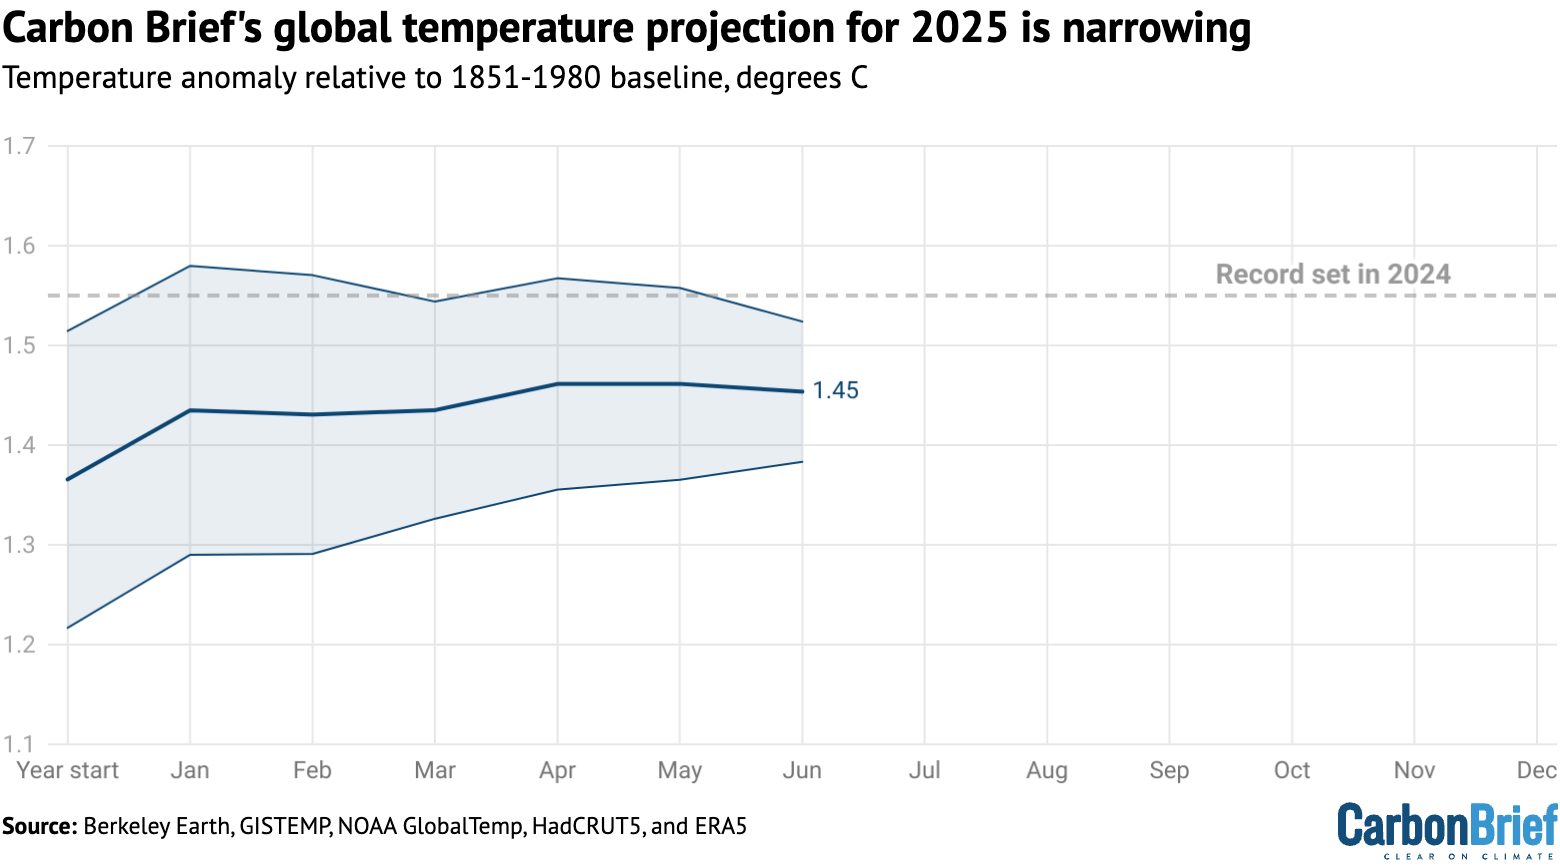
Carbon Brief’s projection of annual 2025 global temperatures based on the WMO aggregate at the start of the year and after earth month’s global surface temperature data became available. The dashed line shows the prior record set in 2024 at 1.55C. Chart by Carbon Brief.
Record or near-record warmth in many regions
While global average temperatures are an important indicator of changes to the broader climate system over time as a result of human activities, these impacts will differ as some regions experience more rapid warming or extreme heat events than is reflected in the global average.
The figure below shows the temperature anomalies for the first six months of the year relative to the 1951-1980 baseline period used by Berkeley Earth. Virtually the whole planet except a small area off the coast of Baja Mexico and in Antarctica saw temperatures warmer than that baseline, with much of Europe and Asia around 2C warmer than the 1951-1980 period.
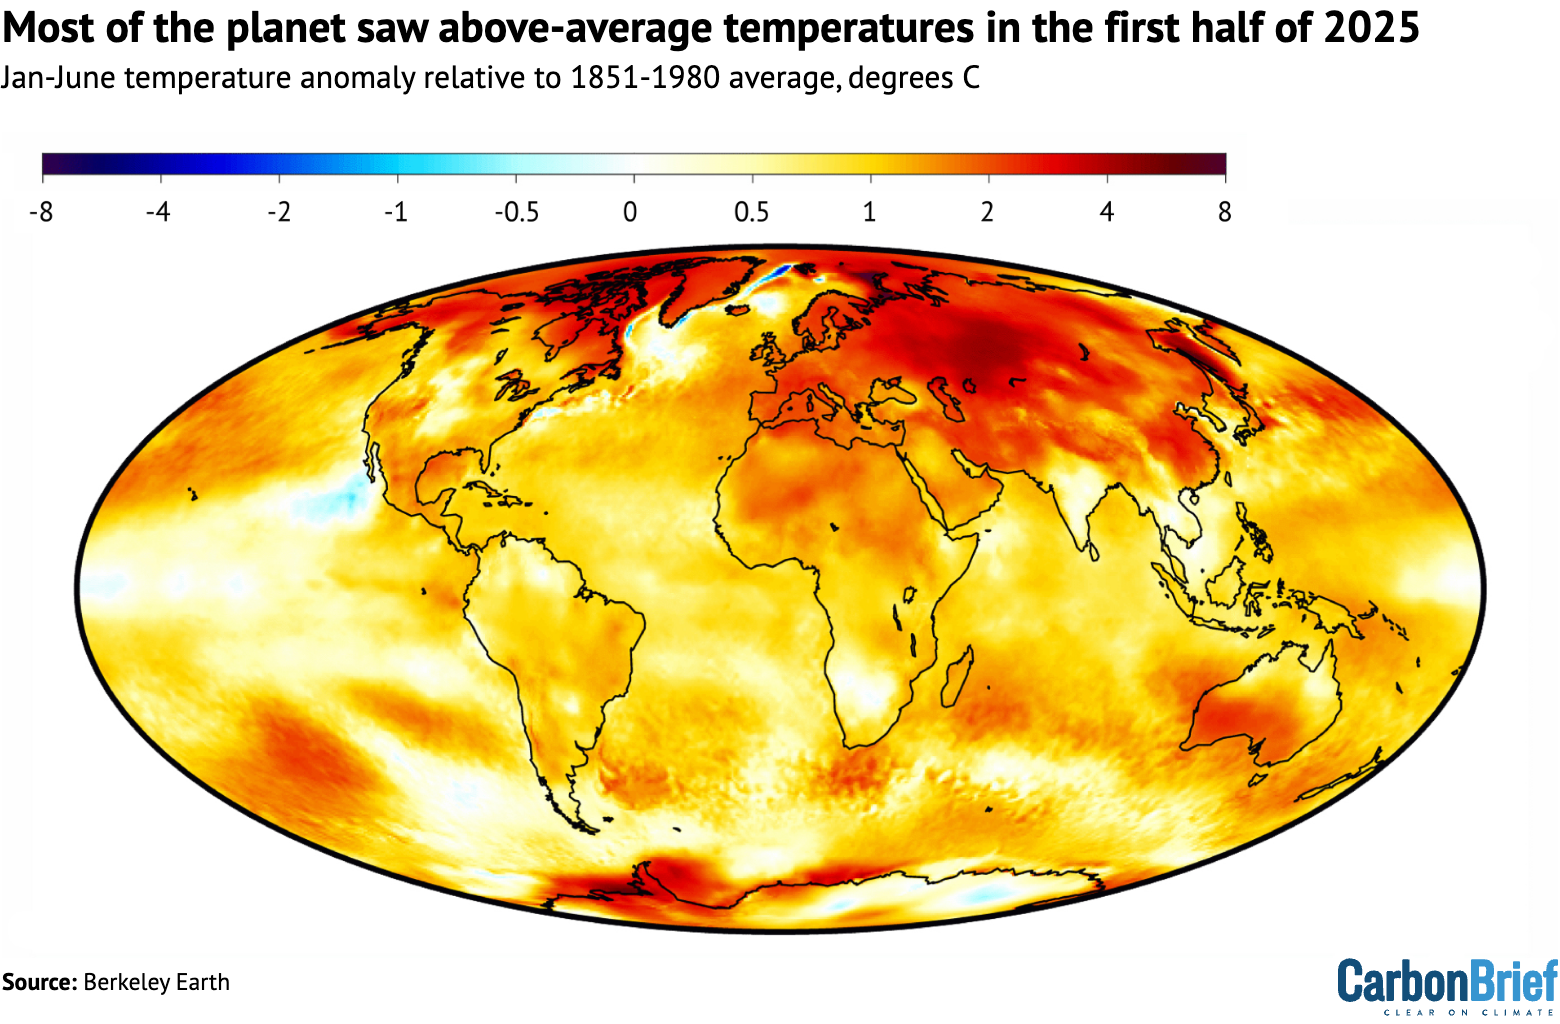
Map of year-to-date (January-June) global surface temperature anomalies shown relative to the 1951-80 period following the convention used by Berkeley Earth. Credit: Berkeley Earth.
A number of areas saw record warm temperatures over January through to June in the Berkeley Earth dataset, compared to all prior years since the global temperature record began in 1850.
The figure below shows areas of record warm temperatures in dark red; there were no areas with record – or even top-five – cool temperatures. (For more, read Carbon Brief’s factcheck on how climate change is not making extreme cold more common).
Map of year-to-date (January-June) regions that set new records (warmest through to fifth warmest). Note that no regions set cold records for the year-to-date in 2025. Credit: Berkeley Earth.
Notable areas of record warmth include much of China, south-west Australia and the Mediterranean region. Western Europe, in general, was quite warm, though most land areas did not see a new record set. Overall, approximately 7% of the surface saw record warming in the first six months of the year.
In June, the western Mediterranean saw particularly exceptional warmth, as shown in the figure below. This marine heatwave was driven by a combination of short-term natural variability on top of the long-term warming trend in the region.
The temperature increase in the western Mediterranean region in July – relative to the long-term warming trend – represents the largest short-term increase in temperatures for the region since June 2003, which was a precursor to a devastating heatwave that is believed to have killed 70,000 people.
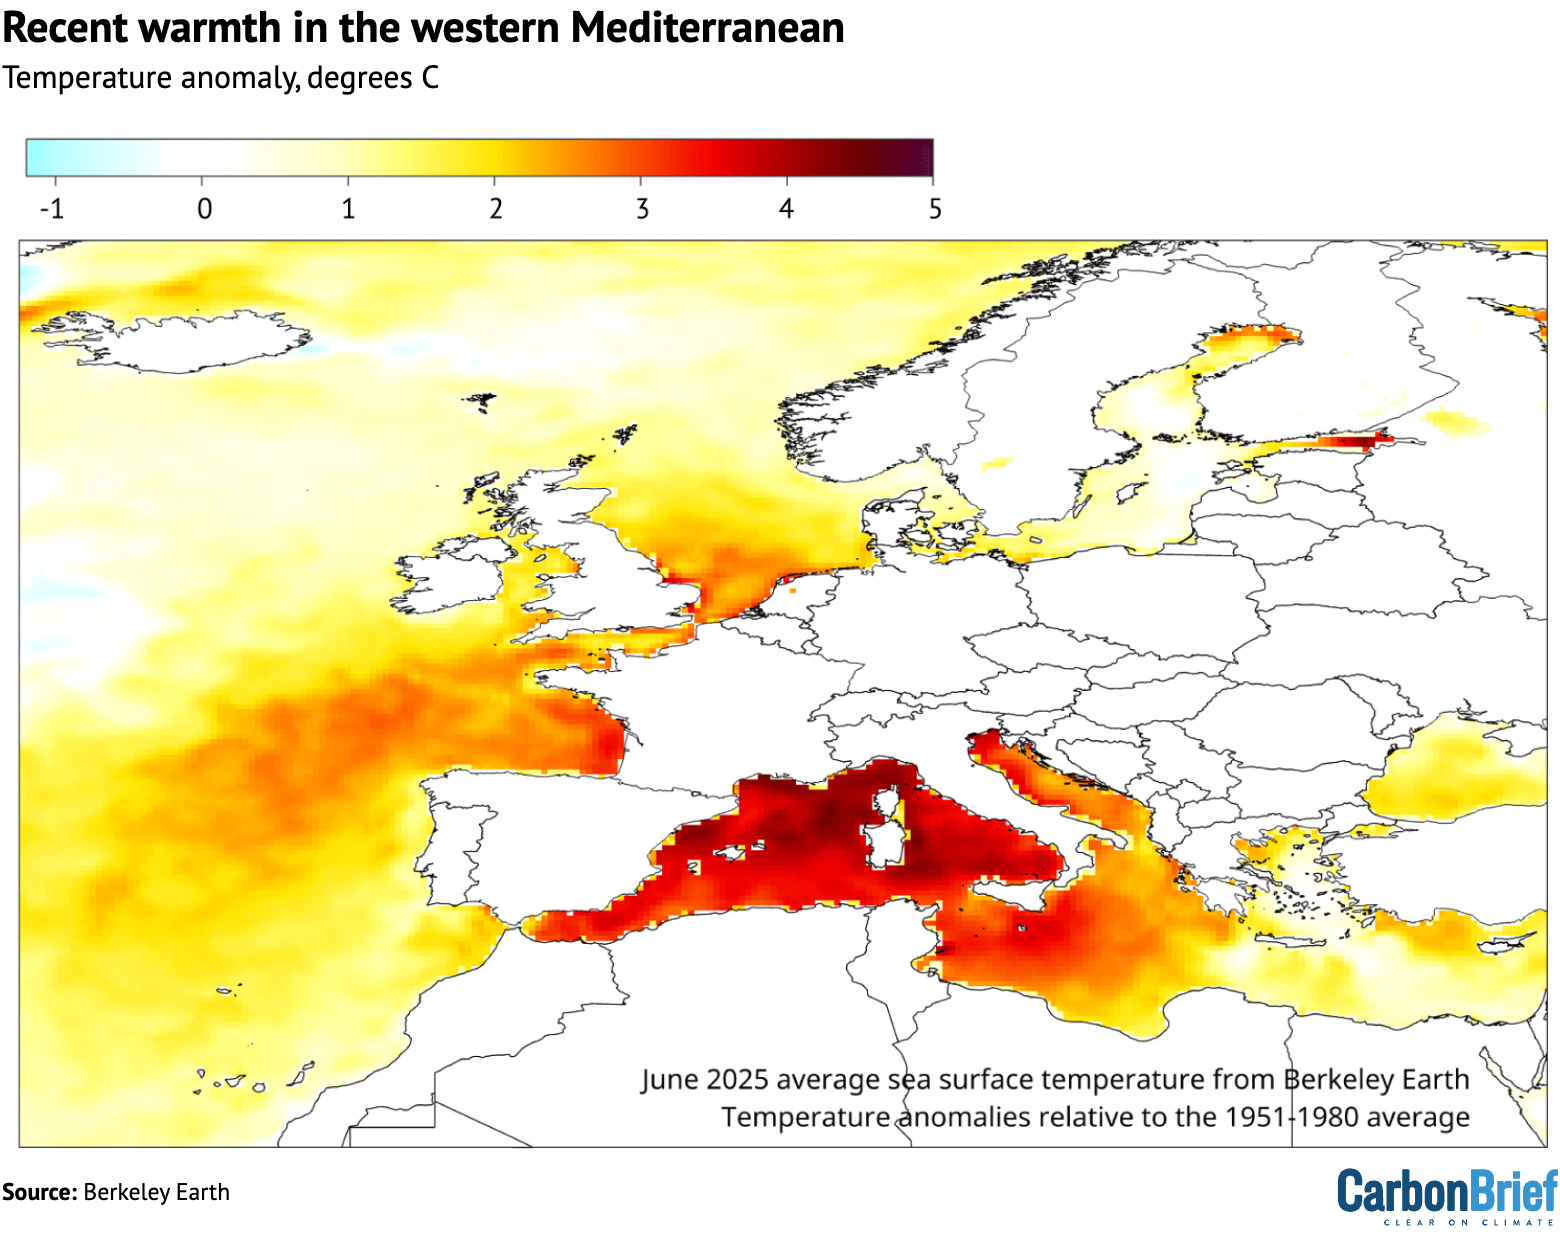
Map of June global surface temperature anomalies over the Mediterranean region, shown relative to the 1951-80 period following the convention used by Berkeley Earth. Credit: Berkeley Earth.
Record-low Arctic sea ice extent in June
Arctic sea ice extent saw record lows for much of June 2025 and early July, moving out of record territory in mid-July, but remaining far below the historical range (1979-2010).
Antarctic sea ice extent has been at the low end of the historical range for much of the year, but has not set new records aside from a brief period in late February and early March.
The figure below shows both Arctic and Antarctic sea ice extent in 2025 (solid red and blue lines), the historical range in the record between 1979 and 2010 (shaded areas) and the record lows (dotted black line).
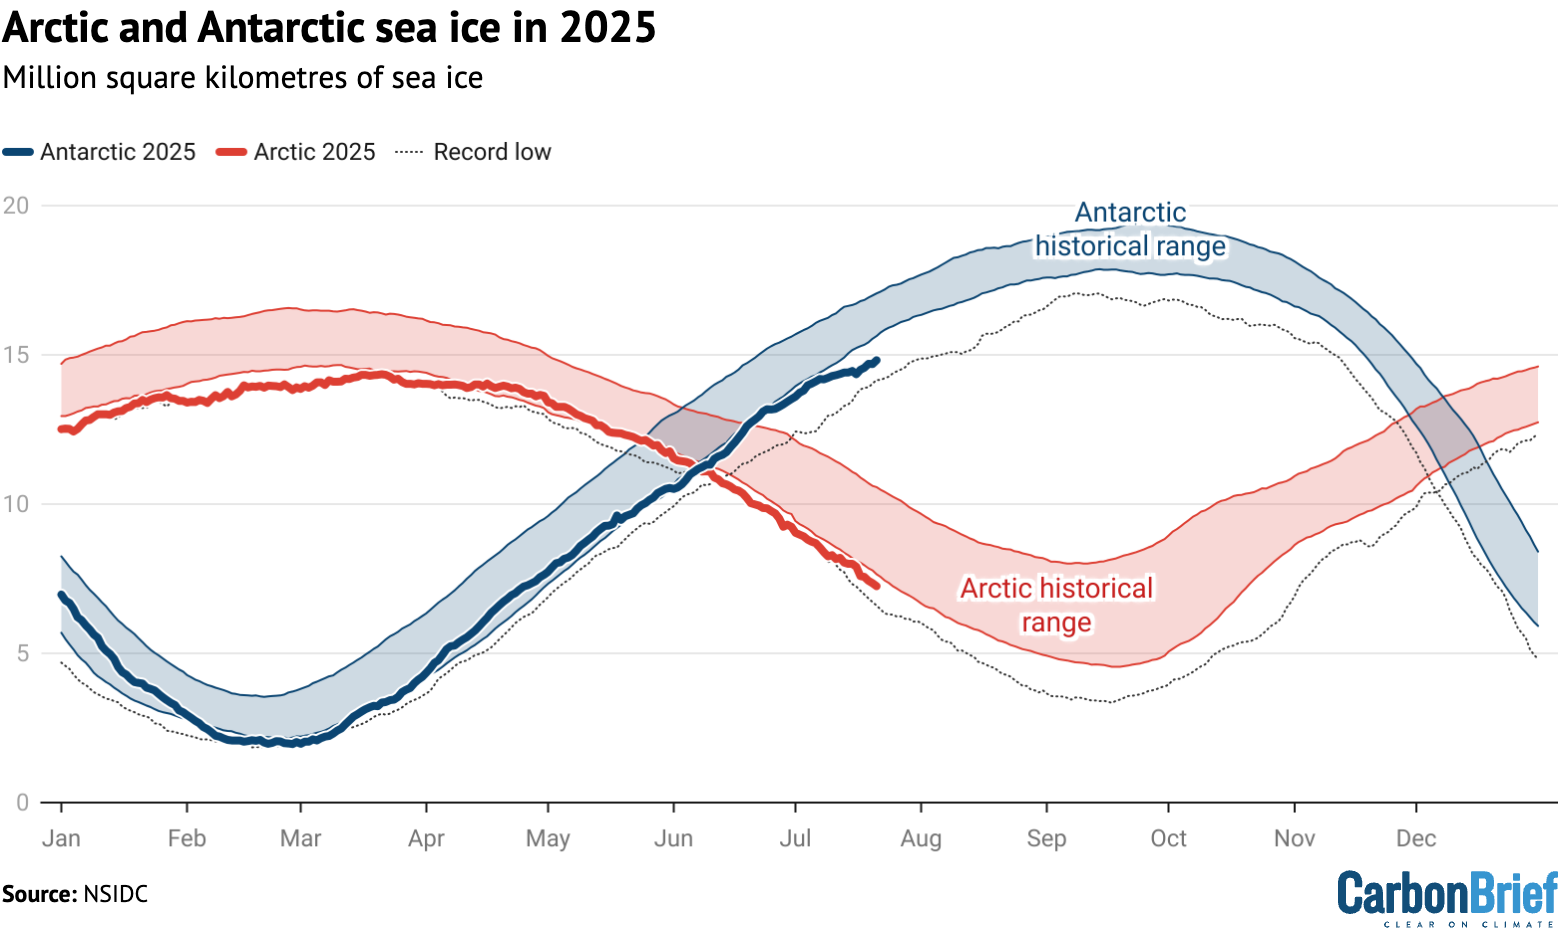
Arctic and Antarctic daily sea ice extent from the US National Snow and Ice Data Center (NSIDC). The bold lines show daily 2025 values, the shaded area indicates the two standard deviation range in historical values between 1979 and 2010. The dotted black lines show the record lows for each pole. Chart by Carbon Brief.
Unlike global temperature records, which only report monthly averages, sea ice data is collected and updated on a daily basis, allowing sea ice extent to be viewed up to the present.
However, this dataset – which has been continuously measured by satellites and assembled by the US National Snow and Ice Data Center (NSIDC) since 1979 – may soon be less available.
The US Department of Defence is planning to cease provision of satellite sea ice extent data to the NSIDC at the end of July. While some other satellite instruments can be used to help fill in the gaps, the change will degrade the scientific ability to effectively track this key climate variable.
Rising temperatures are redistributing the risk of childhood malaria in sub-Saharan Africa, resulting in areas of “new risk” in the east and south of the continent, but also “relief hotspots” in western Africa.
This is according to a new study, published in Nature, which provides the “most comprehensive look to date at the impact of climate change on any infectious disease”.
The research finds that since the year 1900, climate change has resulted in one extra case of malaria for every 1,000 children in sub-Saharan Africa on average.
Over the 21st century, climate change is expected to drive down malaria rates across the continent on average, as temperatures rise above the optimum range for mosquitoes.
However, the authors emphasise that continent-wide averages hide more detailed local trends.
They find that cooler parts of Africa face an increase in malaria risk, as rising temperatures have made the regions more suitable for malaria-carrying mosquitoes, while warmer regions see a suppression in malaria cases.
The lead author tells Carbon Brief that this is the first study to use “attribution” – a field of climate science which uses models to compare conditions in a world with global warming to one without – to assess the impact of climate change on malaria.
The study also reveals that climate change is not the main driver of shifting malaria risk in Africa, with public health measures and government policy making a more significant impact.
The “most important” message from the study, according to another expert, is that to eliminate malaria entirely, “effective surveillance, prevention and treatment remain substantially more influential – and more actionable – than climate change alone”.
Childhood malaria
Malaria kills hundreds of thousands of people every year. The World Health Organization (WHO) estimates that 610,000 people died due to the disease in 2024.
The disease is transmitted to humans by bites from mosquitoes infected with the malaria parasite. Malaria spreads most rapidly in warm, wet regions, where the parasite-carrying mosquitoes can live and breed.
However, malaria is preventable. A total of 42 countries – mainly in Europe and the Americas – have eliminated the disease entirely through a combination of measures including insecticide use, draining the swamplands that provide breeding habitats for mosquitoes and improving basic healthcare services .Global mortality from malaria declined by 90% over the 20th century.
Today, the vast majority of malaria cases are recorded in Africa, which was home to 95% of malaria cases and deaths in 2024. Children under the age of five make up three-quarters of all African malaria deaths.
The malaria-causing parasite can be detected using a blood test. Over the last century, scientists, government officials and healthcare professionals have collected thousands of blood samples from people across sub-Saharan Africa and tested for the presence of the malaria parasite.
In 2017, scientists brought together more than 50,000 samples collected from sub-Saharan Africa over 1900-2016. This data provides a “snapshot” of the amount of malaria in the population in any year in the last century the study explains.
Dr Colin Carlson is an assistant professor of epidemiology at the Yale school of public health and lead author of the study. He tells Carbon Brief that malaria in Africa is “extraordinarily well documented”, as a result of academic interest and colonial rule in the continent.
The size and quality of the malaria dataset are “exceptionally rare”, Carlson says. He explains that the dataset stretches back to before the impacts of human-caused climate change were strongly felt, making it “extraordinarily” valuable for this analysis.
The chart below shows the percentage of children between two and 10 years old who tested positive for the malaria parasite over 1900-2016. Each dot indicates one blood test result and the pink vertical bars indicate periods of “successful malaria prevention intervention”, such as the 1955-69 global malaria eradication programme.
The percentage of children between two to 10 years old who tested positive for the parasite that causes malaria between 1990 and 2016. Source: Carlson et al. (2026)
Attribution
The authors use the blood test survey data to develop a statistical model separating out the climatic, social and economic factors that affect malaria, such as temperature, rainfall, economic development, healthcare and population changes. This allows the authors to isolate the effects of the climate on malaria.
They find that malaria prevalence in children peaks when average monthly temperatures reach 24.9C, dropping off in warmer and cooler climates.
Mosquitoes also need stagnant or slow-moving water in which to lay their eggs. The authors find that periods of drought tend to decrease malaria prevalence one-to-two months later, whereas floods increase prevalence two-to-three months later. However, they conclude that rainfall is “less important than temperature” in predicting malaria rates.
They then combine the statistical models with climate models, to simulate childhood malaria rates in a range of past and future climates.
First, the authors simulate malaria rates in the present day, by running the models using the climate of 2000-14. They then carry out the same analysis, using the climate of a hypothetical world without human-caused climate change.
By comparing the two, the authors were able to attribute the impact of climate change on malaria rates across Africa.
The link between climate change and malaria in Africa is complex and “surprisingly contentious”, according to the authors. For example, they write that “malaria resurgence in the east African highlands became a particular point of contention, with over a dozen studies arguing for or against climate change as a substantial driver”.
It adds:
“Today, malaria experts generally agree that climate change has contributed to elevational shifts in malaria epidemics and the geographical ranges of mosquito vectors. However, the cumulative effect of climate change on the burden of malaria is still an open question.”
Lead author Carlson says this paper is “one of the first impact attributions on infectious disease” and the first attribution study on climate change and malaria. He adds:
“I think it’s the most clarity we’ve had on the malaria question.”
Dr Teresa Yamana, an associate research scientist at Columbia University, who was not involved in the study, praises its “rigorous” methodology. She tells Carbon Brief that the work “demonstrates the potential of climate attribution methods to quantify the impacts of climate change on infectious diseases”.
Warming world
The findings show that “climate change isn’t just making malaria worse or better – it’s moving it, says study author Prof Tamma Carleton, an assistant professor at UC Berkeley:
“Whether a place sees elevated malaria risks or reduced burdens under climate change depends on how hot it is today. We see relief in the hotspots and new risk nearly everywhere else.”
For example, in the Ethiopian highlands, low temperatures – which are unsuitable for mosquitoes to live and breed – have historically limited the spread of malaria. However, the region has seen childhood malaria rates increase by more than eight cases per 1,000 children since the year 1900 as rising temperatures have allowed the insects to expand their habitat.
The authors also found a similar increase in malaria prevalence in cooler southern African countries.
In contrast, global warming is pushing average temperatures above the ideal range for mosquitoes in many hotter parts of Africa, driving down malaria rates. The authors find that in western Africa, climate change has caused a reduction of four malaria cases per 1,000 children per year by 2014, reducing prevalence by 1-2%.
Overall, climate change has resulted in one extra case of malaria for every 1,000 children in sub-Saharan Africa since the year 1900, the study says.
The authors also run their models for three future climate scenarios: low (SSP1-2.6), intermediate (SSP2-4.5) and very-high (SSP5-8.5) emissions pathways. Comparing these to the present-day model results shows how climate change could affect malaria cases over the coming century.
They find that the trends observed so far will largely continue into the future – meaning climate change will lower the prevalence of malaria in warm regions and increase the prevalence in cool regions.
The study concludes that under the intermediate scenario, which is broadly in line with current climate policies, warming will drive down childhood malaria cases by about three cases per 1,000 children in central Africa and 16 cases per 1,000 children in west Africa by the end of the century.
By contrast, cases could increase by around 20% over the same period in regions such as the Rift Valley and coastal southern Africa – a rise of 30 cases per 1,000 children.
The maps below show changes in childhood malaria prevalence due to climate change in today’s climate (left) and the climate of 2096-2100 under the intermediate scenario (right).
Red indicates an increase in malaria prevalence and blue indicates a decrease. Greyer colours indicate greater uncertainty in the model results. White indicates regions where no data was collected.
Carlson tells Carbon Brief that this is “the first study to really confidently answer the highland East Africa debate”.
Eradicating malaria
Healthcare workers, governments and scientists have been working to eliminate malaria for decades.
On average, the authors find that climate change will reduce the prevalence of malaria in sub-Saharan Africa, as temperatures rise above the optimum range for mosquitoes. This effect is more pronounced at higher warming levels.
Under the low emissions scenario, about 1 case per 1,000 children will be averted by the end of the century. Meanwhile under the highest emissions scenario, average prevalence falls by 20 cases per 1,000 children, marking a 9% reduction.
The graph below shows childhood malaria rates over 1990-2024 in the historical climate (blue) and in a world without climate change (grey). These estimates are shown relative to baseline prevalence across 1901-30.
After the year 2014, the plot shows projected future changes in malaria prevalence, relative to a 2015-20 baseline, in the low (purple), intermediate (pink) and high (green) scenarios.
Malaria prevalence in the historical climate (blue), historical climate without global warming (grey), low emissions scenario (purple), intermediate emissions scenario (pink) and very-high emissions scenario (green). Source: Carlson et al. (2026)
Carlson emphasises that this does not mean that climate change is “good news” for healthcare in sub-Saharan Africa. He explains that climate change will bring a wide range of negative health impacts that will strain healthcare systems, adding:
“A world that is too hot for malaria is not a good world for the health of children.”
He also notes that climate change is “not the primary driving factor of malaria dynamics”. For example, he notes that malaria prevalence fell over 2000-15, by about 16 percentage points, after the disease was identified as a “critical global target of the Millennium Development Goals”.
This reduction is 200 times greater than the increase seen so far because of climate change, Carlson says. He adds:
“It would not be tremendously hard both to keep malaria out of new places and to eliminate it where it is maybe going to get a little bit of an assist from climate change.”
Woyessa praises the study, telling Carbon Brief that the research could bring about a “paradigm shift” in efforts to eliminate malaria. He argues that the study is a “tool for engaging giant development partners”, adding that “future work will be needed to situate these global trends in local contexts”.
However, she cautions that the findings “should not be interpreted as forecasts of total future malaria burden”, because they only model the impact of climate change on malaria, while excluding “social, demographic and public-health determinants”, such as inequality, migration, conflict and changing access to malaria interventions.
She adds:
“One of the paper’s most important messages is this: effective surveillance, prevention and treatment remain substantially more influential – and more actionable – than climate change alone.”
Carlson, C. et al. (2026) The past and future impact of climate change on childhood malaria in Africa, Nature, doi:10.1038/s41586-026-10840-w
Related
Q&A: Europe’s May and June heatwave deaths – and how they were counted
China has released its “15th five-year plan for the development of renewable energy”, outlining key targets and policies for the sector in 2026-2030.
A key focus of the plan is boosting renewable generation and consumption as a share of China’s overall energy mix.
It calls for continued capacity additions of wind and solar – albeit at lower levels than previous years – as well as hydropower, biomass and other clean-energy sources.
Specifically, China will aim to install 3,500 gigawatts (GW) of renewables capacity by 2030, 2,800GW will be wind and solar.
The country had previously pledged to install 1,200GW of wind and solar by 2030, a goal that China met six years early.
Another major theme is the provision of wind and solar supply that is “dependable” and “grid-friendly”.
Setting a target for “dependable output” from wind and solar could help to entrench their role as a provider of “energy security”, according to analysts.
The government also aims to boost renewables consumption by developing non-power uses of renewable energy, in sectors such as steel and chemicals.
Below, Carbon Brief examines the key targets and policies outlined in the five-year plan and what they mean for China’s energy transition.
Five-year plans are key to China’s political system. An overarching plan, covering all socioeconomic issues of importance to policy leaders, is published at the beginning of each five-year cycle.
The plan for the 15th five-year period (2026-2030) was published in March 2026.
It includes what the government considers to be the most important targets and policy signals for climate and energy. For example, binding targets for carbon intensity, the share of non-fossil energy in total energy consumption and total energy production capacity.
Following this overarching document, five-year plans focused on specific sectors or themes are then published over the course of the five-year plan period.
This year, the government has already published several five-year plans related to energy and climate change. One covers the development of the “new-type” energy sector more broadly. Another wraps climate goals together with other environmental targets under the “Beautiful China” programme.
By contrast, the renewables five-year plan focuses specifically on the development of hydropower, wind, solar, biomass, geothermal and wave energy.
It covers topics including capacity and generation targets, as well as efforts to increase integration and reliability of wind and solar. It also has policies to encourage “non-power use” of renewable energy and ways to strengthen innovation of clean-energy technologies.
What overarching renewables targets are in the plan?
China will aim to install 3,500 gigawatts (GW) of renewables capacity by 2030, according to the five-year plan.
Of this, 2,800GW will be wind and solar – a pledge reiterated from China’s action plan for peaking carbon emissions, which was released earlier this month.
The goal more than doubles a previous 2030 target for wind and solar to reach 1,200GW, which China met six years early.
As of June 2026, the country has installed just under 2,000GW of wind and solar capacity, as well as 454GW of hydropower. Biomass, geothermal and wave energy hold very small shares of the overall energy mix.
As such, China would need to build 160GW of wind and solar each year – and just under 220GW of renewable capacity in total – to meet the targets.
The country installed 277GW of new solar alone in 2024 – and 315GW in 2025.
China’s total installed capacity of renewable energy from 2016-2025, and its target for 2030. Source: National Energy Administration, Carbon Brief.
A key part of meeting the targets will be the development of large-scale clean-energy bases in China’s northern regions. These will generate power to be exported elsewhere via ultra-high voltage lines. The plan also encourages greater “local consumption” and installations of distributed energy (see below).
The plan says that further research will be directed at increasing the renewable share of electricity generated by these large-scale energy bases to 100%.
A recent report by the thinktank Global Energy Monitor (GEM) finds that output from these bases “continues to be paired with coal-fired generation in the name of balancing and system flexibility”. It says that currently, coal generates 42% of the power transmitted to the rest of the country from these bases.
China will also add more hydropower, says the plan, with capacity rising from 448GW in 2025 to 570GW in 2030. Some 160GW of this will be pumped-storage hydropower.
Meanwhile, the plan sets a target for renewable power generation to reach 6,000 terawatt-hours (TWh), 4,000TWh of which would come from wind and solar.
This would be a 50% increase in five years as renewables generated just under 4,000TWh of electricity in 2025, according to the National Energy Administration.
By 2030, the plan says that total consumption of renewable energy will stand at 1.8bn tonnes of coal equivalent (Gtce).
This would be up from 1.2Gtce in 2025, which represented about one-fifth of China’s total energy consumption of 6.2Gtce that year.
The renewable targets in the plan are lower than those suggested in a recent study by high-profile Chinese scholars.
The study, from the department of energy and power engineering and the Institute of Climate Change and Sustainable Development at Tsinghua University in Beijing, assessed the “likelihood of China attaining its carbon peak” under different pathways.
It found that, in order to meet its climate commitments, China would need to either install more than 4,000GW of “non-fossil energy capacity” before 2030, or to “maintain a total energy consumption” below 6.5Gtce.
The table below outlines some of the key renewables targets for 2030, as specified in the plan.
Key targets for 2030, adapted from 15th five-year plan for renewable energy
Type
2025
2030
Percentage change
Renewable energy use
1.2Gtce
1.8Gtce
53%
Total renewables capacity
2,340GW
3,500GW
50%
Wind and solar capacity
1,840GW
More than 2,800GW
52%
Of which: Solar thermal
1.8GW
15GW
733%
Hydro capacity
450GW
570GW
27%
Of which: Pumped storage hydropower
66GW
160GW
142%
Wave energy
–
0.4GW
–
Renewable generation
4,000TWh
6,000TWh
50%
Of which: Wind and solar
2,300TWh
4,000TWh
74%
Non-electricity use
60Mtce
150Mtce
150%
Renewable hydrogen
0.25Mt
2Mt
700%
Why does the plan focus on ‘firm capacity’ for renewables?
As well as increasing the overall size of China’s renewable power supply, the country must also maintain an “uninterrupted and reliable power supply”, officials from the NDRC and NEA told state news agency Xinhua in coverage of the new plan.
To support this goal, the plan says that the development of renewables will “enter a new stage”. This will mean that “improving quality and serving as a reliable alternative” to fossil fuels will be as important as “expanding scale”.
The plan, therefore, proposes targets for the “firm capacity” from wind and solar (置信出力). This is the amount plants or grids can be relied on to produce during critical supply periods, in conjunction with on-site storage.
The target for wind is a firm capacity of at least 11% of total installed capacity by 2030, while the equivalent goal for solar is 6%.
Wind and solar will also be expected to supply more than 20% of total demand in peak periods during the summer and winter evenings, says the plan. It expects “reliable peak-shaving capacity from renewable sources” to reach more than 300GW.
The new targets are a “positive move”, says Yao Zhe, global policy advisor at Greenpeace East Asia, as it “only applies during peak load and critical supply periods, when coal power is typically used to stabilise the power supply”.
She adds that this could, theoretically, “prevent the construction of new coal-fired power projects that are proposed and approved for the reason of meeting peak demand”.
The new metrics mark a change in focus, says Lyu Wenbin, director general of the Energy Research Institute – a state thinktank under the NDRC – in an “explanatory reading” posted on BJX News. He says it “marks a shift in renewable energy development from the mere pursuit of installed capacity to…also taking into account system support capabilities”.
The plan pledges to “accelerate the construction of grid-friendly wind and solar power stations”. It says this will enhance “reliable peak-load generation” and strengthen renewables’ ability to ensure “safe and stable operation” of the grid.
It says this will particularly be a focus in the energy-hungry east, central and south areas of China.
It sets out a slightly different focus for areas that already have a high share of renewables in their power mix, such as north-west China. Here, the aim will be to develop wind and solar parks that are “capable of providing voltage, frequency and inertia support”.
“This is a real challenge”, says James Norman, research analyst at GEM. He says these challenges are particularly acute in some circumstances:
“[For example], when the share of wind and solar is very high, relatively few synchronous generators (like coal) are online or large volumes of electricity are being transferred through high voltage DC lines.”
The plan mentions many technological solutions to address the problem, he tells Carbon Brief. However, he adds, there are no quantitative details for the issue. For example, he notes there is no target for “how many gigawatts of wind and solar must gain grid-forming capability”. This is in contrast to the goals for overall renewables capacity or generation.
Norman was a co-author on the recent GEM report, which identified further barriers to renewable uptake. It said these include transmission bottlenecks, alongside systemic features such as dispatching and power-contract mechanisms.
As a result, said the report, renewable power – especially solar – is increasingly being “curtailed”, particularly in north-western and northern provinces.
Yao also notes that the plan does not “spell out specific measures to address systemic constraints” around the electricity grid and the role of coal in the power sector.
“I interpret this as evidence that the vested interests are still strong in the policy debate,” she adds.
What does the plan say about ‘distributed’ energy?
Alongside gigawatt-scale clean-energy megabases, China also aims to expand construction of “distributed” energy. This means smaller-scale installations, such as rooftop solar.
More than 300GW of “distributed new energy” is to be added over 2026-30, some 60GW per year.
The plan aims for distributed new energy to be adopted in sectors such as industry, transport, buildings and agriculture.
Applications include the use of distributed solar and wind in industrial parks, coal mines and oilfields, as well as encouraging residents to install solar panels on buildings and developing rural clean-energy grids.
In some regions, distributed solar and wind is “likely to meet a large proportion of local demand”, says Prof Pan Jiahua at the Hong Kong University of Science and Technology (Guangzhou). He tells Carbon Brief that micro- and mini-grids using such resources will be particularly important in central and coastal China.
The 60GW annual target for new distributed energy is not “overly ambitious”, says Isadora Wang, head of China at the thinktank Transition Asia. She tells Carbon Brief that distributed solar additions, alone, exceeded 100GW in both 2024 and 2025.
Cosimo Ries, analyst at the consultancy Trivium China, agrees that the target is reachable. The biggest question mark, he tells Carbon Brief, is whether it will continue to make sense for industry and utilities to build distributed power at the volumes seen during the 14th five-year plan period.
He adds that market conditions for distributed solar have deteriorated sharply over the past two years. He says a range of factors have hit investor confidence:
“[Distributed solar faces] growing exposure to market trading, worsening returns in spot markets, growing risks of curtailment and new policies limiting or forbidding the selling of power back to the grid.”
What does the plan say about non-electricity use of renewables?
The plan also sets goals for renewable energy’s role in “non-electricity use”.
This means using renewable energy for purposes other than generating electricity, through converting it to other forms, such as heat or mechanical energy.
The government is aiming for non-power use to nearly triple from 60m tonnes of coal equivalent (Mtce) in 2025 to 150Mtce in 2030.
Ries tells Carbon Brief that he thinks this target is “one of the main highlights” of the plan. However, he notes that limited available data means it is hard to assess the level of its ambition. He adds that, given the relative conservatism of China’s other recent clean-energy targets, this one may also be met relatively easily.
Key applications for non-power use of renewables include “green hydrogen, ammonia and methanol”, says the plan. It also points to using wind and solar for heat, as well as to biomass and geothermal for heating and cooling.
Green hydrogen, ammonia and methanol are the “centrepiece” of the non-power push, according to state-owned newspaper Economic Information Daily.
For hydrogen alone, China plans to scale up renewable hydrogen production to 2m tonnes in 2030, up from 250,000 tonnes in 2025.
Today, non-power use of renewables accounts for only around 1% of China’s total energy consumption, NEA and NDRC officials said in a Q&A. They added that there is “considerable room for growth” in sectors such as industry, transport and buildings.
Potential new applications include the use of wind and solar for heat. This could see the use of centralised wind and solar heating stations in the chemicals, textiles, pharmaceuticals, papermaking and food sectors.
New projects in the steel and cement sectors should use locally-generated wind and solar to power electric-arc furnaces and kilns, adds the plan.
Wang tells Carbon Brief that she believes the naming of individual sectors is a “clear indication” that they will be included in China’s renewable consumption quotas. These already cover aluminium and other heavy industry sectors.
She adds that power and heat demand from the named sectors may help absorb distributed renewable energy. It will also serve as a testing ground for matching demand with supply through increased grid flexibility and power price reforms.
To Ries, the growing focus on non-power use signals that China’s decarbonisation efforts are “now entering deeper waters”. That means regulators are turning from easier-to-abate sectors, such as aluminium, to more challenging industries, such as steel.
The plan could create a “second growth curve” for the new-energy industry, says He Zhao, in a commentary for China Power News Net. He, the vice-president of the China Electric Power Planning and Engineering Institute (EPPEI). says this might begin with non-power use, before shifting to fuel, feedstock and heat substitution.
What does the plan say about China’s cleantech dominance?
The next five years is a prime opportunity for China to “consolidate our leading position across the entire industrial chain” for clean-energy technologies, says the plan.
It adds that the government will “strengthen technological innovation” and accelerate the roll-out of new applications of artificial intelligence in China’s renewable-energy system.
A particular focus for new R&D will be “cutting-edge, original and disruptive technologies”. It also points to technologies that “enhance the reliability of renewable energy” as a substitute for fossil fuels.
The plan names technologies for further development. For wind power, these include “reliable and low-cost” blades, ultra-tall towers and new types of floating platforms. It also mentions the development of “high-altitude wind power”. For solar, it points to the development of perovskite and other “high efficiency” solar cells, as well as space-solar technologies.
The plan also pledges to develop a power market that supports the “full entry” of renewable-energy companies. It underscores that companies should plan for an increasingly market-based and competitive environment.
Meanwhile, the government will also deepen cooperation with other countries on clean energy and “advance” global climate cooperation, it says.
A priority will be “strengthening” international coordination on investment and development in “green energy projects”. Another is “actively promoting the free circulation of China’s high-quality green technologies and products in global markets”.
Chinese exports of clean-energy technologies have been surging, especially since the closure of the strait of Hormuz.
At the same time, Chinese investment in clean-energy projects in Belt and Road Initiative member states totalled $20bn in the first half of 2026. This is also driven by the crisis.
The US, EU and others have launched tariffs and pricing mechanisms to curb imports of Chinese cleantech. This has contributed to pushback from China, against what it and others refer to as “unilateral trade measures”.
China is transitioning from a “major energy nation” (能源大国) to an “energy powerhouse” (能源强国), writes the Energy Research Institute’s Lyu in his explanatory reading. He says this will enable China to increasingly shift to building “systemic” advantages in developing clean-energy technologies.
He continues that, from 2026-2030, China will “move to the very forefront of the global stage” on clean energy, “venturing into uncharted territory”. This will create both “major new challenges and significant opportunities” for the country, he adds.
Interview: Dr Sun Yixian on his new database tracking Chinese climate ‘leadership’
SYDNEY/KINGSTON, Wednesday 29 July — The future of deep sea mining will be a focus for world leaders this week as the International Seabed Authority (ISA) Assembly takes place in Kingston, Jamaica.
Country delegates and members from Pacific Civil Society have come together to discuss a deep sea mining code, while the call for a moratorium grows. It follows the ISA’s contentious decision last week to extend The Metals Company subsidiary Nauru Ocean Resources Inc’s (NORI) exploration contract, despite its support for the pursuit of unlawful deep sea mining via US unilateralism.
The Assembly’s agenda was agreed to yesterday, with a science item put forward by Vanuatu to be heard on Thursday local time. Overnight, Mozambique and Mauritius joined the call for a global moratorium.
Rae Bainteiti, Pacific Political Coordinator at Greenpeace Australia Pacific, said from the ISA in Kingston:
“As we move into the General Assembly this week, the fundamental issue remains that there is not enough science to guarantee the safety and protection of the ocean in a world where deep sea mining is allowed. As trustees of the ocean, the common heritage of humankind, our Pacific governments must stand firm against corporate interests that are pushing to move ahead with deep-sea mining outside the ISA framework. If deep sea mining goes ahead, Pacific communities will suffer the economic, cultural and social consequences. We continue to call on all States to support a moratorium as the principled and responsible pathway to protect the ocean.”
Currently, 45 countries, including seven Pacific nations, support a moratorium or precautionary pause on deep sea mining. Last week, Australia’s Labor National Conference committed to supporting a moratorium, but the government has yet to make an official comment.