Connect with us

Published

on

Rising temperatures are redistributing the risk of childhood malaria in sub-Saharan Africa, resulting in areas of “new risk” in the east and south of the continent, but also “relief hotspots” in western Africa.

This is according to a new study, published in Nature, which provides the “most comprehensive look to date at the impact of climate change on any infectious disease”.

The research finds that since the year 1900, climate change has resulted in one extra case of malaria for every 1,000 children in sub-Saharan Africa on average.

Over the 21st century, climate change is expected to drive down malaria rates across the continent on average, as temperatures rise above the optimum range for mosquitoes.

However, the authors emphasise that continent-wide averages hide more detailed local trends.

They find that cooler parts of Africa face an increase in malaria risk, as rising temperatures have made the regions more suitable for malaria-carrying mosquitoes, while warmer regions see a suppression in malaria cases.

The lead author tells Carbon Brief that this is the first study to use “attribution” – a field of climate science which uses models to compare conditions in a world with global warming to one without – to assess the impact of climate change on malaria.

The study also reveals that climate change is not the main driver of shifting malaria risk in Africa, with public health measures and government policy making a more significant impact.

The “most important” message from the study, according to another expert, is that to eliminate malaria entirely, “effective surveillance, prevention and treatment remain substantially more influential – and more actionable – than climate change alone”.

Childhood malaria

Malaria kills hundreds of thousands of people every year. The World Health Organization (WHO) estimates that 610,000 people died due to the disease in 2024.

The disease is transmitted to humans by bites from mosquitoes infected with the malaria parasite. Malaria spreads most rapidly in warm, wet regions, where the parasite-carrying mosquitoes can live and breed.

However, malaria is preventable. A total of 42 countries – mainly in Europe and the Americas – have eliminated the disease entirely through a combination of measures including insecticide use, draining the swamplands that provide breeding habitats for mosquitoes and improving basic healthcare services .Global mortality from malaria declined by 90% over the 20th century.

Today, the vast majority of malaria cases are recorded in Africa, which was home to 95% of malaria cases and deaths in 2024. Children under the age of five make up three-quarters of all African malaria deaths.

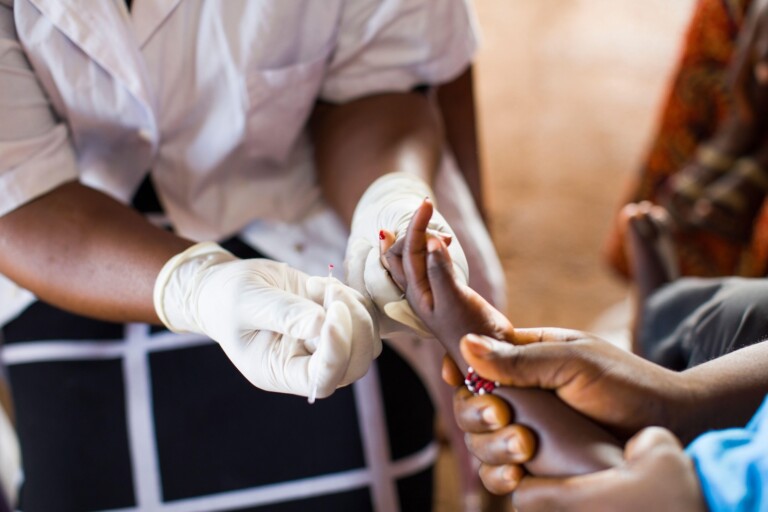
The malaria-causing parasite can be detected using a blood test. Over the last century, scientists, government officials and healthcare professionals have collected thousands of blood samples from people across sub-Saharan Africa and tested for the presence of the malaria parasite.

In 2017, scientists brought together more than 50,000 samples collected from sub-Saharan Africa over 1900-2016. This data provides a “snapshot” of the amount of malaria in the population in any year in the last century the study explains.

Dr Colin Carlson is an assistant professor of epidemiology at the Yale school of public health and lead author of the study. He tells Carbon Brief that malaria in Africa is “extraordinarily well documented”, as a result of academic interest and colonial rule in the continent.

The size and quality of the malaria dataset are “exceptionally rare”, Carlson says. He explains that the dataset stretches back to before the impacts of human-caused climate change were strongly felt, making it “extraordinarily” valuable for this analysis.

The chart below shows the percentage of children between two and 10 years old who tested positive for the malaria parasite over 1900-2016. Each dot indicates one blood test result and the pink vertical bars indicate periods of “successful malaria prevention intervention”, such as the 1955-69 global malaria eradication programme.
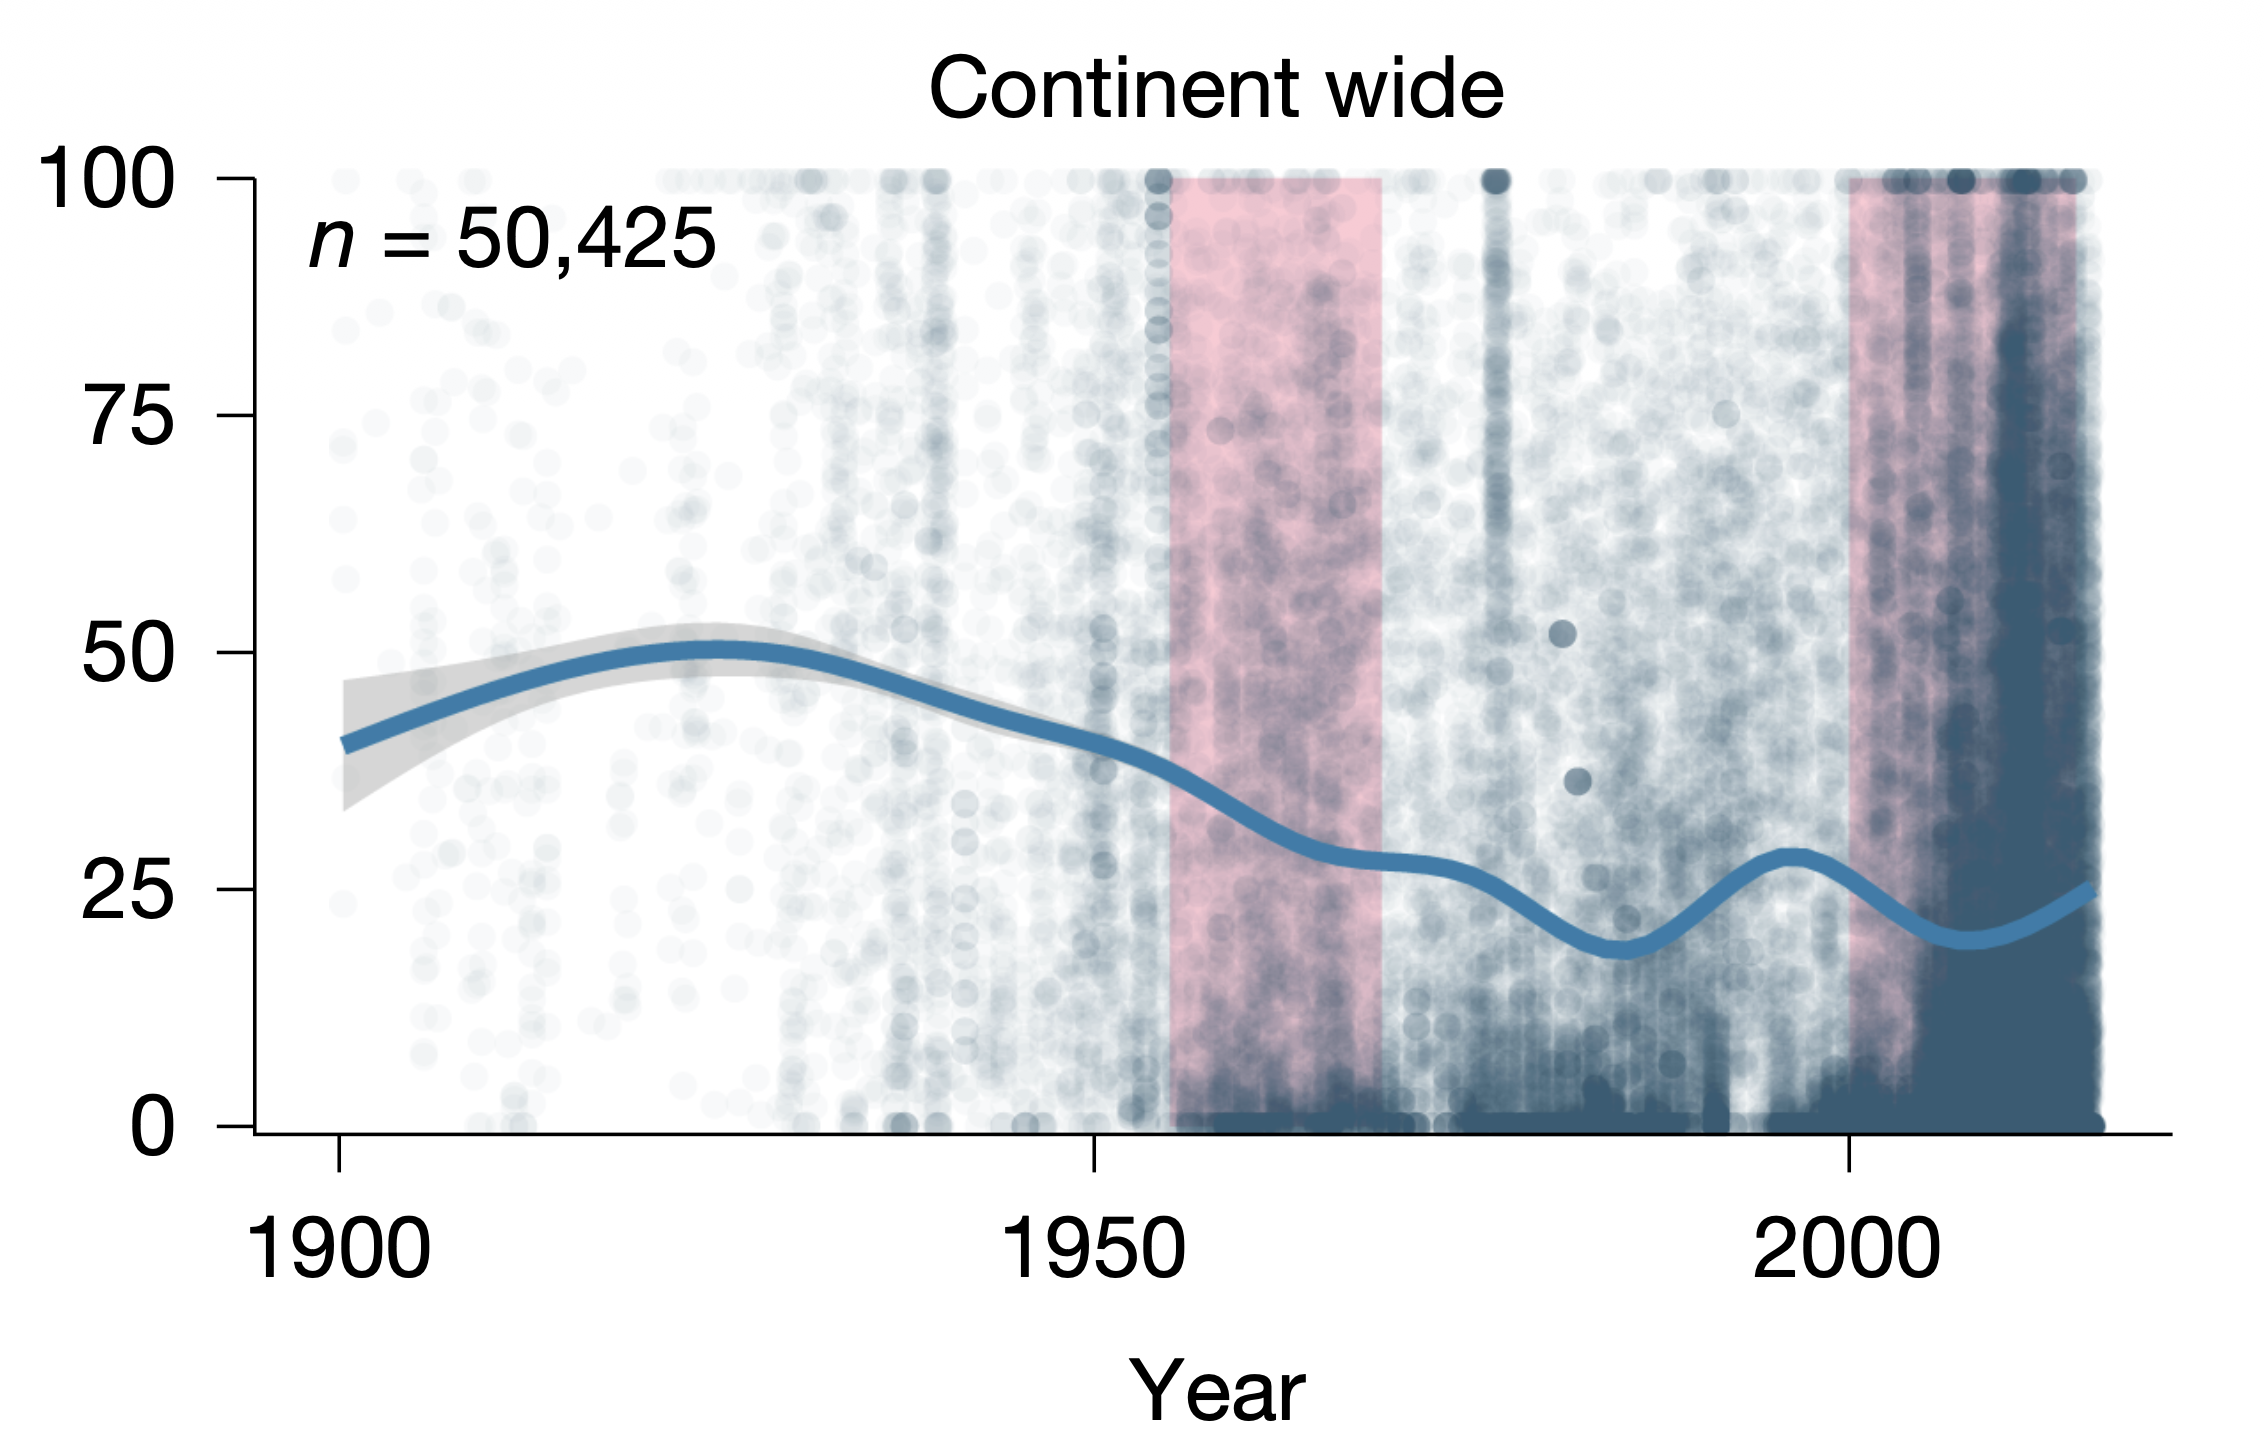
The percentage of children between two to 10 years old who tested positive for the parasite that causes malaria between 1990 and 2016. Source: Carlson et al. (2026)

Attribution

The authors use the blood test survey data to develop a statistical model separating out the climatic, social and economic factors that affect malaria, such as temperature, rainfall, economic development, healthcare and population changes. This allows the authors to isolate the effects of the climate on malaria.

They find that malaria prevalence in children peaks when average monthly temperatures reach 24.9C, dropping off in warmer and cooler climates.

Mosquitoes also need stagnant or slow-moving water in which to lay their eggs. The authors find that periods of drought tend to decrease malaria prevalence one-to-two months later, whereas floods increase prevalence two-to-three months later. However, they conclude that rainfall is “less important than temperature” in predicting malaria rates.

They then combine the statistical models with climate models, to simulate childhood malaria rates in a range of past and future climates.

First, the authors simulate malaria rates in the present day, by running the models using the climate of 2000-14. They then carry out the same analysis, using the climate of a hypothetical world without human-caused climate change.

By comparing the two, the authors were able to attribute the impact of climate change on malaria rates across Africa.

The link between climate change and malaria in Africa is complex and “surprisingly contentious”, according to the authors. For example, they write that “malaria resurgence in the east African highlands became a particular point of contention, with over a dozen studies arguing for or against climate change as a substantial driver”.

It adds:

“Today, malaria experts generally agree that climate change has contributed to elevational shifts in malaria epidemics and the geographical ranges of mosquito vectors. However, the cumulative effect of climate change on the burden of malaria is still an open question.”

Lead author Carlson says this paper is “one of the first impact attributions on infectious disease” and the first attribution study on climate change and malaria. He adds:

“I think it’s the most clarity we’ve had on the malaria question.”

Dr Teresa Yamana, an associate research scientist at Columbia University, who was not involved in the study, praises its “rigorous” methodology. She tells Carbon Brief that the work “demonstrates the potential of climate attribution methods to quantify the impacts of climate change on infectious diseases”.

Warming world

The findings show that “climate change isn’t just making malaria worse or better – it’s moving it, says study author Prof Tamma Carleton, an assistant professor at UC Berkeley:

“Whether a place sees elevated malaria risks or reduced burdens under climate change depends on how hot it is today. We see relief in the hotspots and new risk nearly everywhere else.”

For example, in the Ethiopian highlands, low temperatures – which are unsuitable for mosquitoes to live and breed – have historically limited the spread of malaria. However, the region has seen childhood malaria rates increase by more than eight cases per 1,000 children since the year 1900 as rising temperatures have allowed the insects to expand their habitat.

The authors also found a similar increase in malaria prevalence in cooler southern African countries.

In contrast, global warming is pushing average temperatures above the ideal range for mosquitoes in many hotter parts of Africa, driving down malaria rates. The authors find that in western Africa, climate change has caused a reduction of four malaria cases per 1,000 children per year by 2014, reducing prevalence by 1-2%.

Overall, climate change has resulted in one extra case of malaria for every 1,000 children in sub-Saharan Africa since the year 1900, the study says.

The authors also run their models for three future climate scenarios: low (SSP1-2.6), intermediate (SSP2-4.5) and very-high (SSP5-8.5) emissions pathways. Comparing these to the present-day model results shows how climate change could affect malaria cases over the coming century.

They find that the trends observed so far will largely continue into the future – meaning climate change will lower the prevalence of malaria in warm regions and increase the prevalence in cool regions.

The study concludes that under the intermediate scenario, which is broadly in line with current climate policies, warming will drive down childhood malaria cases by about three cases per 1,000 children in central Africa and 16 cases per 1,000 children in west Africa by the end of the century.

By contrast, cases could increase by around 20% over the same period in regions such as the Rift Valley and coastal southern Africa – a rise of 30 cases per 1,000 children.

The maps below show changes in childhood malaria prevalence due to climate change in today’s climate (left) and the climate of 2096-2100 under the intermediate scenario (right).

Red indicates an increase in malaria prevalence and blue indicates a decrease. Greyer colours indicate greater uncertainty in the model results. White indicates regions where no data was collected.

Carlson tells Carbon Brief that this is “the first study to really confidently answer the highland East Africa debate”.

Eradicating malaria

Healthcare workers, governments and scientists have been working to eliminate malaria for decades.

On average, the authors find that climate change will reduce the prevalence of malaria in sub-Saharan Africa, as temperatures rise above the optimum range for mosquitoes. This effect is more pronounced at higher warming levels.

Under the low emissions scenario, about 1 case per 1,000 children will be averted by the end of the century. Meanwhile under the highest emissions scenario, average prevalence falls by 20 cases per 1,000 children, marking a 9% reduction.

The graph below shows childhood malaria rates over 1990-2024 in the historical climate (blue) and in a world without climate change (grey). These estimates are shown relative to baseline prevalence across 1901-30.

After the year 2014, the plot shows projected future changes in malaria prevalence, relative to a 2015-20 baseline, in the low (purple), intermediate (pink) and high (green) scenarios.
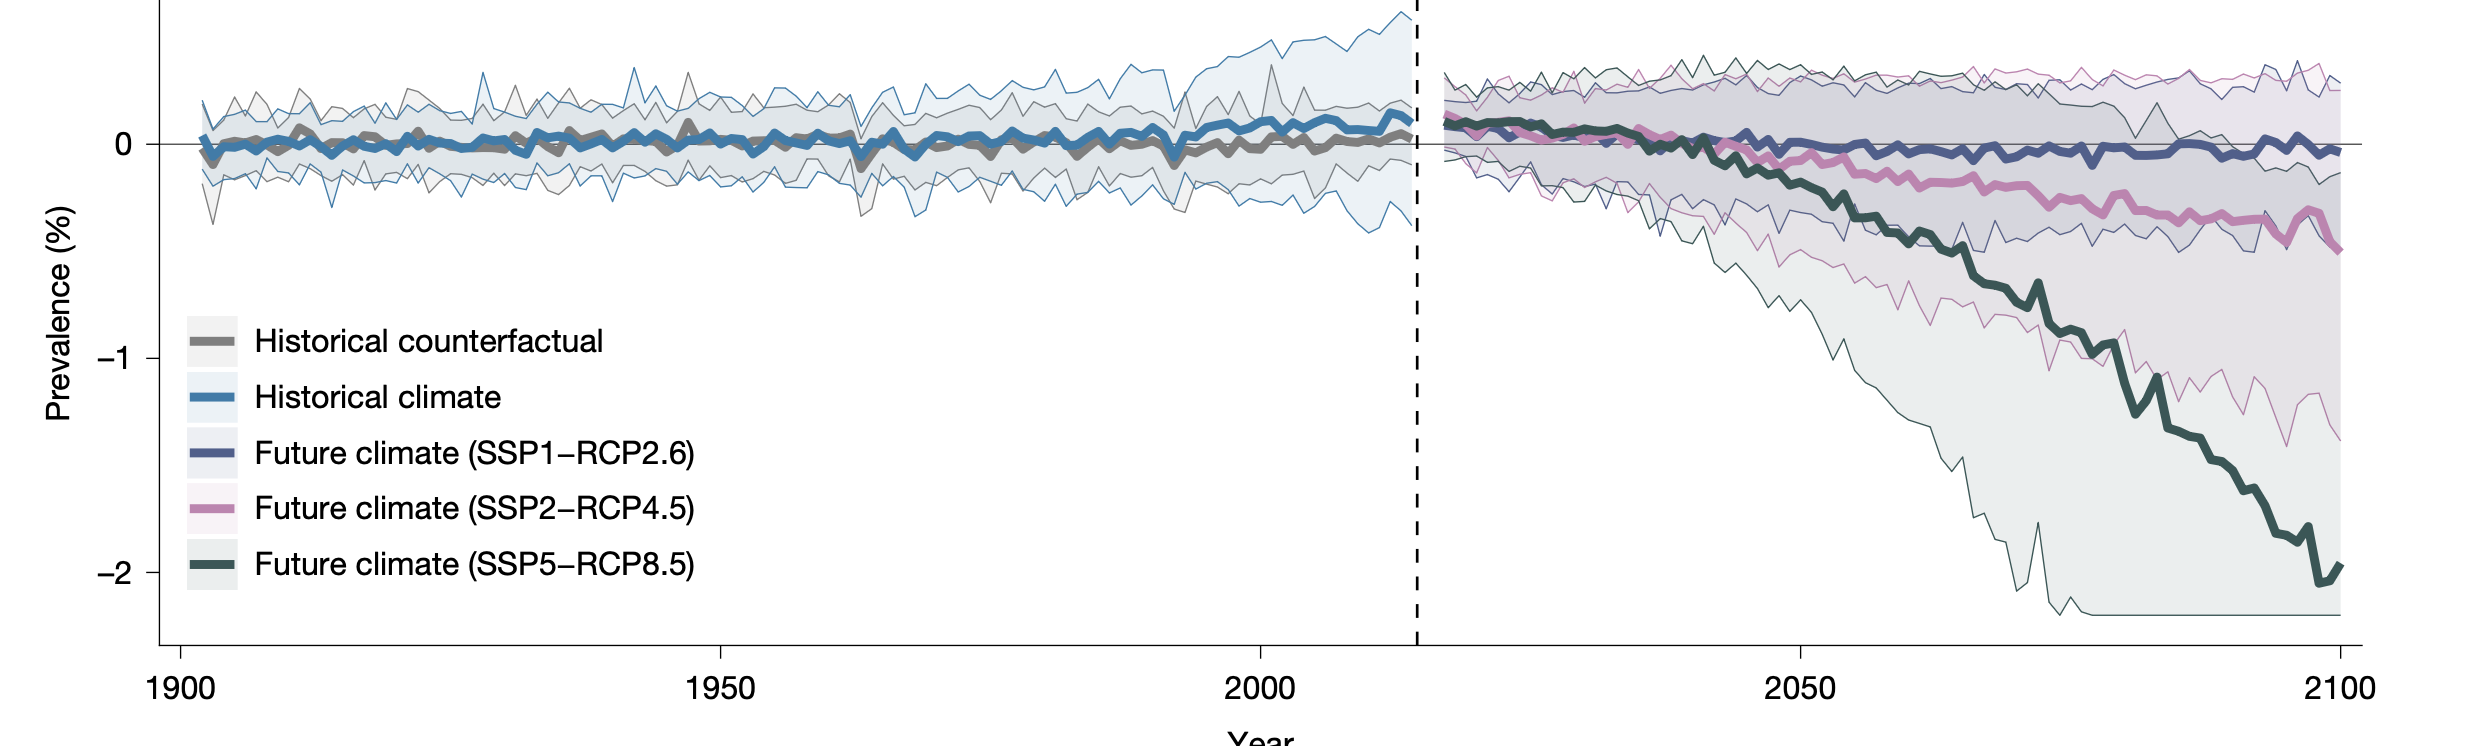
Malaria prevalence in the historical climate (blue), historical climate without global warming (grey), low emissions scenario (purple), intermediate emissions scenario (pink) and very-high emissions scenario (green). Source: Carlson et al. (2026)

Carlson emphasises that this does not mean that climate change is “good news” for healthcare in sub-Saharan Africa. He explains that climate change will bring a wide range of negative health impacts that will strain healthcare systems, adding:

“A world that is too hot for malaria is not a good world for the health of children.”

He also notes that climate change is “not the primary driving factor of malaria dynamics”. For example, he notes that malaria prevalence fell over 2000-15, by about 16 percentage points, after the disease was identified as a “critical global target of the Millennium Development Goals”.

This reduction is 200 times greater than the increase seen so far because of climate change, Carlson says. He adds:

“It would not be tremendously hard both to keep malaria out of new places and to eliminate it where it is maybe going to get a little bit of an assist from climate change.”

Dr Adugna Woyessa is a senior researcher at the Ethiopian Public Health Institute and was not involved in the study. He has previously carried out research on malaria in eastern Africa.

Woyessa praises the study, telling Carbon Brief that the research could bring about a “paradigm shift” in efforts to eliminate malaria. He argues that the study is a “tool for engaging giant development partners”, adding that “future work will be needed to situate these global trends in local contexts”.

Dr Janey Messina is an associate professor in the school of geography and the environment at the University of Oxford and was also not involved in the study. She praises the paper’s “strong” method.

However, she cautions that the findings “should not be interpreted as forecasts of total future malaria burden”, because they only model the impact of climate change on malaria, while excluding “social, demographic and public-health determinants”, such as inequality, migration, conflict and changing access to malaria interventions.

She adds:

“One of the paper’s most important messages is this: effective surveillance, prevention and treatment remain substantially more influential – and more actionable – than climate change alone.”

Carlson, C. et al. (2026) The past and future impact of climate change on childhood malaria in Africa, Nature, doi:10.1038/s41586-026-10840-w

The post Climate change is driving a ‘shift’ in childhood malaria risk across Africa appeared first on Carbon Brief.

Climate change is driving a ‘shift’ in childhood malaria risk across Africa

Continue Reading

Climate Change

Every country needs a model to help optimise its energy transition

Published

on

Claver Gatete is Executive Secretary of the UN Economic Commission for Africa. Jason Veysey is Energy Modeling Program Director and Senior Scientist at the Stockholm Environment Institute. Lisa Sachs is Director of the Columbia Center on Sustainable Investment at Columbia University.

The case for global energy transition has rarely been clearer. The closure of the Strait of Hormuz earlier this year exposed the cost of unplanned, fossil-dependent systems, while the falling cost of renewables, the rising penetration of electric vehicles, and the growing value of demand flexibility have made the direction of travel obvious. The benefits of a clean, secure, integrated system are no longer in dispute. What remains unclear is how to build it.

Countries around the world have called for faster renewable energy deployment and alternative energy arrangements. A secure, affordable, resilient, decarbonised system requires specific investments in specific places in a specific sequence, optimised across sectors and borders. But very few governments have the analytical foundation to translate those imperatives into investment.

The two instruments that are supposed to determine investment priorities for decarbonisation – Nationally Determined Contributions (NDCs) and country platforms – cannot answer the most basic question facing any country undertaking an energy transition: what should the energy system look like?

    To close this gap, every country needs a bankable, economy-wide optimisation model for its energy system. A model is not a plan, but it can help answer the critical question of what the future energy system should look like. It shows how optimal scenarios vary as assumptions and policies are adjusted, calculates investment requirements and sequencing, and quantifies how system costs are affected by assumptions, policies, and exogenous variables like trade policy and financing terms.

    Tool for efficient investment

    Optimisation is a simplified way of simulating an energy system, but it can be an extremely powerful tool for moving energy planning from reactive (how do we manage the disparate actions in the energy system?) to intentional (what energy system underpins our national objectives?). A model can show how optimal scenarios vary as assumptions and policies are adjusted, and how investment requirements are quantified and sequenced.

    Optimisation models can treat the energy system and the sectors it serves as an integrated whole, optimising across sectors and projects in ways that can be mutually reinforcing. If considered independently, growth in industrial demand, transport electrification, and digital infrastructure can add stress to the energy system. But an optimised plan can arrange these and other changes in an efficient, synergistic way.

    Two to tango: How governments can unlock private investment for national climate goals

    New load can be added where low-cost power is available; industrial customers can ensure the viability of investments in energy supply; electric vehicle charging policy can smooth load curves and reduce costs for all consumers.

    Additionally, optimisation modeling can also change the financeability of investments. Taken alone, each project faces uncertainty about the rest of the system, which raises the cost of capital and causes projects to stall or unwind after contracts are signed. A coherent, optimised plan makes visible the coordination that private capital would otherwise have to bet on: identified offtake, sequenced and committed transmission, contracted power supply, and so on.

    What COP31 and COP32 should do

    The upcoming COPs in Turkey and Ethiopia can shift the center of gravity of international climate cooperation from fragmented commitments to planning. Three moves are urgently needed.

    First, optimised, economy-wide, long-term energy system planning must be the foundation on which any meaningful NDC, country platform, or finance commitment rests. NDCs are typically drafted by environment or single-line ministries, with limited cross-sectoral input from ministries of energy, finance, and planning. They contain targets, derived from sectoral strategies or national commitments, not from an analytically grounded picture of what the energy system should look like and what investments would make it work. Country platforms are generally a portfolio of investments assembled from existing project pipelines, rather than derived from a system-level analysis of what an optimised, decarbonised energy system would require.

    Second, recognise regions as a key planning unit. Modern integrated energy systems are inherently regional. Renewable endowments are unevenly distributed; balancing variable supply across borders lowers aggregate cost, reduces redundant backup capacity, and unlocks economies of scale no individual nation can achieve. Many energy investments in Southeast Asia, East Africa, Southern Africa and Central Asia may only be financeable in a regional context. Assessing domestic infrastructure without regional optimisation perpetuates the perception that decarbonisation is more expensive than it is.

    COP31 leaders unveil global targets, with spotlight on electrification

    Third, finance the planning capacity. A coordinated commitment by multilateral development banks, bilateral donors, and philanthropic partners to help every region and its constituent countries develop and maintain their own modelling capability, with open-source tools and regional analytical hubs, would close the most consequential gap in the current architecture. The cost is small relative to current spending on country platforms, failed project preparation, and misallocated infrastructure investment.

    This includes supporting regional institutions such as the ASEAN Centre for Energy, the African Energy Commission, regional power pools, and the Latin American and Caribbean Energy Organization to determine what optimised regional systems require. Country-by-country pledging, repeated at every COP, will not deliver what meaningfully integrated systems can.

    The 2026 energy crisis made the cost of unplanned, fossil-dependent systems newly visible. That window of clarity will close. The international community should seize the moment to build the planning foundation that has been missing for thirty years, rather than commissioning another round of NDCs or pledges, striving for outcomes neither was designed to deliver.

    The post Every country needs a model to help optimise its energy transition appeared first on Climate Home News.

    Every country needs a model to help optimise its energy transition

    Continue Reading

    Climate Change

    Explainer: How the ‘super El Niño’ will reshape the world’s weather

    Published

    on

    The world is currently experiencing what is expected to become the strongest El Niño on record – dubbed a “super El Niño” by many.

    El Niño is the warm phase of a recurring climate pattern in the tropical Pacific that releases heat from the ocean into the atmosphere.

    This temporarily raises global temperatures and reshapes rainfall and extreme weather around the world – impacting the lives of billions of people.

    The current El Niño event began in June and is expected to last into 2027.

    El Niño is part of a wider climate pattern called the El Niño-Southern Oscillation (ENSO) cycle.

    The ENSO cycle also has a cool phase, known as La Niña, as well as a “neutral” phase. El Niño and La Niña events typically last between nine and 12 months, but can go on longer.

    Below, Carbon Brief explains how the ENSO cycle works, its impacts on extreme weather and global temperatures and why this El Niño event is projected to be the most intense since records began.

    The post Explainer: How the ‘super El Niño’ will reshape the world’s weather appeared first on Carbon Brief.

    https://interactive.carbonbrief.org/el-nino-explainer/index.html

    Continue Reading

    Climate Change

    Analysis: The two largest reservoirs in the US have hit record-low levels

    Published

    on

    The second-largest reservoir in the US reached a record-low water height on Saturday – just days after the country’s largest reservoir broke its own record. 

    Both Lake Mead and Lake Powell are located on the Colorado River.

    They provide water for populations across seven US states in the south-western US, with around 40 million people getting some or all of their municipal water from the Colorado River.

    The river also provides water for around 5.5m acres (22,258 square kilometres) of farmland across Colorado, Arizona, California and the other states in the river basin.

    Experts tell Carbon Brief that climate change, population growth and over-consumption are all contributing to the current record-low levels of the reservoirs.

    Record lows

    At full capacity, Lakes Mead and Powell can hold a combined 68 cubic kilometres of water – enough to supply all household consumption in the contiguous US for nearly 1.5 years. However, the water level in both reservoirs has been declining for decades.

    The chart below shows the water level of Lake Mead, in metres above mean sea level. The reservoir, which began to fill in 1935 following the construction of the Hoover Dam, has a “full pool” maximum capacity of 347.60 metres. The water level in Lake Mead reached a record low of 317.11 metres on 7 August.

    Lake Mead, the larges reservoir in the US, reached record-low water levels in early August.

    The following chart shows the water level of Lake Powell, in metres above mean sea level. Lake Powell’s full-pool level is 1,127.76 metres.

    While the reservoir reached its maximum capacity several times in the 1980s, it has not done so since. On 15 August, the water level in Lake Powell was recorded at a new record-low of 1,072.87 metres.

    Lake Powell, the second-largest reservoir in the US, reached record-low water levels in mid-August

    Both reservoirs have continued to decline in the days since breaking their respective records. The downward trend will largely continue in both lakes until next spring, when the snowpack in the mountains of the Upper Colorado River Basin begins to melt, says Dr Jack Schmidt, a senior research scientist at Utah State University’s Center for Colorado River Studies. He tells Carbon Brief:

    “The big dilemma of the moment is that we’re only in the middle of August, and we have no assurance of what the coming winter will be. The only thing we can be sure of is that we will be depleting overall total basin reservoir storage from now until, roughly, early April.”

    Compounding factors

    The record lows across the two reservoirs are the result of several compounding factors, experts tell Carbon Brief.

    Since the turn of the 20th century, the amount of water flowing along the Upper Colorado River has declined by about 20%. Research suggests that half of this decline can be attributed to human-induced climate change.

    Most of the river’s streamflow comes from the snowpack of the Upper Colorado River Basin, which stretches across five western US states but is primarily located in Colorado and Utah.

    This region has been gripped by a historic “megadrought” for more than a quarter of a century. Nearly half of the megadrought’s intensity over 2000-18 is attributable to climate change, according to a 2020 study.

    At the same time, the increasing population in the US south-west has put added pressure on the Colorado River’s water supply. The number of people obtaining some or all of their water from the Colorado system has grown by 15 million (around 60%) since 1992.

    Schmidt tells Carbon Brief:

    “There’s an ultimate cause of the present water crisis, and there’s a proximate cause. The ultimate cause is a warming climate, a warming planet and a pretty clear correlation between warming conditions and decreased runoff in the Colorado River Basin.

    “The proximate cause is that in this messy democratic republic of ours, big policy decisions that match the variability of the climate occur painfully slowly – with intense political negotiations – and only incrementally.”

    On 31 July, the US Bureau of Reclamation, which manages water resources in the western US, released an environmental impact statement on its proposed post-2026 strategy for managing Lakes Powell and Mead. The strategy itself has not been released yet.

    Schmidt notes that the statement does appear to give the Bureau flexibility to “respond to crisis” by reducing the delivery of water to several states. However, he adds:

    “They acknowledge it won’t work if we just stay critically dry, and of course every climate model for the 21st century, especially with a continually warming planet, says that that’s exactly what’s going to happen.”

    The post Analysis: The two largest reservoirs in the US have hit record-low levels appeared first on Carbon Brief.

    Analysis: The two largest reservoirs in the US have hit record-low levels

    Continue Reading

    Trending

    Copyright © 2022 BreakingClimateChange.com