
This year is shaping up to either match or surpass 2023 as the hottest year on record.
Global temperatures have been exceptionally high over the past three months – at around 1.6C above pre-industrial levels – following the peak of current El Niño event at the start of 2024.
The past 10 months have all set new all-time monthly temperature records, though the margin by which new records have been set has fallen from around 0.3C last year to 0.1C over the first three months of 2024.
April 2024 is on track to extend this streak to 11 record months in a row.
The first quarter of this year has seen record-high global temperatures across vast swathes of the planet, including in the tropical Atlantic and western Pacific oceans, much of South America, Central Africa, the Mediterranean and the Indian Ocean.
Based on the year so far and the current El Niño forecast, Carbon Brief estimates that global temperatures in 2024 are likely to average out at around 1.5C above pre-industrial levels.
Although precise predictions are difficult so early in the year, Carbon Brief’s projection suggests that 2024 is virtually certain to be either the warmest or second-warmest year on record.
Global temperatures continue setting records
The first three months of 2024 have each set a new record, buoyed by the peak of El Niño conditions in the tropical Pacific.
This short-term natural variability builds on top of the roughly 1.3C warming that has occurred since the mid-1800s due to human emissions of CO2 and other greenhouse gases.
The figure below shows how global temperature so far in 2024 (purple line) compares to each month in different years since 1940 (with lines coloured by the decade in which they occurred) in the Copernicus/ECMWF ERA5 surface temperature dataset.

Temperatures for each month from 1940 to 2024 from Copernicus/ECMWF ERA5. Anomalies plotted with respect to a 1850-1900 baseline. Chart by Carbon Brief.
Every month from June 2023 onward – 10 months in a row – have set a clear record. The past three months have each been around 0.1C warmer than the prior record set during the 2016 super El Niño event.
In this latest quarterly state of the climate assessment, Carbon Brief analyses records from five different research groups that report global surface temperature records: NASA, NOAA, Met Office Hadley Centre/UEA, Berkeley Earth and Copernicus/ECMWF.
The figure below shows the annual temperatures from each of these groups since 1970, along with the average over the first three months of 2024. (Note: at the time of writing, March data was not yet available for the Hadley/UEA record.)

Annual global mean surface temperatures from NASA GISTEMP, NOAA GlobalTemp, Hadley/UEA HadCRUT5, Berkeley Earth and Copernicus/ECMWF (lines), along with 2024 temperatures so far (January-March, coloured dots). Anomalies plotted with respect to the 1981-2010 period, and shown relative to pre-industrial based on the average pre-industrial temperatures in the Hadley/UEA, NOAA and Berkeley datasets that extend back to 1850. Chart by Carbon Brief.
The globe, as a whole, has warmed around 1C since 1970, with strong agreement between different global temperature records. However, there are larger differences between temperature records further back in time (particularly pre-1900) due to sparser observations and a resulting greater sensitivity to how gaps between measurements are filled in.
All show that the average global temperature for 2024 so far is higher than any prior annual record. However, the first quarter of 2024 is unlikely to end up being representative of the year as a whole due to the fading of El Niño conditions and the expectation of a developing La Niña event later in the year.
Record global daily temperatures
The figure below shows daily temperature data from the Copernicus/ECMWF ERA5 record for 2024 (purple line), 2023 (red line) and 1940-2022 (grey lines).
It highlights that April 2024 is on track to continue the streak of record warm months, with most of the individual days of the month so far setting a new daily record for the time of year.

Daily global temperatures from 1940 to present (20 April 2024) from Copernicus/ECMWF ERA5, with daily values for each year plotted as a separate line. The colours indicate 2024 (purple), 2023 (red) and all other years (grey). Anomalies plotted with respect to a 1850-1900 baseline. Chart by Carbon Brief.
The chart below shows an alternative visualisation, with daily temperatures shown by colours ranging from blue (-2C) to red (+2C), with the pre-industrial average (1850-1900) set to 0C. The figure below shows each day since 1940 in the Copernicus/ECMWF ERA5 dataset.

It is notable that almost every day over the past 50 years has seen temperatures higher than pre-industrial levels, with both 2023 and 2024 so far showing up as particularly warm compared to any prior years in the record.
El Niño boosting human-caused warming
Global temperatures have been buoyed in recent months by a strong El Niño event. However, this event has peaked and is expected to transition into La Niña conditions in the latter part of the year.
The figure below shows a range of different forecast models for the El Niño-Southern Oscillation (ENSO) for the rest of this year, produced by different scientific groups. The values shown are sea surface temperature variations in the tropical Pacific – the El Niño 3.4 region – for overlapping three-month periods.

Virtually all models expect El Niño conditions to fade rapidly and be replaced by La Niña conditions by late summer. Most models project a moderate La Niña (<-0.5C Niño 3.4 sea surface temperature – SST – anomaly) to develop by the end of the year.
Early predictions for a warm 2024
Historically, the highest global surface temperatures have occurred after an El Niño has peaked at the start of the year.
This happened in both of the last two major El Niño events, in 1998 and 2016, which were notably warmer than the prior years (1997 and 2015) during which their respective El Niño events developed.
However, 2023 was highly unusual. It showed global temperatures more akin to what we would expect after El Niño peaks, rather than while it is still developing.
Annual temperatures ended up well outside of the range that all of the different scientific groups projected at the start of the year. There is still no agreed explanation for the extreme warmth, particularly in the latter half of the year.
The figure below shows the record margin (red bars) – the amount that global average temperatures surpassed the prior monthly temperature record – in each month of over the past year.
Summer and autumn 2023 saw records being set by large margins: 0.5C in September, 0.4C in October and 0.3C in July, August, November and December.

Margin by which new monthly temperature records have been set over the past 12 months. Using data from Copernicus/ECMWF ERA5. Chart by Carbon Brief.
The past three months have seen new records set by only around 0.1C. The prior records for January, February, and March were set in 2016, and given the rate of warming since then we would expect new records to be set by about 0.1C in the year after El Niño peaks. If this year follows the trajectory of 2016, we would expect global temperatures to start falling over the coming months.
However, the fact that the exceptional warmth of 2023 remains largely unexplained raises questions about whether the past will be a good guide for what 2024 has in store. If the latter half of 2024 ends up similar to 2023, there is a worry that we might be entering what has been described as “uncharted territory” for the climate.
As NASA’s Dr Gavin Schmidt noted in a recent Nature commentary:
“If the anomaly does not stabilise by August – a reasonable expectation based on previous El Niño events – then the world will be in uncharted territory. It could imply that a warming planet is already fundamentally altering how the climate system operates, much sooner than scientists had anticipated. It could also mean that statistical inferences based on past events are less reliable than we thought, adding more uncertainty to seasonal predictions of droughts and rainfall patterns.”
By looking at the relationship between the first three months and the annual temperatures for every year since 1970 – as well as ENSO conditions for the first three months of the year and the projected development of El Niño conditions for the remaining nine months – Carbon Brief has created a projection of what the final global average temperature for 2024 will likely turn out to be.
The analysis includes the estimated uncertainty in 2024 outcomes, given that temperatures from only the first quarter of the year are available so far. The chart below shows the expected range of 2024 temperatures using the Copernicus/ECMWF global atmospheric reanalysis product (ERA5) – including a best-estimate (red) and year-to-date value (yellow). Temperatures are shown with respect to the pre-industrial baseline period (1850-1900).

Annual global average surface temperature anomalies from the Copernicus/ECMWF global atmospheric reanalysis product (ERA5) plotted with respect to a 1850-1900 baseline. To-date 2024 values include January-March. The estimated 2024 annual value is based on the relationship between the January-March temperatures and annual temperatures between 1970 and 2023. Chart by Carbon Brief.
Carbon Brief’s projection suggests that 2024 is virtually certain to be either the warmest or second- warmest year on record, with a central estimate just above 1.5C, slightly higher than 2023. However, this model assumes that 2024 follows the type of climate patterns we have seen in the past – patterns that were notably broken in 2023.
It is worth repeating that an individual year hitting 1.5C above pre-industrial levels is not equivalent to the 1.5C limit within the Paris Agreement. This limit refers to long-term warming, rather than an individual year that includes the short-term influence of natural fluctuations in the climate, such as El Niño.
The figure below shows Carbon Brief’s estimate of 2024 temperatures using ERA5, both at the beginning of the year and once each month’s data has come in. While the central estimates have remained relatively unchanged, the uncertainty has diminished with each additional month of data.

Carbon Brief’s projection of global temperatures at the start of the year, and after January, February, and March ERA5 data became available.
Record warmth over large parts of the globe
While global average surface temperature changes are an important indicator of long-term climate change, any month or year will have important regional warm or cool patterns in different parts of the world.
The first three months of 2024 saw particularly warm temperatures over the tropical Atlantic and western Pacific oceans, much of South America, Central Africa, the Mediterranean and the Indian Ocean.
The figure below shows the difference between temperatures in the first three months of 2024 and the baseline period of 1951-80, taken from Berkeley Earth (using their high-resolution temperature dataset). Red, orange and yellow shading indicate areas that have been warmer than average, while blue shows areas that have been cooler.

The figure below shows which portions of the Earth’s surface experienced record high temperatures (deep red shading) for the first three months of 2024. It is noteworthy that no location on the planet experienced record cold temperatures over the first quarter of the year.
Sea ice at the low end of the historical range
Arctic sea ice extent spent much of early 2024 at the low end of the historical 1979-2010 range, and set a few new record-low values for individual days in February and March.
Since northern hemisphere winter conditions remain cold enough to refreeze sea ice, there tends to be less variability in extent year-to-year in the winter than in the summer.
Following an all-time low maximum in September 2023, Antarctic sea ice has been tracking at near-record-low extent for the past six months. In late February, it hit its minimum extent for the year, tying with 2022 for the second-lowest Antarctic minimum in the satellite record.
The figure below shows both Arctic and Antarctic sea ice extent in 2024 (solid red and blue lines), the historical range in the record between 1979 and 2010 (shaded areas) and the record lows (dotted black line). Unlike global temperature records (which only report monthly averages), sea ice data is collected and updated on a daily basis, allowing sea ice extent to be viewed up to the present.

Arctic and Antarctic daily sea ice extent from the US National Snow and Ice Data Center. The bold lines show daily 2024 values, the shaded area indicates the two standard deviation range in historical values between 1979 and 2010. The dotted black lines show the record lows for each pole. Chart by Carbon Brief.
However, sea ice extent only tells part of the story. In addition to declining ice extent, the sea ice that remains tends to be younger and thinner than ice that used to cover the region.
The figure below, using data from the Pan-Arctic Ice Ocean Modelling and Assimilation System (PIOMAS), shows the Arctic sea ice thickness for every year between 1979 and 2024.

While sea ice volume has been flat or slightly increasing over the past five years, there has been a clear downward trend in sea ice volume since the start of the satellite record in the late 1970s.


The post State of the climate: 2024 off to a record-warm start appeared first on Carbon Brief.
Climate Change
‘Ride the wave of momentum’: Australia announces once-in-a-decade Marine Parks Network review
In response to the federal government announcing its once-in-a-decade review of Australia’s Marine Parks Network, the following lines can be attributed to Elle Lawless, Senior Campaigner at Greenpeace Australia Pacific:
“Greenpeace Australia Pacific welcomes today’s announcement that the Albanese Government will review Australia’s Commonwealth Marine Parks Network. This is a rare, once-in-a-decade opportunity to strengthen our marine parks and ban industrial fishing in Australia’s marine protected areas.
“Australians would be appalled to know that more than half of Australia’s Marine Parks Network currently allows for extractive industries, like longlining, bottom trawling and oil and gas mining. These so-called ‘protected’ areas were designed to safeguard our beloved ocean wildlife and underwater ecosystems – that is what Australians expect. Damaging industrial industries should not be given a free pass to trawl, fish, drill or extract from our marine parks.”
“With the first Ocean COP just around the corner, and off the back of Australia’s move to ratify the Global Ocean Treaty earlier this year, the Australian government has a unique opportunity to ride the wave of this momentum and solidify itself as a true global ocean leader.
“Greenpeace Australia Pacific is calling for industrial activities to be banned from our protected waters and for at least 30% of Australia’s ocean to be protected as ocean sanctuaries. This review presents a rare opportunity to create more ocean sanctuaries, true blue havens where ocean life can recover, thrive and repopulate the surrounding waters.”
—ENDS—
‘Ride the wave of momentum’: Australia announces once-in-a-decade Marine Parks Network review
In recent days, prominent climate sceptics and rightwing commentators have shared charts on social media incorrectly implying that Europe is having its “quietest” year for wildfires in 2026.
These include Dr Matthew Wielicki, a former University of Alabama geochemist and self-described “professor in exile”, who was recently appointed by the Trump administration to lead the US Global Change Research Program.
However, these charts paint a misleading picture as they are skewed by encompassing the entirety of Russia in the data – including the vast plains of Siberia.
These charts also use data that include fires that are deliberately lit to manage cropland, which is a declining practice across much of Europe.
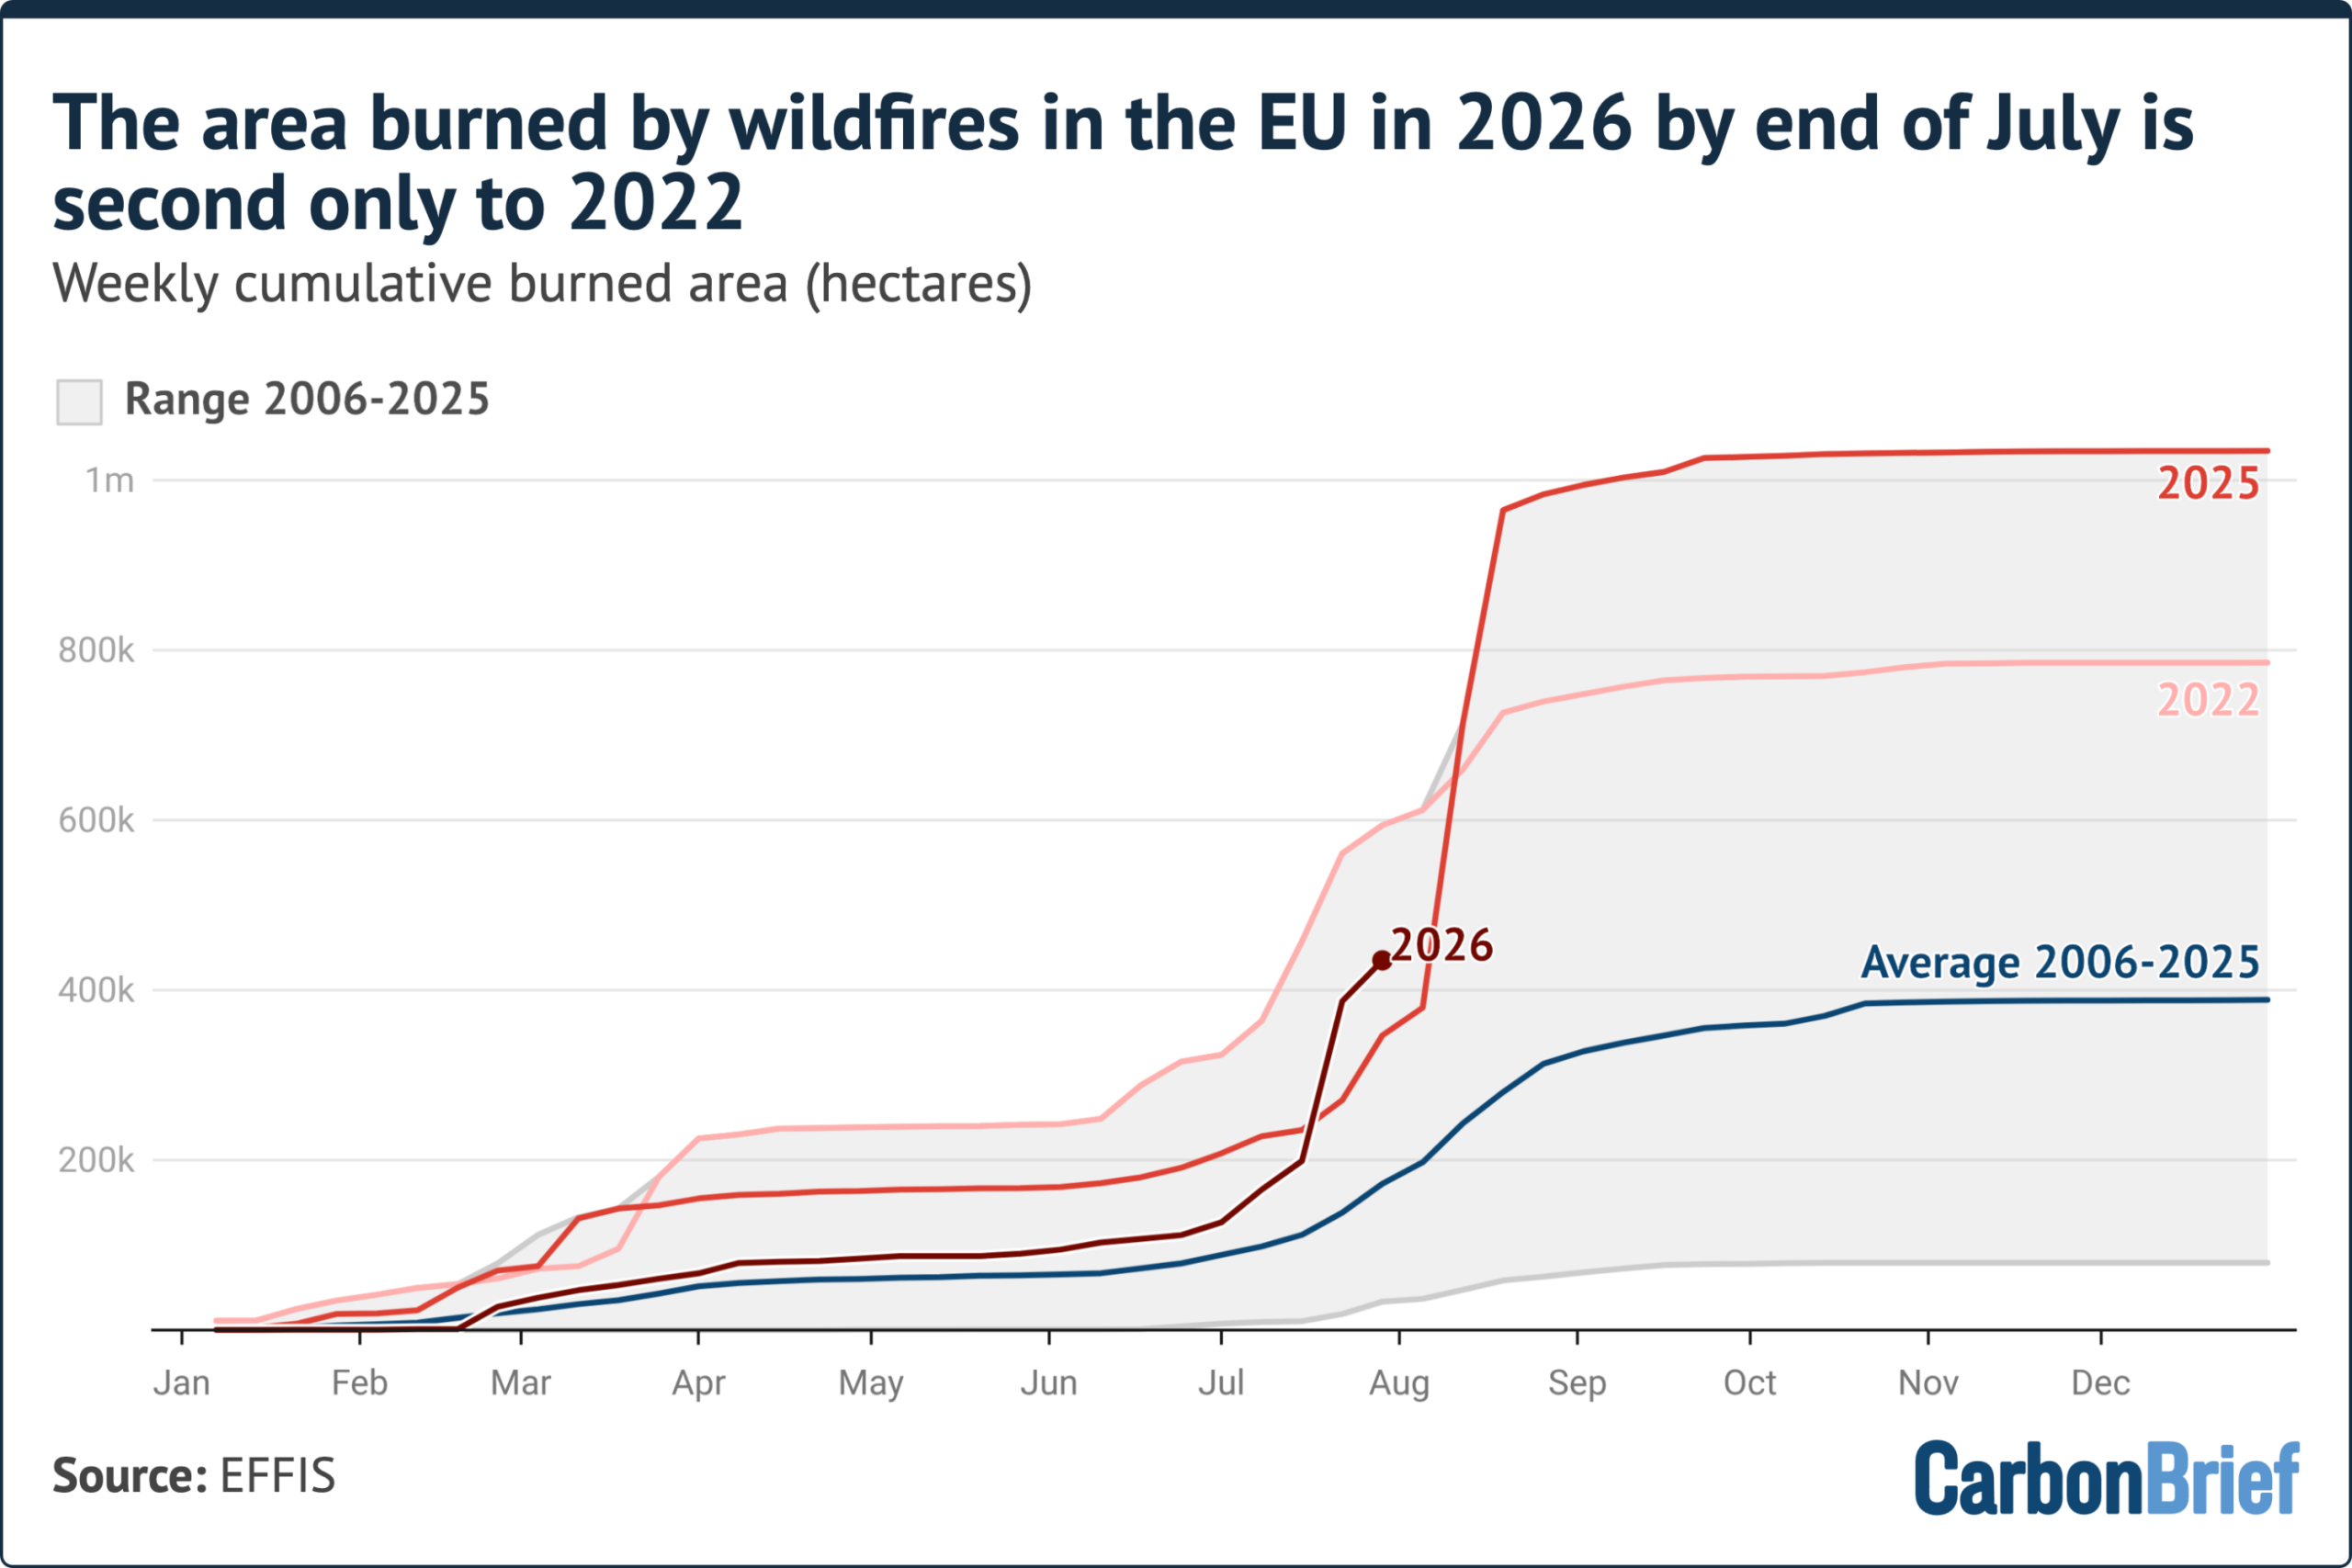
In this factcheck, Carbon Brief shows that the area burned by wildfires across the European Union in 2026 is second only to 2022 for this time of year.
The latest data from the European Forest Fire Information System (EFFIS) also shows that France has set a new modern record for area burned and Spain’s wildfire season is among the worst on record.
The fires have displaced more than a third of a million people across south-western Europe, while an impending heatwave has also raised fears of the fires worsening in the coming days.
‘Quietest year’
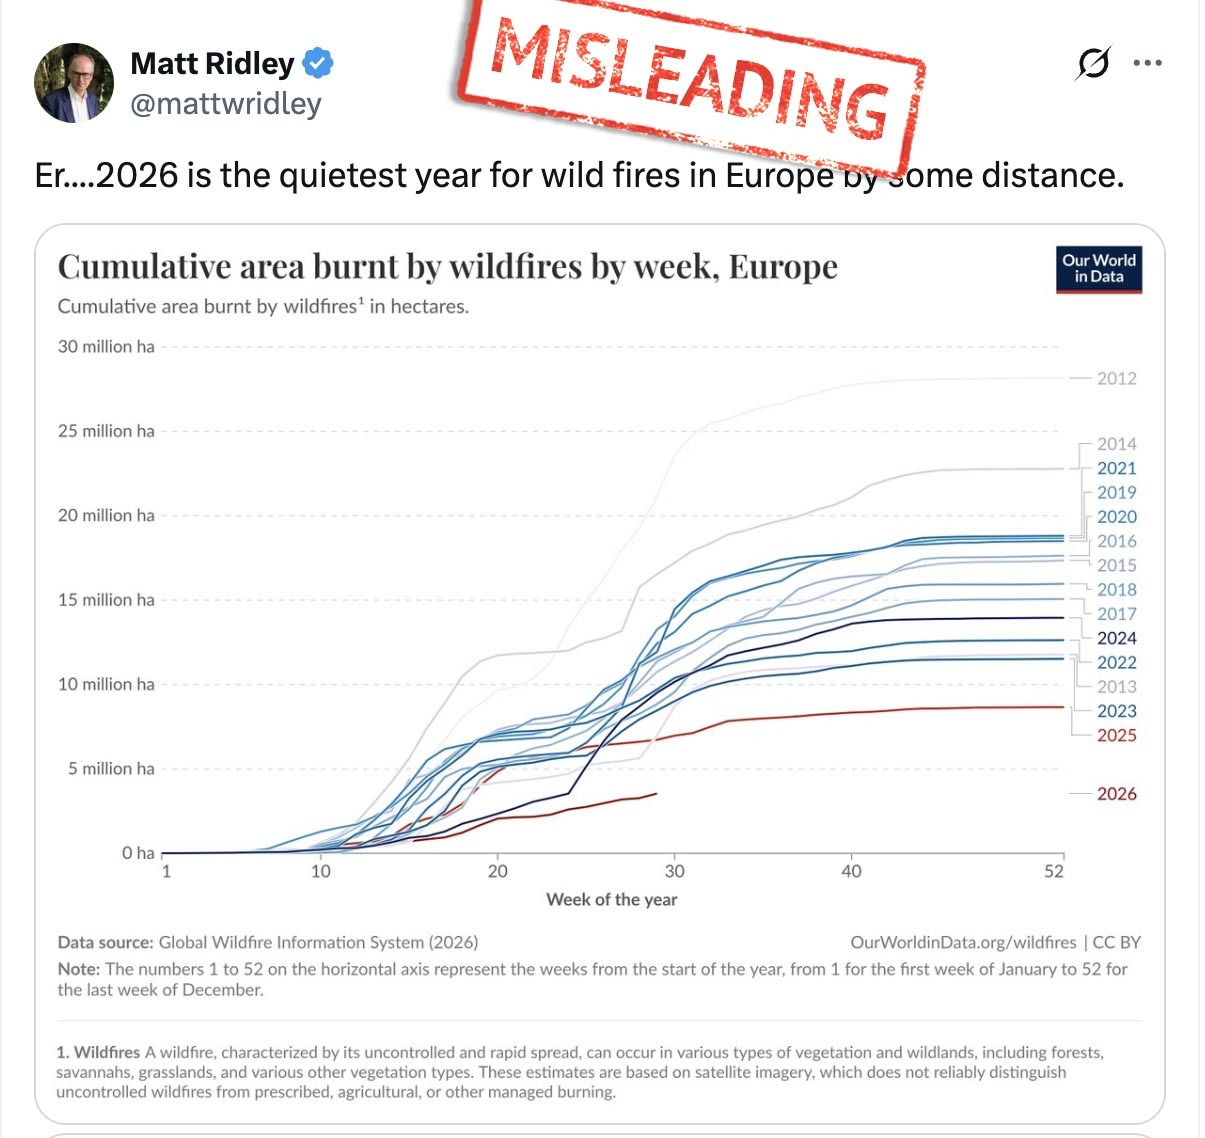
On 27 July, as wildfires raged across multiple European countries, former Conservative peer and climate-sceptic commentator Matt Ridley posted on Twitter that “2026 is the quietest year for wildfires in Europe by some distance”.
Ridley, who sits on the academic advisory council of the Global Warming Policy Foundation (GWPF), a UK-based climate-sceptic lobby group that refuses to reveal the sources of its funding, was responding to an article by Daily Telegraph columnist Tim Stanley.
Stanley’s column, headlined: “Climate change is real – and the right needs to get serious about it”, warned:
“This is no longer a matter of speculation: the wildfires of Europe, pitiless and persistent, are the way we live now.”
Ridley included a chart from Our World In Data, showing the cumulative area burned by wildfires by week for Europe. The chart puts 2026 as having the smallest area for this time of year in a dataset going back to 2012.
Ridley’s post was widely shared by prominent rightwing figures – including Richard Tice, deputy leader of the hard-right, climate-sceptic Reform UK party, former Conservative cabinet minister Jacob Rees-Mogg and multiple commentators.
Separately, Wielicki also shared a chart on Twitter to imply that wildfires in Europe are declining. Wielicki has previously claimed that the “science is not settled on climate change”.
The charts posted by Ridley and Wielicki both use data from the Global Wildfire Information System (GWIS). The GWIS category for “Europe” encompasses all the countries on the continent and includes the whole of Russia.
As a result, Russia accounts for about 74% of the area included in the GWIS definition of “Europe”.
Wildfires in Russia typically account for 80-90% of the burned area in the GWIS Europe dataset. In 2026, fires in Russia are substantially below average. Therefore, including Russia in this comparison creates the false impression that wildfire activity across Europe is unusually low.
Dr Calum Cunningham, a research fellow at the University of Tasmania’s Fire Centre, says that such claims are “highly misleading”, noting that “they rely on aggregating fire activity across an enormous and climatically diverse region”. He tells Carbon Brief:
“A relatively quiet season in Russia can easily mask an exceptionally active season in France or Spain. If the analysis is focused on the regions actually experiencing the current fires, the picture is very different.
“The reality is that western Europe has experienced an extraordinary sequence of climate conditions this year.”
In contrast, the EFFIS provides a subset of wildfire data specifically for the area covered by the 27 nations of the EU, which, therefore, excludes Russia.
Another difference between the two datasets is that GWIS monitors all fires – including those on agricultural land that are intentionally set alight. The burned area as measured by GWIS contains significant cropland area.
By contrast, EFFIS uses land-cover data and other information to filter specifically for forest fires.
Looking at the EU-only data from EFFIS reveals that Europe is far from having its “quietest” year. The bloc’s burned area, as of 29 July, is almost 435,000 hectares (ha) – second only to 2022 for this time of year.
Notably, Wielicki has actually continued to post charts based on GWIS data, even after acknowledging that “includ[ing] all of Russia, including vast areas of Siberia…isn’t a good proxy for Europe”.
French fires
Even looking at EU-wide data misses the scale of this year’s wildfires for some individual countries.
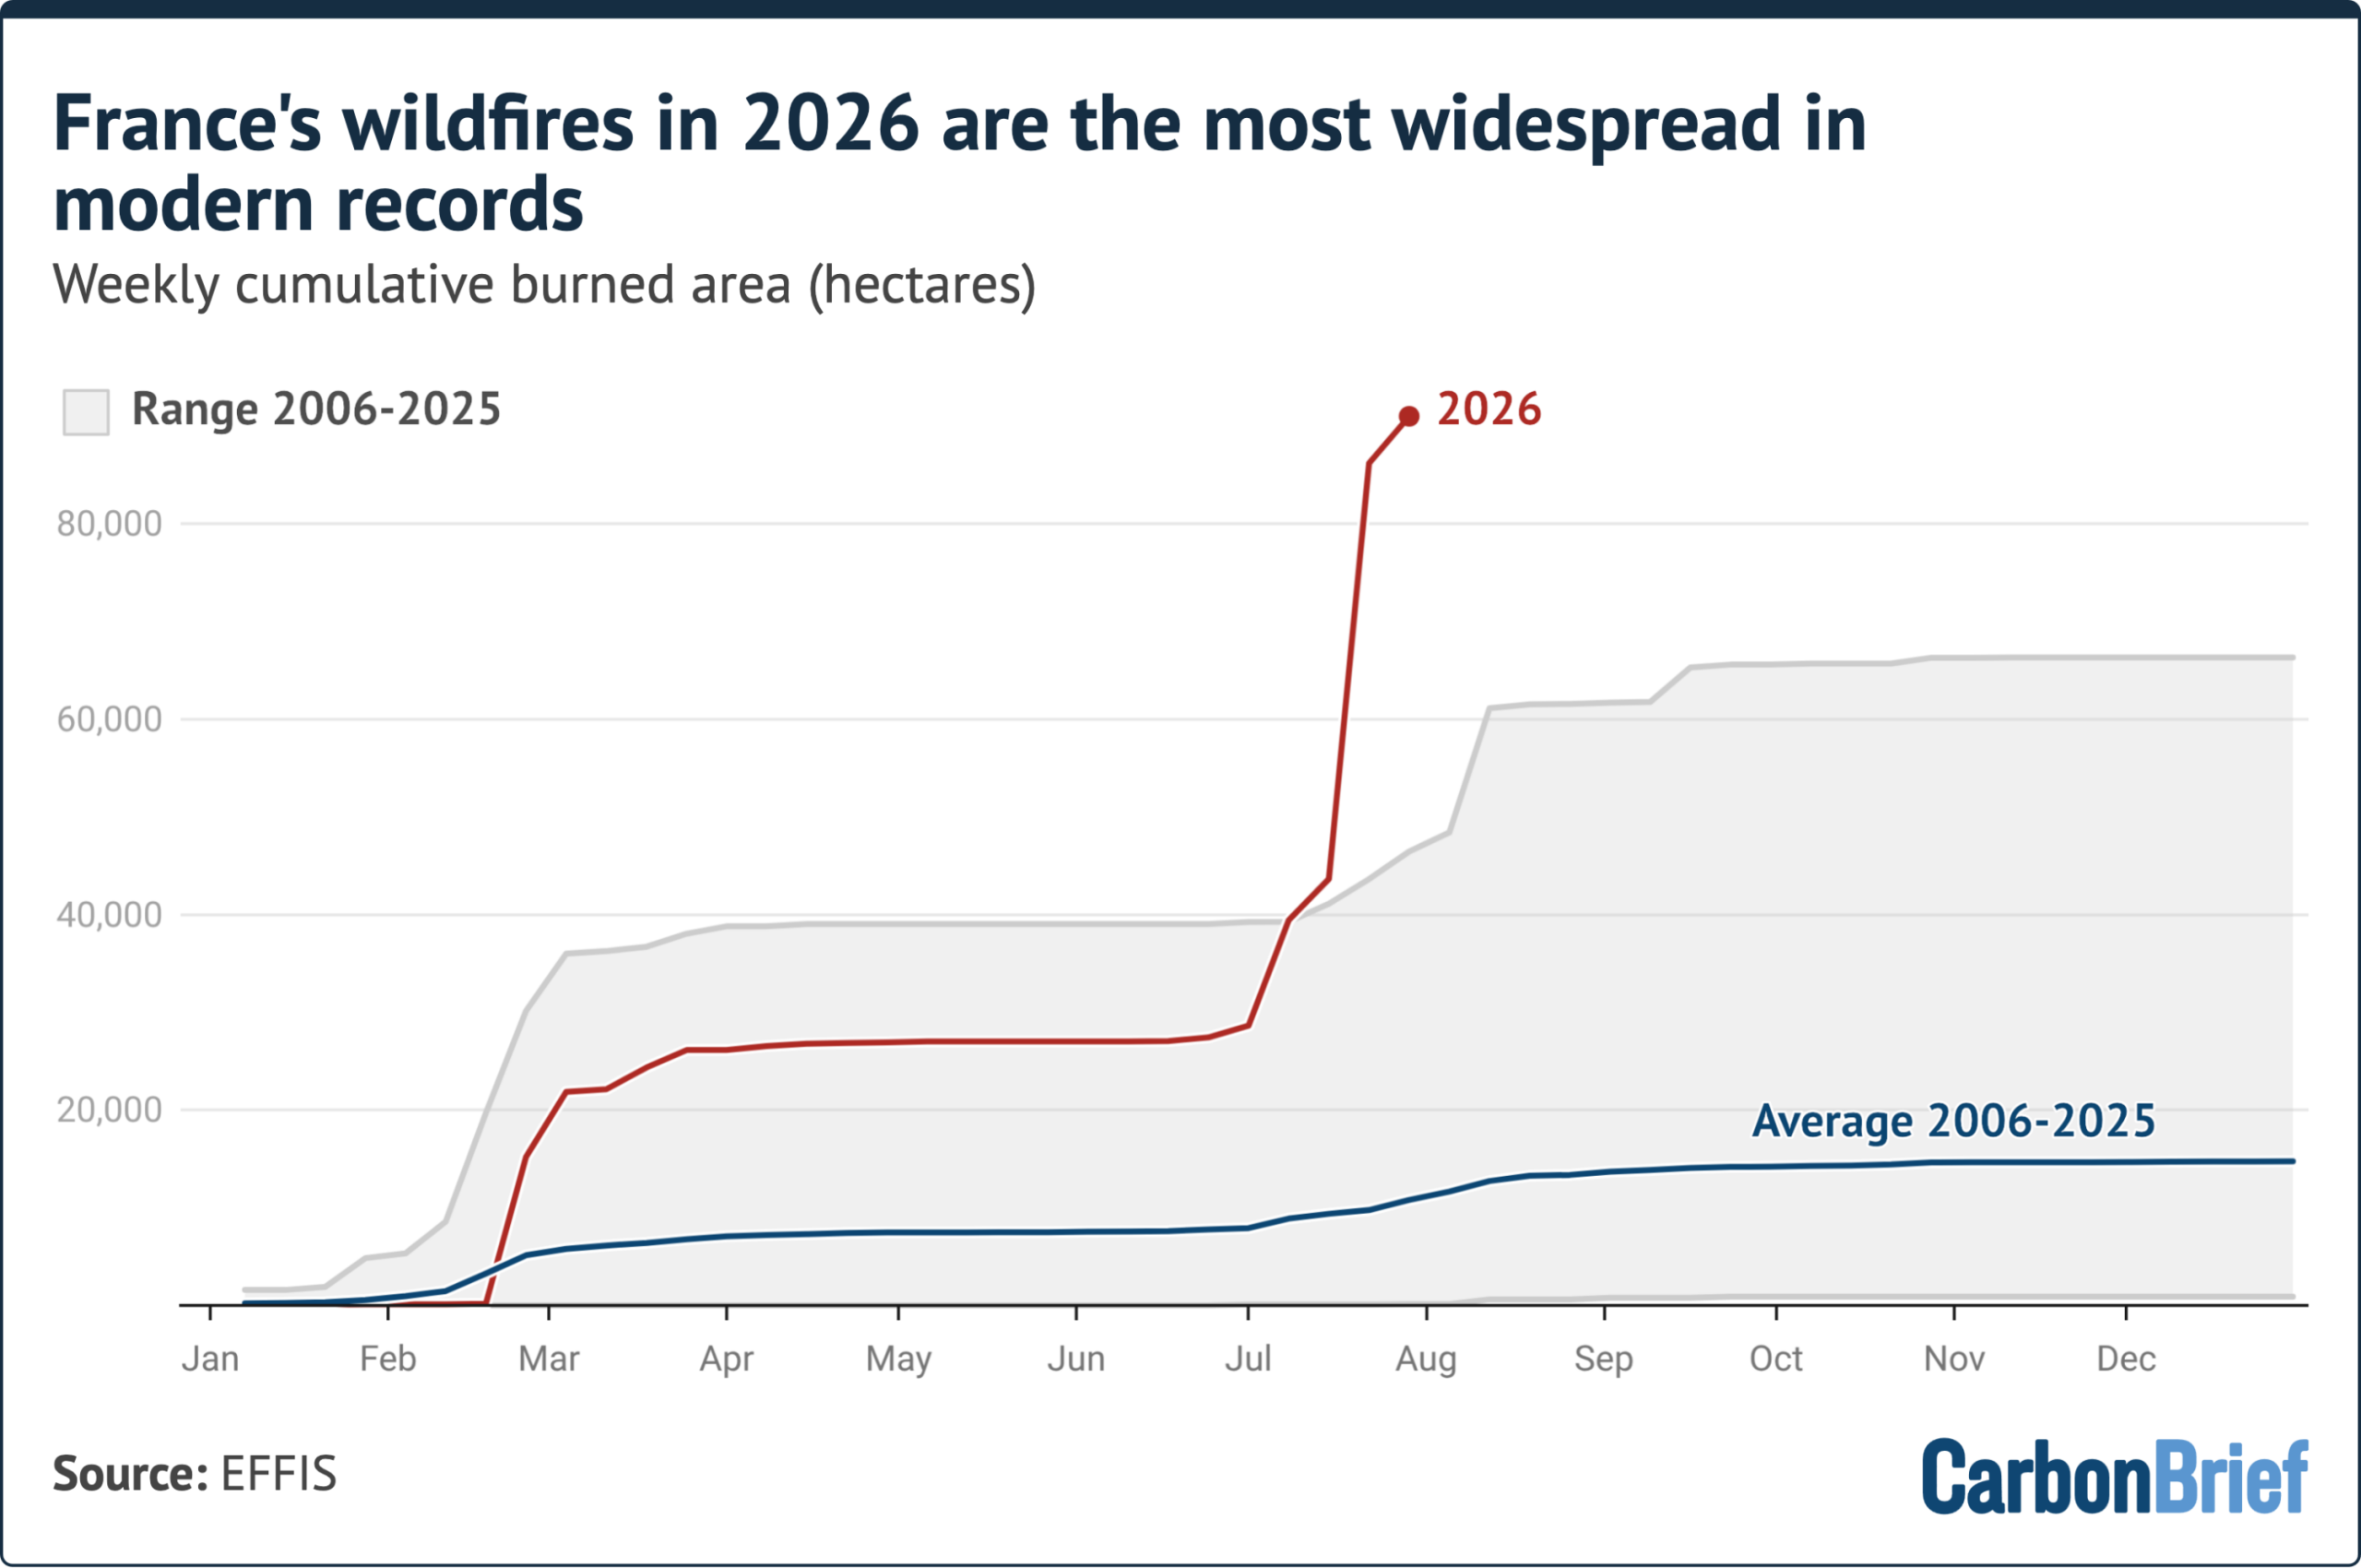
The chart below shows the surge in burned area in France since mid-July.
For much of the first half of the year, the country was having a wildfire season that was only slightly above average in terms of total burned area. However, a notable uptick began in the first week of July.
The third week of the month saw France break its previous cumulative annual record by more than 19,000ha. That gap has widened as the fires continue to burn; as of 29 July, the cumulative burned area in France during 2026 was nearly 24,700ha above the previous record.
The fires in France follow a record-breaking June heatwave that “dried out vegetation across the region, allowing fires to spread quickly”, wrote the New York Times.
On 27 July, French president Emmanuel Macron called a “crisis cabinet meeting” in order to address the fires “ravaging several areas of south-west France”, said France 24.
More than 220,000 people have been evacuated due to the Gironde fire, west of Bordeaux, in “what may be France’s largest peacetime evacuation”, reported the Associated Press.
In the Conversation, Cunningham and two other University of Tasmania researchers write that evacuation orders “protec[t] human lives, but makes it more likely houses and other structures will burn if there’s no one to defend them”. They add:
“There is little doubt climate change has made France and Spain’s wildfires worse. They represent yet another reason to redouble our efforts to tackle climate change and stabilise our climate.”
Central Spain scorched
While Spain’s fire season has not broken records in the same way that France’s has, it is on track to be among the worst since EFFIS began reporting data in 2006.
The chart below shows the rapid increase in burned area in Spain since 8 July. The latest data from EFFIS reveal that, as of 29 July, Spain has almost matched its previous record at this point in the year. It is also nearly five times the average area burned for this time of year.
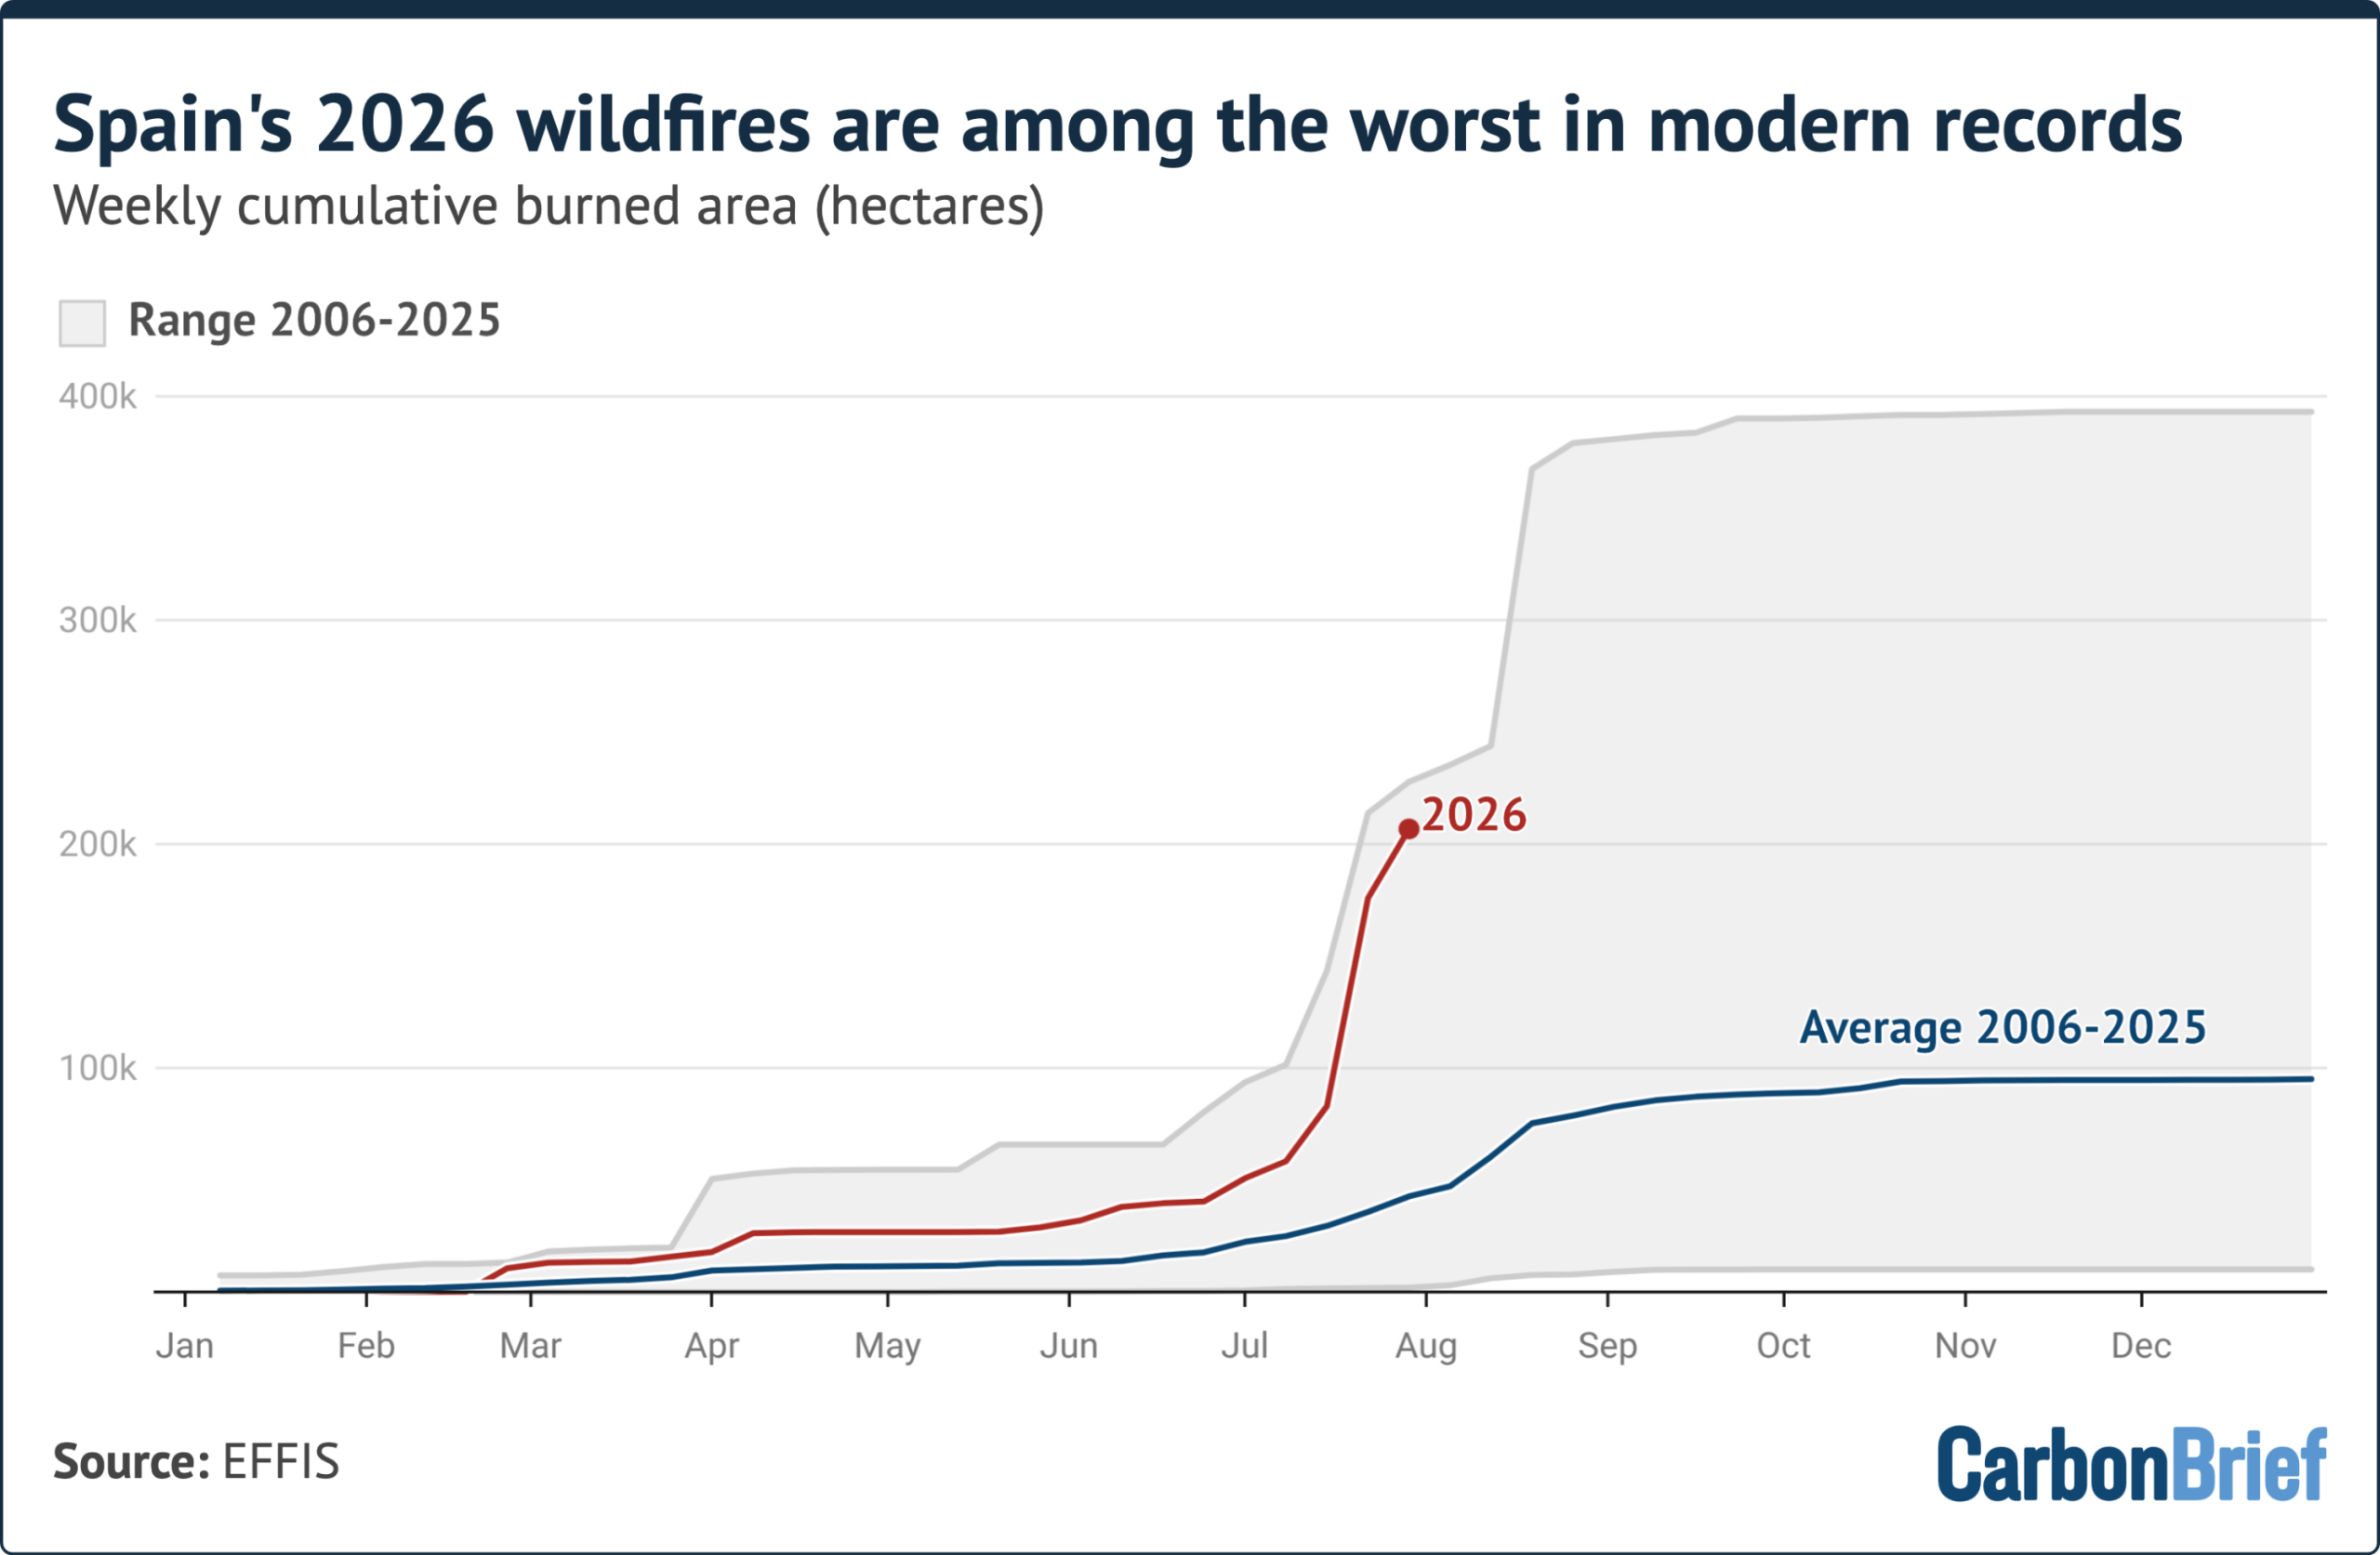
In Spain, the wildfires have been concentrated in the central part of the country, near Madrid.
BBC News reported that the fires outside the capital have burned “an area more than twice as large as the city itself”.
Nearly 90,000 people were forced from their homes in central Spain by the fires, said the Associated Press.
Pedro Sánchez, Spain’s prime minister, called the fires a “painful expression” of climate change.
Meanwhile, the UK, French and Spanish governments have issued joint statements this week in response to the fires. The UK/Spain statement begins:
“This summer’s wildfires demonstrated that climate change was now a national security emergency facing Europe and threatening our way of life.”
Related
The post Factcheck: No, Europe is not having its ‘quietest’ year for wildfires appeared first on Carbon Brief.
Factcheck: No, Europe is not having its ‘quietest’ year for wildfires
The general public often underestimate support for climate action, while overestimating the real-world actions taken by other people to address the problem, according to new research.
The study, published in Nature Climate Change, explores the differences between people’s support for climate change, their behaviour and their assumptions about other people’s behaviour.
It is based on multiple surveys of more than 5,000 people across Germany and the US.
The study expands on previous research on how the general public systematically underestimate the climate commitment of their peers.
The difference between actual and perceived support for climate action among the public is sometimes known as a “perception gap”.
The surveys tested how people’s perceptions of climate attitudes and behaviours relate to their own willingness to contribute and undertake “climate-friendly” actions.
One of the authors tells Carbon Brief that this perception gap is not due to “ignorance or bias”, but because “people are just not good at making good estimations”.
The research also reveals that people’s opinions and behaviours are more “nuanced than previously assumed” and suggests that simply “correcting misperceptions” does not automatically lead to greater climate action.
Measuring climate actions
The study notes that correcting the perception gap is often seen as a “cost-effective” way to promote public engagement and drive action to reduce the intensification and impacts of climate change.
Most studies that explore the perception gap have primarily focused on surveys that have asked people to report their willingness to support climate change.
In other words, researchers have relied upon people saying they would support efforts to tackle climate change, rather than measuring people’s real-world actions, such as financial donations, attending protests or changing their behaviour.
To fill this gap, the researchers behind the new study surveyed a total of more than 5,000 people in Germany and the US over 2024-25. Surveys were split across five different experiments, each focused on public perceptions of climate attitudes and how they relate to individuals’ actual behaviour:
| Experiment | What they did |
| Survey one | Participants were asked if they were willing to donate 1% of their household income to WWF – and then were given the chance to do so. Follow-up questions asked participants to predict how many of their peers said “yes” and how many actually donated to the charity. |
| Survey two | Participants read a constitutional complaint against the German government, led by Greenpeace, which demands for stricter climate policies. They were asked if they were willing to participate as a claimant and/or donate to the cause – and then were given the chance to do so. Follow-up questions asked participants to predict how many of their peers said “yes” and how many went on to support the complaint. |
| Survey three | Participants were requested to complete an online “work for environmental protection task” where the more “pages” they completed resulted in more donations to WWF. They then predicted how many pages their peers completed. Participants also rated their individual behaviours and support for eight climate policies and then estimated the same for other people. |
| Surveys four and five | Participants were split into three groups that were either informed that 4% of participants had donated 1% of their household income to WWF, that “68% were willing to contribute” or given no information. They then had to state whether they were willing to support WWF and then were given the opportunity to do so. |
The authors note that Germany and the US are two of the “top 10 CO2 emitters” and are places where climate action is “especially necessary”. However, they add that the two countries are not reflective of “diverse cultural contexts” and further research is needed across the world.
The perception gap
The researchers find that most of their participants supported climate action, but much fewer actually performed verifiable behaviours.
For example, survey one finds that 37% of participants said they were willing to donate to WWF, yet just 4% did when given the opportunity.
Participants generally overestimated the climate actions of their peers, predicting that 23% of other people donated. Willingness, on the other hand, was slightly underestimated with respondents averaging around 34%.
The results from survey three suggest that this perception gap is likely due to general cognitive processes within the human brain that make accurate estimations about large groups difficult, say the authors.
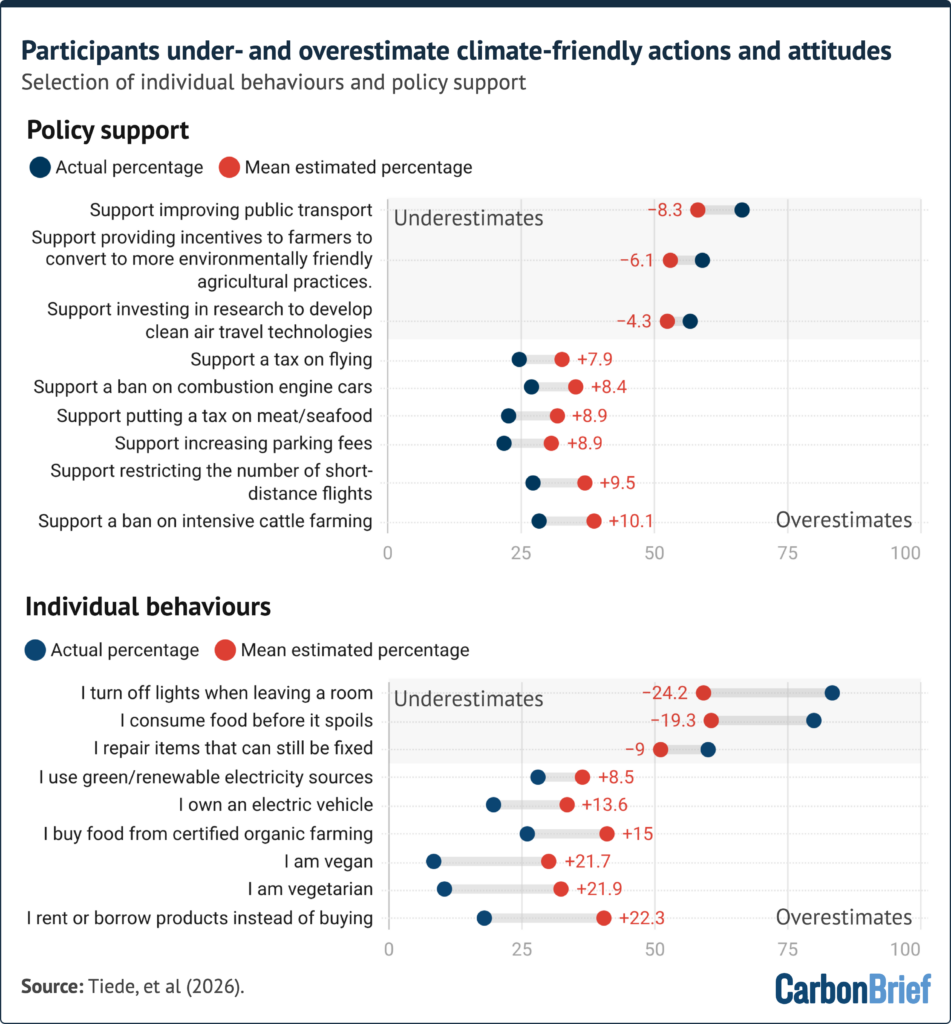
The chart below shows the actual percentage of people who supported different environmental policies and performed climate-friendly behaviours (blue dots) compared to average predictions from the surveys (red dots).
They reveal a “consistent pattern” where “small proportions were overestimated and large ones were underestimated”, the authors say, driving predictions towards the middle. This phenomenon is known as “regression to the mean”.
In other words, where public support for a policy was high, participants in the survey estimated it was lower than it was. When the support was lower, estimates would be higher.
The study finds that individual and environmental factors played a role in shaping people’s perceptions of their peers’ climate actions, which were distinct from general misestimations.
For example, people who were already involved in climate action, had more frequent climate discussions and consumed more climate-focused news and media predicted a higher proportion of climate support “across the board”.
The results from the fourth and fifth surveys show that knowing the context of other people’s beliefs and behaviour in surveys can impact the attitudes of participants.
Participants that were told that 68% of people were willing to donate 1% of their household income to the WWF were more willing to donate.
In contrast, participants that were told that 4% of people actually donated did not report more willingness to “discuss climate change, sign petitions or donate” than the control group.
However, there was no obvious impact on actual donations for any of the three groups, the study notes.
Lead study author Dr Kevin Tiede, scientific managing director of the Institute for Planetary Health Behaviour at the University of Erfurt, tells Carbon Brief that the findings suggest that “just telling people how many people support climate action is likely not enough to really change something”.
However, Tiede adds that “direct comparability” between people saying they would donate and actually donating is “limited” and that giving people more time to answer and autonomy over where to donate might result in more people taking action.
‘Pluralistic ignorance’
Tiede explains that the study findings demonstrate the existence of “pluralistic ignorance”, where a person believes their own views differ from the majority.
For climate change, this means that the “vast majority of people around the world support climate action, but people considerably underestimate the extent of this support”, the study says.
However, the surveys reveal that pluralistic ignorance “in the climate domain” is more nuanced than previously thought, say the authors.
Prof Madalina Vascleanu, an assistant professor at Stanford University’s Doerr School of Sustainability, who was not involved in the study, tells Carbon Brief that encouraging climate action is complex.
It may take multiple and repeated “attempts” at effective communication, or for people to directly “experience” the “norm” that climate change is widely supported, she says, rather than simply being told.
“Observable” behaviours, such as “identity signalling” – which could involve anything from protesting to vegetarianism – might have more of an impact on encouraging climate action among peers than “private behaviours like donations”, she adds.
The study is a “great addition to the literature”, Vascleanu says, because “correcting” the perception gap did not have an effect on climate-friendly behaviour, as “scholars had previously assumed”. She adds that it has “sparked several new hypotheses” that her “lab is now working on”.
Prof Mauro Bertolotti, associate professor of social psychology at the Università Cattolica del Sacro Cuore, explains that the “attitude-behaviour gap” revealed by the research is a “rather common finding”.
However, he is “sceptical” of the “simplified and abstract” measures, warning that experiment environments often come with “assumptions and expectations” that are different from real life.
As a result, they might not “replicate” the process people go through when choosing to “make a donation to an environmental cause”, he says.
‘Targeted’ communication strategies
The researchers argue that it is more effective to focus on “targeted” communication strategies – encouraging climate-friendly behaviours that aim to reach the majority who already support climate action, rather than trying to convert climate sceptics.
They call for attention to be paid to the attitude-behaviour gap between people saying they support efforts to tackle climate change and following up with real-world climate actions.
The study suggests strategies for decision-makers to reduce the attitude-behaviour gap, such as “facilitating climate-friendly behaviour” with “convenience and subsidies”. They also recommend ensuring environmental policy prioritises fairness to gain visible and widespread public support.
They add that the public would benefit from understanding the “effectiveness and co-benefits” of climate action.
Tiede, K.E. et al. (2026) People systematically under- and overestimate public engagement in climate action, Nature Climate Change, https://doi.org/10.1038/s41558-026-02668-z
Related
Scientists are ‘most trusted’ source of climate information in global-south survey

Survey: ‘Very few’ Africans place responsibility for climate action on ‘rich nations’
Guest post: How public attitudes towards ‘CO2 removal’ differ in the UK and US

Guest post: How ‘discourses of delay’ are used to slow climate action
The post Correcting climate ‘misperceptions’ may not boost climate action appeared first on Carbon Brief.
Correcting climate ‘misperceptions’ may not boost climate action


-
Greenhouse Gases12 months ago
Guest post: Why China is still building new coal – and when it might stop
-
Climate Change12 months ago
Guest post: Why China is still building new coal – and when it might stop
-

 Greenhouse Gases2 years ago
嘉宾来稿:满足中国增长的用电需求 光伏加储能“比新建煤电更实惠”
-

 Climate Change2 years ago
嘉宾来稿:满足中国增长的用电需求 光伏加储能“比新建煤电更实惠”
-
Climate Change2 years ago
Bill Discounting Climate Change in Florida’s Energy Policy Awaits DeSantis’ Approval
-

 Renewable Energy9 months ago
Sending Progressive Philanthropist George Soros to Prison?
-

 Carbon Footprint2 years ago
US SEC’s Climate Disclosure Rules Spur Renewed Interest in Carbon Credits
-
Greenhouse Gases1 year ago
嘉宾来稿:探究火山喷发如何影响气候预测