Rio Tinto delivered a mixed but resilient performance in the full-year 2025. While weaker iron ore prices weighed on profits, strong copper growth and disciplined cost control helped the mining giant keep earnings stable and maintain its dividend.
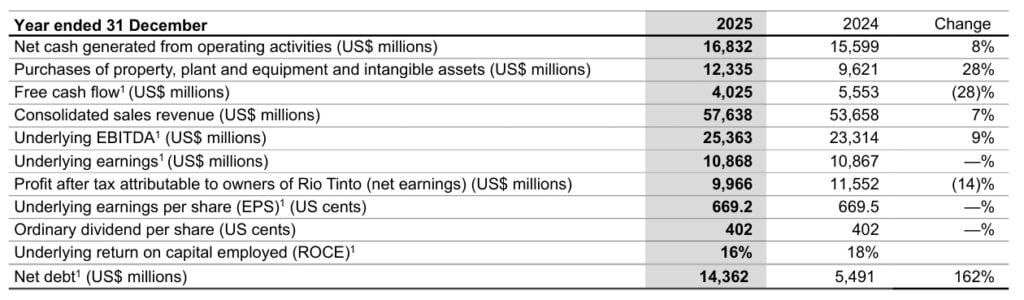
The world’s largest iron ore producer reported underlying earnings of $10.87 billion for the year ended December 31, unchanged from 2024. However, net profit fell 14% to $9.97 billion, compared to $11.55 billion a year earlier.
Despite the profit decline, Rio Tinto kept its shareholder payout steady. It declared an ordinary dividend of $6.5 billion, maintaining a 60% payout ratio. This marked the tenth straight year the company paid at the top end of its target range.
Iron Ore Softens, Copper and Aluminium Step Up
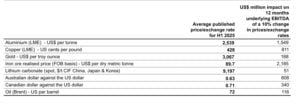
Lower iron ore prices hurt earnings. As the backbone of Rio Tinto’s business, iron ore remains critical. However, copper and aluminium delivered strong support.
Copper production rose 11% year over year. The key driver was the ramp-up of the Oyu Tolgoi underground project in Mongolia, where output surged 61%. This project is now complete and will play a major role in future copper growth.
Aluminium also performed well across the value chain. The company achieved record annual bauxite production of 62.4 million tonnes. As a result of higher volumes and better productivity, Rio Tinto reduced operating unit costs by 5% in real terms during 2025.
Operational cash flow strengthened. Net cash from operating activities rose 8% to $16.8 billion. Meanwhile, underlying EBITDA climbed 9% to $25.4 billion. These gains reflected operational discipline and tighter cost management.
Looking ahead, the company aims to deliver a 4% compound annual unit cost improvement through 2030. It also expects productivity initiatives to generate $650 million in annual benefits by early 2026.
Big Projects Drive Future Growth
Rio Tinto made significant progress across its global project pipeline in 2025. The major milestones are explained below:
Simandou Iron Ore Project
The Simandou project in Guinea reached a major milestone. The company shipped its first high-grade iron ore in December. This project is expected to strengthen long-term supply and improve product quality.
Pilbara Replacement Mines
In Western Australia’s Pilbara region, the Western Range replacement mine opened on time and on budget. Additionally, construction began at three more brownfield iron ore mines. Four of the five major replacement projects are now either ramping up or under construction.
Copper Expansion
The Oyu Tolgoi underground development is complete. Rio Tinto also achieved first production of Nuton copper at the Johnson Camp mine. The company remains on track to deliver 3% compound annual growth in copper-equivalent production through 2030.
Lithium Growth
In March, Rio Tinto closed its acquisition of Arcadium ahead of schedule. The focus now shifts to advancing lithium projects in Argentina and Canada. The company targets 200,000 tonnes per year of lithium carbonate equivalent capacity by 2028.
Together, these projects strengthen Rio Tinto’s position in future-facing commodities like copper and lithium, which are essential for electrification and the energy transition.
Strong Balance Sheet and Capital Discipline
Despite profits falling, Rio Tinto’s financial position remains solid. Its strong cash flow supports consistent dividends and future investment. The company plans to unlock between $5 billion and $10 billion from its asset base. It is currently reviewing options for its borates and titanium dioxide (TiO₂) businesses and considering infrastructure monetization.
Management also streamlined operations. It reduced its structure from four product groups to three core divisions, i.e., iron ore, aluminium & lithium, and copper
Additionally, the company reduced contractor numbers and discretionary spending. It also placed the Jadar project into care and maintenance and stopped non-core studies. These steps sharpened its focus on value-generating assets.
Climate Action: Progress with Challenges
Sustainability remains an important part of Rio Tinto’s long-term strategy. The company spent $612 million on decarbonization initiatives in 2025, up from $589 million in 2024
In 2025:
- Gross Scope 1 and 2 emissions were 31.5 million tonnes of CO₂ equivalent, down 14% from the 2018 baseline of 36.7 million tonnes.
- Scope 3 emissions, which include customer use of products, reached 575.7 million tonnes of CO₂ equivalent. These emissions represent the largest share of its climate footprint. After applying high-quality carbon offsets, net emissions were 17% below baseline.
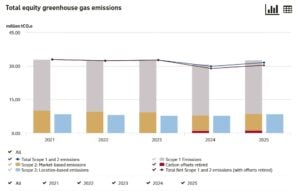
However, progress slowed compared to prior years. Emissions fell by just 0.2 million tonnes from 2024 levels. Increased production in iron ore and copper partly offset reductions.
Renewable Energy Contracts and Carbon Credits
The mining giant relies on renewable energy contracts and renewable diesel use, especially at its Kennecott site. It also retired about 1.01 million Australian Carbon Credit Units (ACCUs) to meet regulatory requirements.
Still, the path to its 2030 target of a 50% reduction in Scope 1 and 2 emissions depends on third-party renewable projects and successful commercial agreements. These factors remain outside the company’s direct control.
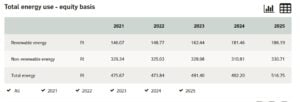
Around 7% of its electricity came from renewable sources, slightly lower than 78% in 2024 due to accounting adjustments in reported figures.
Environmental and Water Management
Air quality indicators such as NOx, SOx, and fluoride levels remained relatively stable over five years. However, PM10 levels increased slightly over the past three years. To reduce emissions at the source, Rio Tinto continues to upgrade equipment with best-available technologies. It also expands air monitoring networks around its operations.
Water management improved in 2025. Total operational water withdrawals declined to 1,147 gigalitres, down from 1,250 gigalitres in 2024. Freshwater withdrawals also fell slightly to 386 gigalitres.
Water recycling increased to 374 gigalitres, showing better reuse practices. Meanwhile, total water discharges dropped to 626 gigalitres.
The company advanced several community-focused water initiatives, including implementing a new water strategy at QIT Madagascar Minerals. It also increased transparency by publishing detailed water performance data.
The Bigger Picture
Overall, Rio Tinto delivered steady underlying earnings in a challenging pricing environment. Iron ore weakness pressured profits, yet copper and aluminium provided strong support.
At the same time, disciplined capital allocation, operational efficiency, and large-scale project execution strengthened its long-term outlook.
Looking forward, growth will rely heavily on copper and lithium. These metals sit at the heart of global electrification and decarbonization trends. If Rio Tinto delivers on its cost improvements and project milestones, margins and cash flow could improve further.
However, climate targets remain ambitious. Achieving deeper emissions cuts will require faster renewable energy deployment and broader collaboration across its value chain.
In short, 2025 showed resilience rather than rapid growth. Rio Tinto balanced shareholder returns, project expansion, and sustainability progress. Now, its future depends on executing its copper-led strategy while navigating commodity cycles and climate commitments.
The post Rio Tinto’s HY25 Profit Falls 14%, but Copper Projects and Sustainability Efforts Stand Out appeared first on Carbon Credits.
Carbon Footprint
Finding Nature Based Solutions in Your Supply Chain
Carbon Footprint
How Climate Change Is Raising the Cost of Living
Americans are paying more for insurance, electricity, taxes, and home repairs every year. What many people may not realize is that climate change is already one of the drivers behind those rising costs.
For many households, climate change is no longer just an environmental issue. It is becoming a cost-of-living issue. While climate impacts like melting glaciers and shrinking polar ice can feel distant from everyday life, the financial effects are already showing up in monthly budgets across the country.
Today, a larger share of household income is consumed by fixed costs such as housing, insurance, utilities, and healthcare. (3) Climate change and climate inaction are adding pressure to many of those expenses through higher disaster recovery costs, rising energy demand, infrastructure repairs, and increased insurance risk.
The goal of this article is to help connect climate change to the everyday financial realities people already experience. Regardless of where someone stands on climate policy, it is important to recognize that climate change is already increasing costs for households, businesses, and taxpayers across the United States.
More conservative estimates indicate that the average household has experienced an increase of about $400 per year from observed climate change, while less conservative estimates suggest an increase of $900.(1) Those in more disaster-prone regions of the country face disproportionate costs, with some households experiencing climate-related costs averaging $1,300 per year.(1) Another study found that climate adaptation costs driven by climate change have already consumed over 3% of personal income in the U.S. since 2015.(9) By the end of the century, housing units could spend an additional $5,600 on adaptation costs.(1)
Whether we realize it or not, Americans are already paying for climate change through higher insurance premiums, energy costs, taxes, and infrastructure repairs. These growing expenses are often referred to as climate adaptation costs.
Without meaningful climate action, these costs are expected to continue rising. Choosing not to invest in climate action is also choosing to spend more on climate adaptation.
Here are a few ways climate change is already increasing the cost of living:
- Higher insurance costs from more frequent and severe storms
- Higher energy use during longer and hotter summers
- Higher electricity rates tied to storm recovery and grid upgrades
- Higher government spending and taxpayer-funded disaster recovery costs
The real debate is not whether climate change costs money. Americans are already paying for it. The question is where we want those costs to go. Should we invest more in climate action to help reduce future climate adaptation costs, or continue paying growing recovery and adaptation expenses in everyday life?
How Climate Change Is Increasing Insurance Costs
There is one industry that closely tracks the financial impact of natural disasters: insurance. Insurance companies are focused on assessing risk, estimating damages, and collecting enough revenue to cover losses and remain financially stable.
Comparing the 20-year periods 1980–1999 and 2000–2019, climate-related disasters increased 83% globally from 3,656 events to 6,681 events. The average time between billion-dollar disasters dropped from 82 days during the 1980s to 16 days during the last 10 years, and in 2025 the average time between disasters fell to just 10 days. (6)
According to the reinsurance firm Munich Re, total economic losses from natural disasters in 2024 exceeded $320 billion globally, nearly 40% higher than the decade-long annual average. Average annual inflation-adjusted costs more than quadrupled from $22.6 billion per year in the 1980s to $102 billion per year in the 2010s. Costs increased further to an average of $153.2 billion annually during 2020–2024, representing another 50% increase over the 2010s. (6)
In the United States, billion-dollar weather and climate disasters have also increased significantly. The average number of billion-dollar disasters per year has grown from roughly three annually during the 1980s to 19 annually over the last decade. In 2023 and 2024, the U.S. recorded 28 and 27 billion-dollar disasters respectively, both setting new records. (6)
The growing impact of climate change is one reason insurance costs continue to rise. “There are two things that drive insurance loss costs, which is the frequency of events and how much they cost,” said Robert Passmore, assistant vice president of personal lines at the Property Casualty Insurers Association of America. “So, as these events become more frequent, that’s definitely going to have an impact.” (8)
After adjusting for inflation, insurance costs have steadily increased over time. From 2000 to 2020, insurance costs consistently grew faster than the Consumer Price Index due to rising rebuilding costs and weather-related losses.(3) Between 2020 and 2023 alone, the average home insurance premium increased from $75 to $360 due to climate change impacts, with disaster-prone regions experiencing especially steep increases.(1) Since 2015, homeowners in some regions affected by more extreme weather have seen home insurance costs increased by nearly 57%.(1) Some insurers have also limited or stopped offering coverage in high-risk areas.(7)
For many families, rising insurance costs are no longer occasional financial burdens. They are becoming recurring monthly expenses tied directly to growing climate risk.
How Rising Temperatures Increase Household Energy Costs

The financial impacts of climate change extend beyond insurance. Rising temperatures are also changing how much energy Americans use and how utilities plan for future electricity demand.
Between 1950 and 2010, per capita electricity use increased 10-fold, though usage has flattened or slightly declined since 2012 due to more efficient appliances and LED lighting. (3) A significant share of increased energy demand comes from cooling needs associated with higher temperatures.
Over the last 20 years, the United States has experienced increasing Cooling Degree Days (CDD) and decreasing Heating Degree Days (HDD). Nearly all counties have become warmer over the past three decades, with some areas experiencing several hundred additional cooling degree days, equivalent to roughly one additional degree of warmth on most days. (1) This trend reflects a warming climate where air conditioning demand is increasing while heating demand generally declines. (4)
As temperatures continue rising, households are expected to spend more on cooling than they save on heating. The U.S. Energy Information Administration (EIA) projects that by 2050, national Heating Degree Days will be 11% lower while Cooling Degree Days will be 28% higher than 2021 levels. Cooling demand is projected to rise 2.5 times faster than heating demand declines. (5)
These projections come from energy and infrastructure experts planning for future electricity demand and grid capacity needs. Utilities and grid operators are already preparing for higher peak summer electricity loads caused by rising temperatures. (5)
Longer and hotter summers also affect how homes and buildings are designed. Buildings constructed for past climate conditions may require upgrades such as larger air conditioning systems, stronger insulation, and improved ventilation to remain comfortable and energy efficient in the future. (10)
For many households, this means higher monthly utility bills and potentially higher long-term home improvement costs as temperatures continue to rise.
How Climate Change Affects Electricity Rates
On an inflation-adjusted basis, average U.S. residential electricity rates are slightly lower today than they were 50 years ago. (2) However, climate-related damage to utility infrastructure is creating new upward pressure on electricity costs.
Electric utilities rely heavily on above-ground poles, wires, transformers, and substations that can be damaged by hurricanes, storms, floods, and wildfires. Repairing and upgrading this infrastructure often requires substantial investment.
As a result, utilities are increasing electricity rates in response to wildfire and hurricane events to fund infrastructure repairs and future mitigation efforts. (1) The average cumulative increase in per-household electricity expenditures due to climate-related price changes is approximately $30. (1)
While this increase may appear modest today, utility costs are expected to rise further as climate-related infrastructure damage becomes more frequent and severe.
How Climate Disasters Increase Government Spending and Taxes
Extreme weather events also damage public infrastructure, including roads, schools, bridges, airports, water systems, and emergency services infrastructure. Recovery and rebuilding costs are often funded through taxpayer dollars at the federal, state, and local levels.
The average annual government cost tied to climate-related disaster recovery is estimated at nearly $142 per household. (1) States that frequently experience hurricanes, wildfires, tornadoes, or flooding can face even higher public recovery costs.
These expenses affect taxpayers whether they personally experience a disaster or not. Climate-related recovery spending can increase pressure on public budgets, emergency management systems, and infrastructure funding nationwide.
Reducing Climate Costs Through Climate Action
While this article focuses on the growing financial costs associated with climate change, the issue is not only about money for many people. It is also about recognizing our environmental impact and taking responsibility for reducing it in order to help preserve a healthy planet for future generations.
While individuals alone cannot solve climate change, collective action can help reduce future climate adaptation costs over time.
For those interested in taking action, there are three important steps:
- Estimate your carbon footprint to better understand the emissions connected to your lifestyle and activities.
- Create a plan to gradually reduce emissions through energy efficiency, cleaner technologies, and more sustainable choices.
- Address remaining emissions by supporting verified carbon reduction projects through carbon credits.
Carbon credits are one of the most cost-effective tools available for climate action because they help fund projects that generate verified emission reductions at scale. Supporting global emission reduction efforts can help reduce the long-term impacts and costs associated with climate change.
Visit Terrapass to learn more about carbon footprints, carbon credits, and climate action solutions.
The post How Climate Change Is Raising the Cost of Living appeared first on Terrapass.
Carbon Footprint
Carbon credit project stewardship: what happens after credit issuance
A carbon credit purchase is not a transaction that closes at issuance. The credit may be retired, the certificate filed, and the reporting box ticked. But on the ground, in the forest, in the field, and in the community, the work continues. It endures for years. In many cases, for decades.
![]()
-
Greenhouse Gases10 months ago
Guest post: Why China is still building new coal – and when it might stop
-
Climate Change10 months ago
Guest post: Why China is still building new coal – and when it might stop
-
Greenhouse Gases2 years ago嘉宾来稿:满足中国增长的用电需求 光伏加储能“比新建煤电更实惠”
-

Climate Change2 years ago嘉宾来稿:满足中国增长的用电需求 光伏加储能“比新建煤电更实惠”
-
Climate Change2 years ago
Bill Discounting Climate Change in Florida’s Energy Policy Awaits DeSantis’ Approval
-
Renewable Energy7 months agoSending Progressive Philanthropist George Soros to Prison?
-
Carbon Footprint2 years agoUS SEC’s Climate Disclosure Rules Spur Renewed Interest in Carbon Credits
-
Greenhouse Gases11 months ago
嘉宾来稿:探究火山喷发如何影响气候预测

