

Amid heightened concern last winter about the security of the electricity supply across the island of Great Britain, National Grid Electricity System Operator (ESO) brought in a first-of-its-kind demand-management system.
The Demand Flexibility Service (DFS) relied on consumers reacting to notifications from the operator to help reduce their demand and keep the island’s grid secure during times of particular strain. (The island’s grid incorporates England, Scotland and Wales, but not Northern Ireland.)
Over the course of the winter of 2022/23, the system-level impact of DFS was significant, reducing demand by 2.92 gigawatt hours (GWh) from times of grid strain, according to a recent report from the Centre for Net Zero.
This is equivalent to the electricity needed for every person in Great Britain to make a large cup of tea, it claims.
This helped ensure, it adds, that the ”lights stayed on” and reduced the need for reliance on coal-fired power stations or exceptionally expensive alternatives. Additionally, 681 tonnes of carbon dioxide (tCO2) emissions were avoided through the use of DFS.
ESO has reintroduced the service for 2023/24, with the first session taking place on 16 November.
The Q&A below examines what the service has achieved – and whether it offers value for money.
- What is the ‘demand flexibility service’ and why was it created?
- Who took part in last year’s trial of the service and why?
- What did the demand flexibility service achieve?
- Did the demand flexibility service offer value for money?
- What will the service look like in winter 2023-24?
What is the ‘demand flexibility service’?
In 2022, ESO launched its new DFS to provide an additional mechanism to support energy security over the winter.
There was heightened concern about the potential of blackouts over the winter of 2022/23, due to the volatility in the gas market, exacerbated substantially by the Russian invasion of Ukraine earlier that year.
As such, in its Winter Outlook report, the operator added new tools in the form of securing contingency contracts with coal-fired power plants and launching DFS.
From 1 November 2022, DFS started to incentivise users to reduce consumption during key times, to reduce the overall demand across the system.
Households with a smart meter or business sites with half-hourly metering were eligible to sign up to the scheme and could sign up through either their supplier or a technology provider. In total, there were 31 providers that registered by the end of the DFS period in March 2023.
This was made up of 14 “domestic only”, 10 “non-domestic only” and seven “both domestic and non-domestic”.
DFS was designed so that the ESO could notify providers about the times when capacity on the grid was expected to be tight, allowing them to reach out to their customers who had signed up to the scheme. They could then opt-in to the DFS sessions and work to reduce their demand during the specified periods.
Over the winter of 2022/23, there were 20 test events – which were used to “onboard” providers – and two live uses of DFS, where it was used to ensure there was sufficient capacity to meet demand. These sessions had a duration of 60, 90 and 120 minutes.
Across the test events, ESO established a guaranteed “acceptance price” of £3,000 per megawatt hour (/MWh) for all bids submitted by DFS providers. This was designed to offer assurance to providers.
During the live events, DFS providers presented bids at higher prices than the guaranteed acceptance price, allowing them to incentivise participants further and, therefore, provide more substantial demand reductions during times when balancing the grid was particularly challenging.
The two live events – which took place on 23 and 24 January 2023 – saw providers submit bids within the range of £3,300/MWh and £6,500/MWh, according to data from LCP Delta.
Who took part in last year’s trial of the service?
Between November and March, 1.6m households and businesses participated in DFS, according to the ESO.
Collectively, they provided ~350MW of flexibility during events, helping to avoid blackouts during periods of particular constraint on the grid.
According to a survey conducted by the system operator, a wide range of households took part in DFS. Of those surveyed, 30% had a health condition or long-term illness, 18% were tenants and 30% lived in households with three or more people. This highlighted the low barriers to participation of DFS, according to ESO.
There were still groups that were underrepresented, including younger age groups, lower income households, renters and city residents.
According to ESO’s survey, those under the age of 45 were underrepresented in DFS participation in comparison with the British population. (Britain’s electricity system covers England, Wales and Scotland, therefore, the population of Northern Ireland was not eligible to take part in DFS.) The most pronounced underrepresentation was seen in those aged 18-19 and 20-24 years old. The most overrepresented age groups were 55-64 and 65-74.
Within the under-45 age group, women made up the majority of participants, whereas in the over-45 group men made up the majority. Overall, 54.9% of those surveyed identified as female, in comparison with 51.7% of the British population, the survey continues.
The white ethnic group was overrepresented, with 95.7% of respondents falling within the category, notes the ESO, compared to 82.7% of the British population (a 13% difference).
All other groups were underrepresented, with Asian or Aisan British the most severely so, with only 2.4% of respondents compared to 8.7% of the British population (6.3% difference).
The majority of participants took part for the financial benefits, be they savings or rewards. Of those surveyed by ESO, 76% selected this as their main motivation.
Beyond this, 41% of households were motivated by the challenge of responding and 37% by balancing the grid.

The actions taken by participants to reduce demand varied, with the majority (three-in-four) shifting demand, according to the Centre for Net Zero’s research. For example, shifting the times they used high-load appliances, such as heating or ovens, by an hour, to avoid the DFS session.
Around one-in-two participants reported “demand destruction” in at least one event, according to the research. This is where the demand is completely removed – for example, households who chose to go for a walk instead of putting on the television and did not subsequently watch an extra hour of television later to make up for it.
The Centre for Net Zero’s research found that 17% of participants manually switched off appliances, while the rest scheduled them to either come on before or after the event.
What did the demand flexibility service achieve?
Overall, DFS was considered a success, delivering a total of 3,300MWh of electricity reduction across the 22 events, according to ESO. This is nearly enough to power 10m homes for an hour during peak times across the island of Great Britain.
Through demand reduction, DFS is considered to have avoided a total of 681tCO2.
Great Britain was spared blackouts over the winter of 2023/24 – while services such as DFS played a role in helping to keep the grid balanced and secure during this time. Favourably warm weather, among other factors, also played a role.
Additionally, DFS provided financial benefits to participants. For example, CUB, a family-run commercial energy and utilities consultants business, introduced the CUB Reduction Reward Scheme, allowing its customers to participate in DFS.
In a case study released by ESO, it highlighted that throughout six events, there was an average of 86 businesses taking part in each through the CUB Reduction Reward Scheme. Participants ranged from using 14,000 kilowatt hours (kwh) to 14,000,000kwh per annum.
As of 30 January, participants had earned £34,025, with one business earning £1,726 in one event. Over these events, CUB delivered 12MWh of energy reduction, and avoided 945kg of carbon emissions.
With regard to the domestic market, 13 sessions were offered to 1.4m Octopus Energy customers over the course of last winter, via financial incentives. Overall, the company’s “Saving Sessions” resulted in a reduction in energy demand of 12-25%.

The trial also managed to answer several questions around the potential of demand schemes and the challenges they may face.
For example, the impact of cold weather on the willingness of participants to reduce their demand was an area in need of data, with heating being one of the easier and more common energy uses to turn down during DFS sessions.
Those who opted into Octopus’s Saving Sessions on cold winter days provided a “mean average turndown” of 0.2kW, a similar level to mild or warm days. If this was scaled to the UK’s 30m households at the same rate of participation (one-in-three), the company estimates that would equate to around 2GW of consumer flexibility on cold winter days.
This is roughly equivalent to the entire capacity of Britain’s contingency coal power plants.

Did the demand flexibility service offer value for money?
Overall, ESO paid households and businesses nearly £11m to reduce their power use during the DFS period of 2022/23.
As such, the average cost per megawatt hour of reduced electricity was around £3,330/MWh across the 22 sessions. While this is relatively high, it is also reflective of the scarcity of the use of the service. This is not a cost paid out consistently, but only in the tightest of periods where the alternative options were expensive fossil-fuel generators.
During the same winter, some gas-fired power plants cost up to £6,000/MWh, for example.
Across the two live events, ESO paid more than £3m to suppliers, split between around £850,000 during the shorter event on Monday 23 January and £2.1m for the longer session on Tuesday 24 January.
These arguably provide a clearer picture of what this service could cost in the future, given they allow suppliers to bid what they are happy to pay as opposed to the guaranteed price offered during the test sessions.
For example, during the first live session on Monday 23 January, 400,000 customers participated and were given £3.37/kWh of electricity demand they reduced. Customers were offered £4/kWh on Tuesday 24 January, as ESO accepted a higher bid.
By contrast, ESO’s other additional measure for the winter of 2022/23 was to contract five coal units to stay online under contingency contracts. This was estimated to cost between £340m and £395m, subject to the procurement and use of the coal.
While the coal units were “warmed” six times, according to the Centre for Net Zero’s research, they were not ultimately used. ESO paid approximately £6,000/h to the plants that were warmed, in order to synchronise them with the grid frequency.
ESO has not contracted them for the coming winter.
DFS cost approximately £10.5m in total meaning 2.7% of the capacity payments were spent on the contingency coal contracts.
The Centre for Net Zero’s research, completed a welfare analysis to explore what the marginal social benefits of the policy were with regards to the net cost to the government.
In doing so, it found Octopus’ Saving Sessions demonstrated a marginal value of public funds (MVPF) – which is calculated by dividing the beneficiaries’ willingness to pay by the net costs of the policy – of between 1.05 and 2.6.
This metric shows that the welfare impacts of DFS are sensitive to the extent to which demand response reduces the likelihood of “lost load”, namely, the security of the electricity supply. If it is considered to have reduced the likelihood of a blackout, the MVPF is high, with 2.6 larger than many other popular policy programs, such as housing vouchers, job training, cash transfers, and adult-health subsidies, according to the Centre for Net Zero.
The report notes that during DFS events – when the grid was particularly strained – a marginal unit of electricity would have been sourced from a carbon-intensive gas or coal-fired power plant. These would incur a “marginal private cost” of £835/MWh on average for the ESO, with a maximum of £5,500/MWh, plus the social cost of continued fossil fuel reliance.
It is a difficult balance for the operator to ensure the service offers value for money, while paying consumers enough to make participation attractive.
Lucy Yu, the Centre for Net Zero’s CEO, tells Carbon Brief:
“The DFS is one of the biggest innovations the grid has seen in years. Our analysis shows consumers can offer gigawatt-scale flexibility, at good value for public money. This value exceeds policy spending in areas such as adult education, healthcare and housing.”
According to figures from Octopus in January, the average saving for a household was 23p for each test event. Some participants saved up to £4.35 for each session.
During the first live test, the largest savings seen by domestic users were about £8.75 for the hour.
The supplier estimates that a customer that reduced its demand by 1kWh during 25 events at an average of £4/kWh – as seen in the second live event – could save £100 over a winter.
What will the service look like in winter 2023-24?
DFS has been reintroduced for winter 2023/24. It began on 1 November, with the first test event taking place on 16 November. The first live event has now been announced for 29 November.
As with last year, ESO will run 12 incentivised test events that consumers and businesses can participate in. A guaranteed acceptance price of £3/kWh will be on offer to suppliers, aggregators and businesses for at least six of the test events.
According to the surveys conducted by the Centre for Net Zero, 92% of customers were “very interested” in continuing to participate in future sessions year-round.
DFS remains in a trial stage, with lessons yet to be learnt before it could be truly integrated into the ESO’s system stability services. As such, there are a number of changes made to this year’s service, including the lead time given by the ESO, changes to metering requirements and the ability for providers to make the service “opt-out” rather than “opt-in”.
While the DFS is currently only used to reduce demand, there is also the potential that such a system could be used in the future to manage periods of high generation on the system.
For example, during a period of low demand, such as in the middle of the night, when there is high wind generation. Currently, wind generation has to be “curtailed” to protect the system if there is more generation than demand. DFS could be used to increase demand to take advantage of such periods.
Of those surveyed by the Centre for Net Zero, 81% said they were interested in using more energy to avoid curtailment.
Yu tells Carbon Brief:
“As the energy system evolves to optimise demand closer to real-time, it is important to understand the role schemes such as the DFS might play – including as an important contingency resource targeted at times and locations where it is needed most.
“In the near term, it is a critical tool that allows us to raise consumer awareness of demand response, scale flexibility behaviours and deliver meaningful value to both the grid and households, transforming the relationship between the two.”


The post Q&A: How Great Britain’s ‘demand flexibility service’ is cutting costs and CO2 emissions appeared first on Carbon Brief.
Q&A: How Great Britain’s ‘demand flexibility service’ is cutting costs and CO2 emissions

Scientists have vowed to keep working on the next flagship set of reports for the Intergovernmental Panel on Climate Change (IPCC), after a political row over the timeline for their release saw its latest session suspended on Friday evening without agreement.
During the weekend, government officials and scientists alike expressed disappointment over the inability to reach a compromise before some delegates from developing countries and small island states had to leave the week-long meeting in Ethiopia to catch flights home.
The disagreement – which has persisted since early 2024 – turns on whether the three key parts of the AR7 assessment should all be published before the conclusion of the UN’s next Global Stocktake of global climate action, which is due to be completed in late 2028.
The IPCC issued a statement after the close of the session, saying that “key agenda items” – the timelines for the three AR7 reports, as well as the IPCC budget – remain open and under discussion. It said the IPCC’s plenary session and its deliberations on the pending agenda “will resume at the earliest opportunity”, giving no further details of when.
IPCC Chair Jim Skea told delegates in closing remarks that recent months had been some of the most turbulent for the climate science panel and that, if there were stronger words than “profound disappointment” he would use them, according to a summary published by the Earth Negotiators Bulletin (ENB). IPCC discussions happen behind closed doors.
IPCC scientists remained committed
In an open letter, issued on Monday, a group of nearly 120 scientists – from a total of 664 AR7 authors – said they “stand committed to continue working to deliver the AR7 reports in a manner that is rigorous, timely and inclusive, in line with our mandate to be policy-relevant”.
“An assessment that arrives after the decisions it is meant to inform cannot serve its purpose,” they emphasised. “The second Global Stocktake in 2028 is such a decision point, and the world should not have to face it without the IPCCʼs latest assessment.”
Europe, small islands and the least developed countries, plus many Latin American and developed nations, want the IPCC to meet this deadline, arguing that the findings from the UN climate science body are irreplaceable in the UN climate policy-making process.
However, around a dozen developing countries plus Russia have argued that the reports should come later in order to allow for greater research input from the Global South – something that, in their view, would make the findings fairer. They also claim that a shorter timeline would put excessive pressure on experts.
-
Who shapes climate science? The equity question facing the IPCC
Early completion of the next global climate science assessment reports risks excluding research from the Global South, which is key to ensuring the findings are fair -
Governments that support climate science must stand firm against naysayers
The IPCC is meeting to decide the timing of its next major report, as some countries try to delay it and weaken the case for faster emissions cuts


The most vocal of this group at last week’s meeting were India and Saudi Arabia, according to the ENB summary and a developed country diplomat. Critics see this push for a longer timeline as an excuse to deprive government decision-makers of the latest science and ease pressure on emerging economies to raise their ambition, particularly on cutting emissions.
Commenting on last week’s meeting, France’s ambassador for climate negotiations Benoît Faraco said a broad coalition of developed and developing countries from all five continents, “united in their support for science and the timeline proposed by scientists”, had withstood pressure “from a few countries” seeking to slow down the process of adopting the IPCC reports.
He added that France would not back down and would “continue to fight tirelessly for science, protect the integrity of information, and convince our partners that without the best available scientific data, we will be less effective in tackling climate change and protecting our populations”.
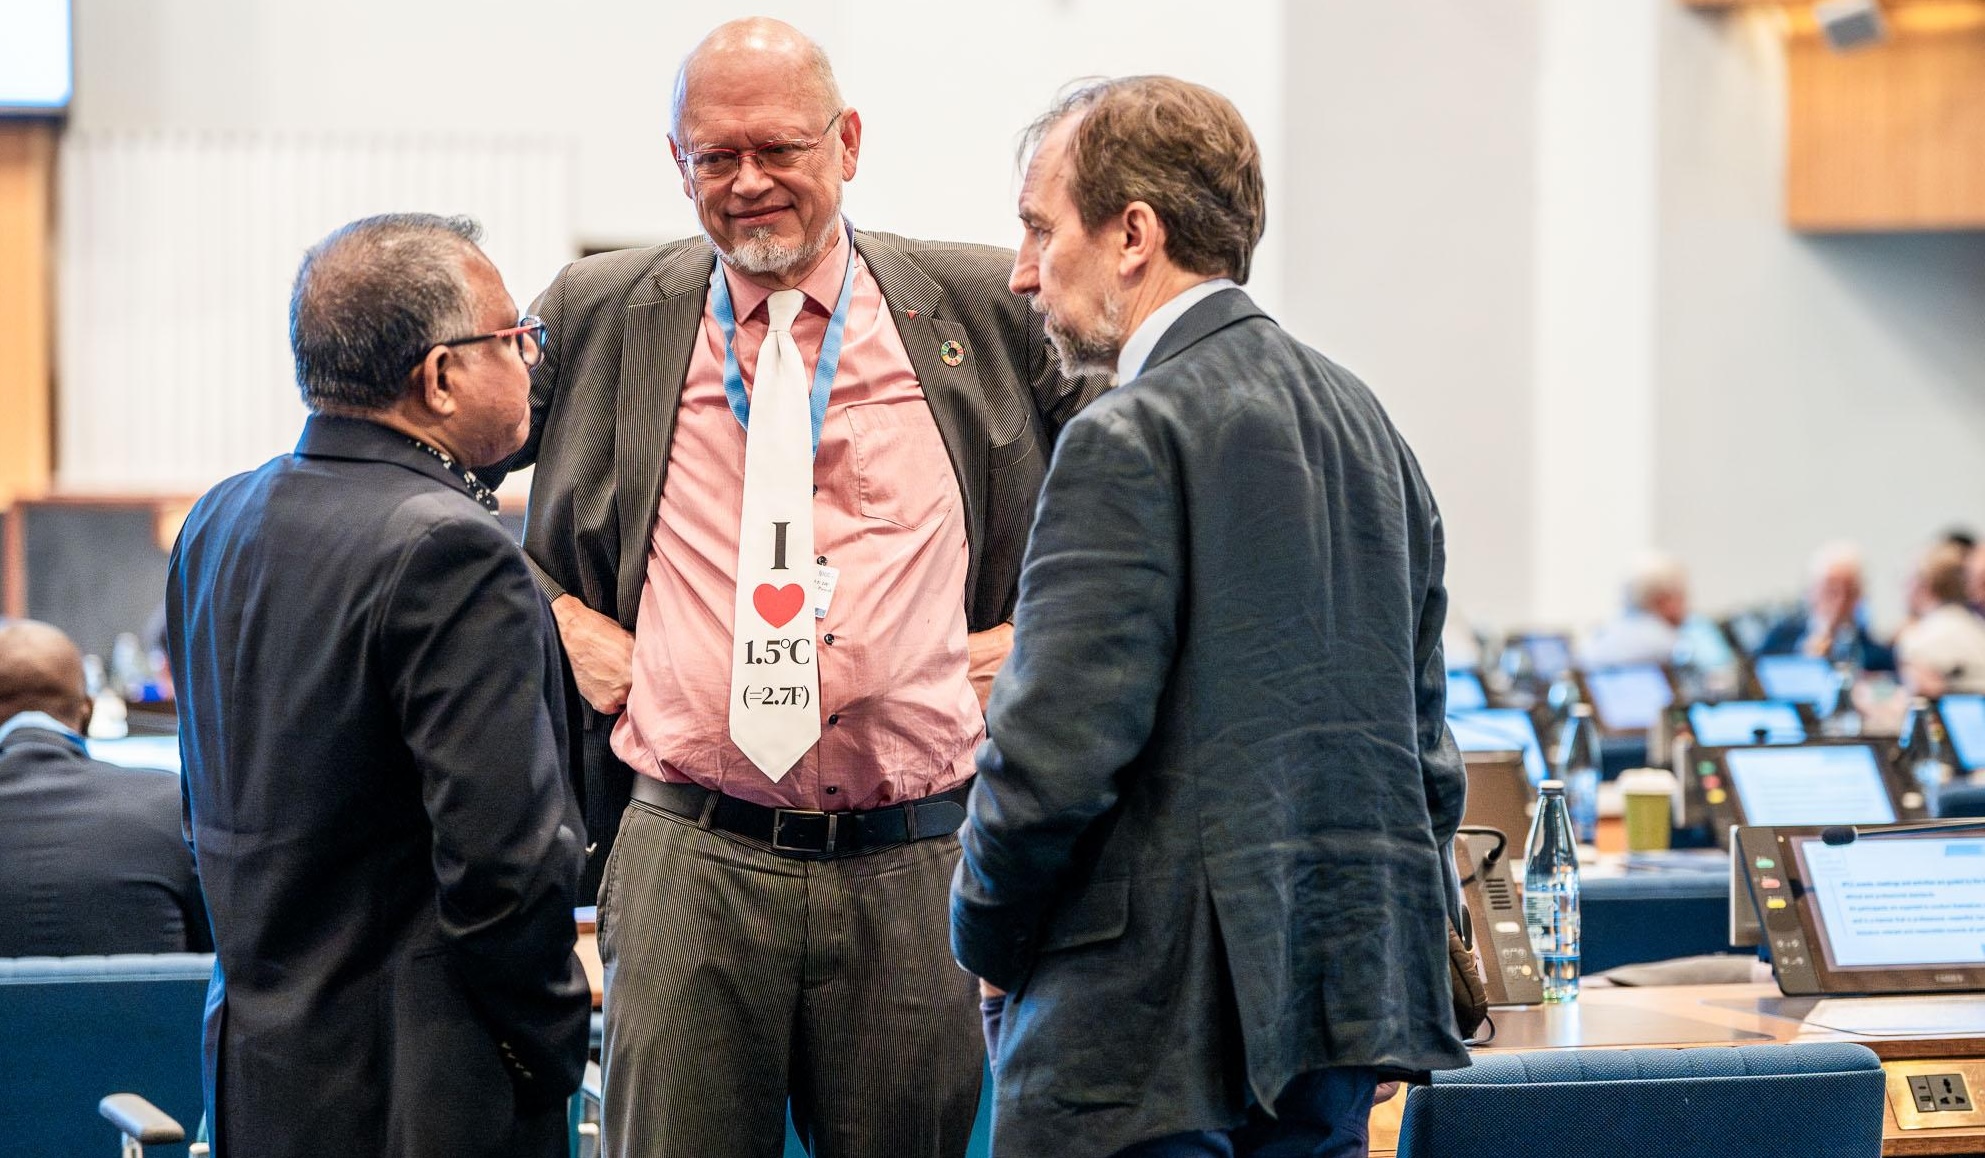
Inclusivity proposal stalled
In a bid to unlock a solution for the AR7 timeline, countries discussed ways to improve the inclusivity of the IPCC’s work. One option put on the table was for the IPCC to expand its funding for delegates from developing countries to attend some or all of its sessions from one to two participants, according to the ENB summary and a delegate speaking to Climate Home News.
That would increase the costs for the IPCC to complete AR7 by up to a quarter, according to an assessment shared by the secretariat. The panel’s budget is under severe strain and its officials have warned that, without additional voluntary contributions, it risks running out of money before it can deliver on this assessment cycle.
Climate Home News understands that some of the IPCC’s traditional donors – which mainly include European countries, Japan and Australia – indicated a willingness to support funding for an additional developing country participant. But without an agreement over the budget or the timeline for the reports, that option was ultimately not adopted.
‘Disappointed and worried’
The three reports are managed by working groups that collate and draw overall findings from the latest scientific studies and data on the physical effects of global warming around the world, how to adapt to it, and pathways for cutting planet-heating emissions in order to meet the temperature goals of the Paris Agreement.
Winston Chow, an urban climate professor at Singapore Management University who co-chairs Working Group II on adaptation, wrote in a LinkedIn post that he was “disappointed and worried” for the IPCC authors who have worked “extraordinarily hard” to assess the relevant climate science over the past two years.
He said he shared their concern that “the rigour, time and goodwill they’ve invested are now being put at risk by the Panel’s stalemate”.
As science comes under attack at UN talks, climate movement splits over how to respond
For Working Group II, a meeting for 250 experts writing that report is scheduled for January 2027, followed by the approval of a special report on cities and climate change in Singapore next March.
But because the IPCC’s budget has not been confirmed due to uncertainty about the AR7 schedule, travel support for those researchers is at risk, wrote Chow. “If they cannot participate, our assessments will lose vital expertise, perspectives and scientific breadth, and the collective effort of our authors will be undermined,” he warned.
Scientific work continues
Despite the political holdups, he – together with French climate scientist Robert Vautard, co-chair of Working Group 1 – agreed with IPCC head Skea who told the IPCC’s closing session on Friday: “The engine room of the IPCC is working, and it’s healthy.”
Vautard commented in a separate post on LinkedIn after it ended: “The boat is at full steam.” Working groups I and II are due to start revising the first drafts of their reports, while Working Group III on reducing emissions is finalising its first draft which will be out soon, he wrote.
“The most exciting two years of the cycle are ahead, for the authors. The momentum in the engine room is here and now. Trust the engine room!” he added.
The IPCC and some scientists report that progress has been made towards achieving an equitable balance of authors from the Global North and the Global South.
The group of researchers who signed the open letter on Monday noted that “inclusivity is at the heart of how we work”, with author teams bringing together experts from developed and developing countries with diverse backgrounds and at different stages of their careers.
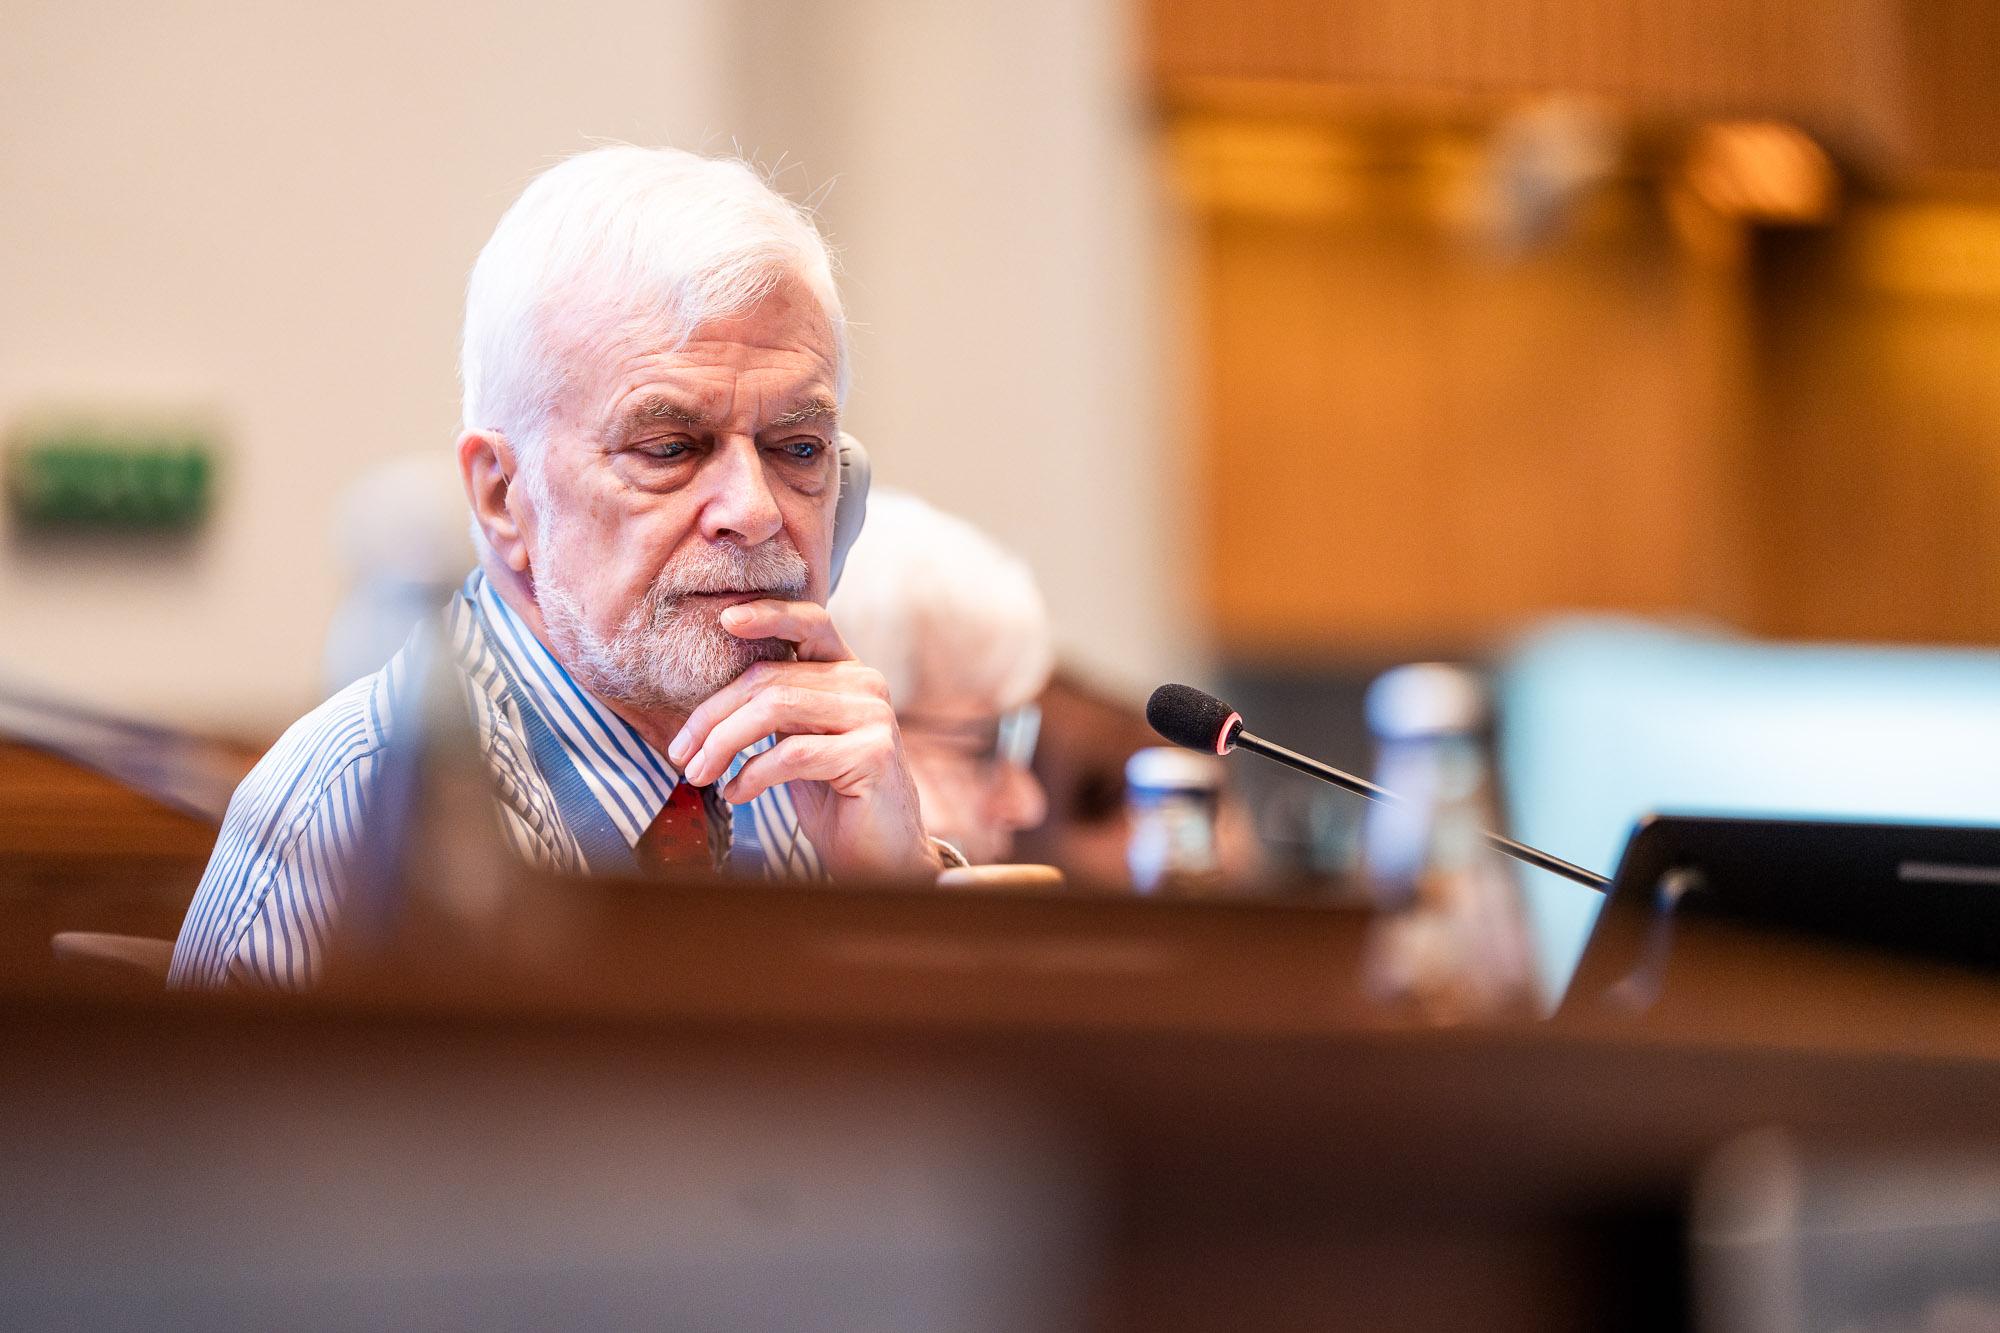
Plea to overcome political differences
The signatories include several scientists from some of the countries opposed to the alignment of all IPCC reports with the Global Stocktake.
“We are committed to an assessment in which the knowledge, experience and priorities of every region are fully reflected, a commitment we share with the leadership of the IPCC.
Equity is built into how our assessment is being drafted,” they added.
They appealed to governments that make up the IPCC “to overcome their political differences and work together as we do as a global scientific community, so that we can deliver the IPCC reports the world needs to hear”.
In a statement published on Monday, IPCC chair Skea said reaching consensus on the schedule for the reports is “vital”. He added that the assessments provide authoritative scientific evidence to inform national climate policies, strengthen adaptation and resilience and support access to climate finance, as well as helping communicate the scale of the climate crisis and the urgency of efforts to tackle it.
The post