Connect with us

Published

on

Nearly a decade on from the Paris Agreement, there is still not an agreed way to measure progress towards its “global goal on adaptation” (GGA).

Yet climate impacts are increasingly being felt around the world, with the weather becoming more extreme and the risk to vulnerable populations growing. 

At COP30, which takes place next month, negotiators are set to finalise a list of indicators that can be used to measure progress towards the GGA.

This is expected to be one of the most significant negotiated outcomes from the UN climate summit in Belém, Brazil.

In a series of open letters running up to the summit, COP30 president-designate André Corrêa do Lago wrote that adaptation was “no longer a choice” and that countries needed to seize a “window of opportunity”:

“There is a window of opportunity to define a robust framework to track collective progress on adaptation. This milestone will…lay the groundwork for the future of the adaptation agenda.”

However, progress on producing an agreed list of indicators has been difficult, with nearly 90 experts working over two years to narrow down a list of almost 10,000 potential indicators to a final set of just 100, which is supposed to be adopted at COP30.

Below, Carbon Brief explores what the GGA is, why progress on adaptation has been so challenging and what a successful outcome would look like in Belém.

What is the GGA?

What progress has been made?

Why is it hard to choose adaptation indicators?

What to expect from COP30?

What will the GGA mean for vulnerable communities?

What is the GGA?

The GGA was signed into being within the Paris Agreement in 2015, but the treaty included limited detail on exactly what the goal would look like, how it would be achieved and how progress would be tracked.

The need to adapt to climate change has long been established, with the UN Framework Convention on Climate Change, adopted in 1992, noting that parties “shall…cooperate in preparing for adaptation to the impacts of climate change”. 

In the subsequent years, the issue received limited focus, however. Then, in 2013, the African Group of Negotiators put forward a proposed GGA, setting out a target for adaptation.

This was then formally established under article 7.1 of the Paris text two years later. The text of the treaty says that the GGA is to “enhanc[e] adaptive capacity, strengthen…resilience and reduc[e] vulnerability to climate change”.

Paris Agreement text, showing the GGA under article 7.1.
Paris Agreement text, showing the GGA under article 7.1. Source: UNFCCC.

According to the World Resources Institute (WRI), the GGA was designed to set “specific, measurable targets and guidelines for global adaptation action, as well as enhancing adaptation finance and other types of support for developing countries”. 

However, unlike the goal to cut emissions – established in article 4 of the Paris Agreement – measuring progress on adaptation is “inherently challenging”.

Emilie Beauchamp, lead for monitoring, evaluation and learning (MEL) for adaptation at the International Institute for Sustainable Development (IISD), tells Carbon Brief that this challenge relates to the context-specific nature of what adaptation means. She says: 

“The main [reason] it’s hard to measure progress on adaptation is because adaptation is very contextual, and so resilience and adapting mean different things to different people, and different things in different places. So it’s not always easy to quantify or qualify…You need to integrate really different dimensions and different lived experiences when you assess progress on adaptation. And that’s why it’s been hard.”

Beyond this, attribution of the impact of adaptive measures remains a “persistent challenge”, according to Dr Portia Adade Williams, a research scientist at the CSIR-Science and Technology Policy Research Institute and Carbon Brief contributing editor, “as observed changes in vulnerability or resilience may result from multiple climatic and non-climatic factors”. She adds:

“In many contexts, data limitations and inconsistent monitoring systems, particularly in developing countries, constrain systematic tracking of adaptation efforts. Existing monitoring frameworks tend to emphasise outputs, such as infrastructure built or trainings conducted, rather than outcomes that reflect actual reductions in vulnerability or enhanced resilience.”

Despite these challenges, the need for increased progress on adaptation is clear. Nearly half of the global population – around 3.6 billion people – are currently highly vulnerable to these impacts. This includes vulnerability to droughts, floods, heat stress and food insecurity. 

However, for six years following the adoption of the Paris Agreement, the GGA did not feature on the agenda at COP summits and there was limited progress on the matter. 

This changed in 2021, at COP26 in Glasgow, when parties initiated the two-year Glasgow-Sharm el-Sheikh work program to begin establishing tangible adaptation targets. 

This work culminated at COP28 in Dubai, United Arab Emirates, with the GGA “framework”. 

Agreeing the details of this framework and developing indicators to measure adaptation progress has been the main focus of negotiations in recent years.

Back to top

What progress has been made?

Following the establishment of the GGA, there was – for many years – only limited progress towards agreeing how to track countries’ adaptation efforts.

COP28 was seen as a “pivotal juncture” for the GGA, with the creation of the framework and a new two-year plan to develop indicators, which is supposed to culminate at COP30. 

Negotiations across the two weeks in Dubai in 2023 were tense. It took five days for a draft negotiating text on the GGA framework to emerge, due to objections from the G77 and China group of developing countries around the inclusion of adaptation finance.

Within the GGA – as with many negotiating tracks under the UNFCCC – finance to support developing nations is a common sticking point. Other disagreements included the principle of “common but differentiated responsibilities and respective capabilities” (CBDR–RC). 

Ultimately, a text containing weakened language around both CBDR-RC and finance was waved through at the end of COP28 and a framework for the GGA was adopted.

Speaking to Carbon Brief, Ana Mulio Alvarez, a researcher on adaptation at thinktank E3G,  said that the framework was the “first real step to fulfilling” the adaptation mandate laid out in the Paris Agreement, adding: 

“The GGA is the equivalent of the 1.5C commitment for mitigation – a north star to guide efforts. It will be hugely symbolic if the GGA indicators are agreed at COP and the GGA can be implemented.”

The framework agreed at COP28 includes 11 targets to guide progress against the GGA. Of these, four are related to what it describes as an “iterative adaptation cycle” – risk assessment, planning, implementation and learning  – and seven to thematic targets.

These “themes” cover water, food, health, ecosystems, infrastructure, poverty eradication and cultural heritage.

Within these, there are subgoals for countries to work towards. For example, within the water theme, there is a subgoal of achieving universal access to clean water.

While this framework was broadly welcomed as a step forward for adaptation work, there remains concern from some experts about the focus of the programme.

Prof Lisa Schipper, a professor of development geography at the University of Bonn, Intergovernmental Panel on Climate Change (IPCC) author and Carbon Brief contributing editor, tells Carbon Brief that without the framework there would likely have been continued delays, but there was still “significant scientific pushback against this approach to adaptation”. 

She notes that the IPCC’s sixth assessment report (AR6) “didn’t necessarily provide any concrete inputs that could be useful for the GGA”. Beyond this, there are political challenges that the framework does not address, Schipper adds, continuing:

“There are also political reasons why global-north countries or annex-one countries don’t necessarily want specificity [in adaptation targets], because they also don’t want to be held accountable and to be forced to pay for things, right? So, the science was pathetic in one way, it was just not sufficient. And then you have a political agenda that’s fighting against clarity on this. 

“So, even though [the framework] came together, it was still not very concrete, right? It was a framework, but it didn’t have a lot in it.”

As with the language around finance, thematic targets within the GGA were weakened over the course of the negotiations. Additionally, parties ultimately did not agree to set up a specific, recurring agenda item to continue discussing the GGA.

However, a further two-year programme was established at COP28. The UAE-Belém work programme was designed to establish concrete “indicators” that can be used to measure progress on adaptation going forward.  

Back to top

Why is it hard to choose adaptation indicators?

In the two years following COP28, work has been ongoing to narrow down a potential list of more than 9,000 indicators under the GGA to just 100.

At the UNFCCC negotiations in June 2024 in Bonn, parties agreed to ask for a group of technical experts to be convened to help with this process.

This led to a group of 78 experts meeting in September 2024. They were split into eight working groups – one for each of the seven themes and one for the iterative adaptation cycle – to begin work reviewing a list of more than 5,000 indicators, which had already been compiled from submissions to the UNFCCC. 

In October 2024, a second workshop was held under the UAE-Belém work programme, at which the experts agreed that they should also consider an additional 5,000 indicators compiled by the Adaptation Committee, another body within the UN climate regime. 

One key challenge, Beauchamp tells Carbon Brief, was that the group of experts had very limited time and a lack of resources. She expands:

“They had to finish their work by the end of the summer [of 2025]. This means they’ve not even had a year [and] they have no funding. So of the 78 experts, the number of whom could actually contribute was much lower, and it’s not by lack of desire and expertise. But [because] they have day jobs, they have families…And the lack of clear instructions from parties also didn’t help.”

COP29 formed the mid-way point in the work programme to develop adaptation indicators, with parties stressing it was “critical” to come away with a decision from the summit.

As with previous sessions, finance quickly became a sticking point in negotiations, however, alongside the notion of “transformational adaptation”. 

This is a complex concept centred around the idea of driving systemic shifts – in infrastructure, governance or society more broadly – so as to address the root causes of vulnerability to climate change. 

Ultimately, COP29 adopted a decision that made reference to finance as “means of implementation” (MOI), recognised transformational adaptation and launched the Baku Adaptation Roadmap (BAR). The BAR is designed to advance progress towards the GGA, however, the details of how it will operate are still unclear.  

Going into the Bonn climate negotiations in June 2025, the list of potential indicators had been “miraculously” refined to a list of 490 through further work by the group of experts. While this was a major step forward, it was still a long way off the aim of agreeing to a final set of just 100 indicators at COP30. 

Once again, disagreement quickly arose in Bonn around finance and this dominated much of the two weeks of negotiations. As such, a final text did not get uploaded until mid-way through the final plenary meeting of the negotiations. 

This was seen as contentious, as some parties complained that they did not have time to fully assess it, before it was gavelled through.

Bethan Laughlin, senior policy specialist at the Zoological Society of London, tells Carbon Brief: 

“Adaptation finance has consistently lagged behind mitigation for decades, despite growing recognition of the urgent need to build resilience to climate shocks. The gap between the needs of countries and the funding provided is stark, with an adaptation financing gap in the hundreds of billions annually.

“Within the GGA negotiations, the implications of this finance issue are clear. Disagreements persist over how MoI [finance] should be measured in the indicator set, particularly around whether private finance should count, how support from developed countries is defined, and how national budgets are tracked versus international climate finance.”

The final text produced in Bonn was split into two, with an agreed section capturing the GGA indicators and a separate “informal note” covering the BAR and transformation adaptation. 

Importantly, the main text invited the experts to continue working on the indicators and to submit a final technical report with a list of potential indicators by August 2025.

As this work continued, one of the biggest challenges was “balancing technical rigour with political feasibility while ensuring ambition”, says Laughlin, adding:

“The scale and diversity of adaptation action means a diverse menu of indicators per target is needed, but this must not be so vast as to be unfeasible for countries to measure, especially those countries with limited resources and capacity.”

Meetings took place subsequently, within which experts focused on “ensuring adaptation relevance of indicators, reducing redundancy and ensuring coverage across thematic indicators”, according to a technical report

Beauchamp notes the importance of these themes for continued work on adaptation, saying:

“The themes were really helpful to bring some attention and to communicate about the GGA. They echo more easily what adaptation results can look like, because people find it difficult to talk about processes. But they’re really important. Without the targets on the adaptation cycle, we can too easily forget that you need resilient processes to have resilient outcomes.”

The table below, from the same technical report, shows how nearly 10,000 adaptation indicators have been whittled down to a proposed final list of 100. The table also shows how the indicators are split between the themes (9a-g) and iterative adaptation cycle (10a-d) of the GGA framework.
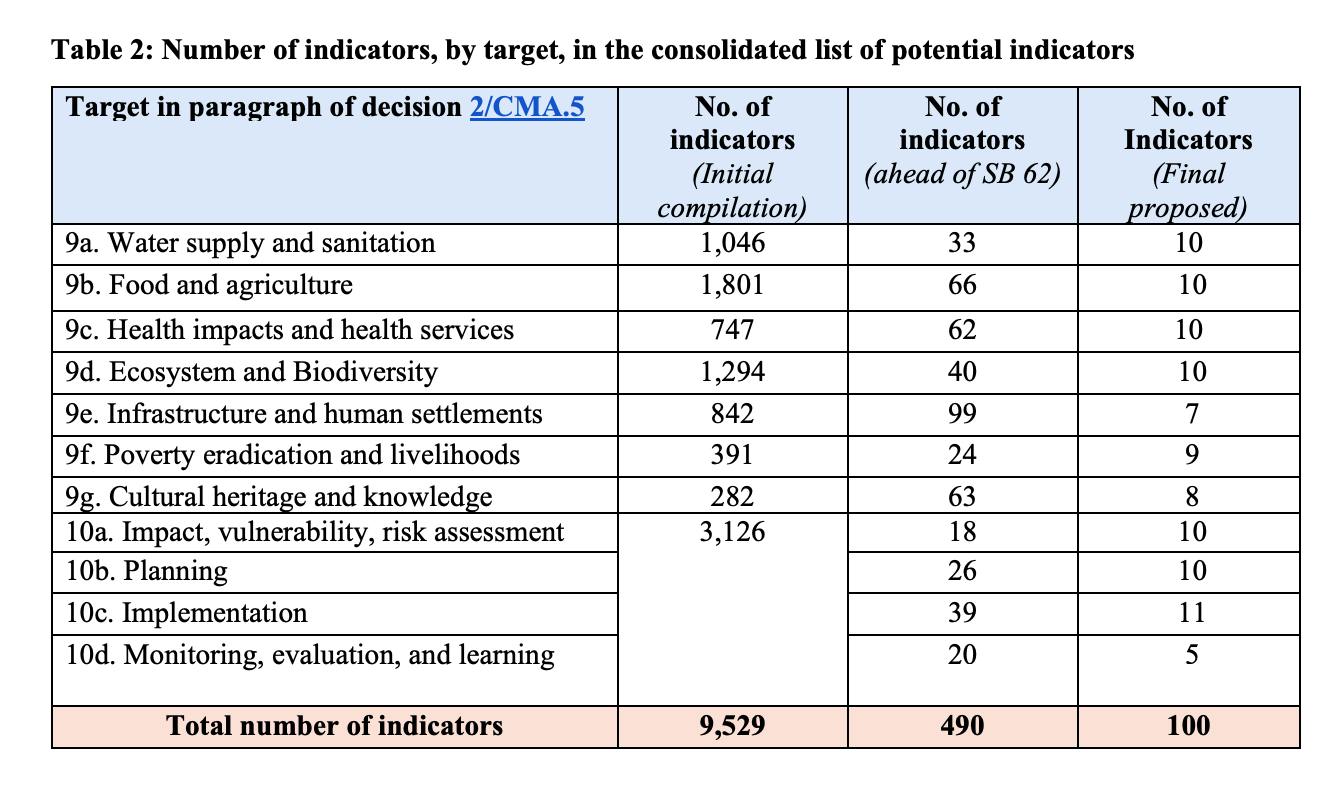
Number of indicators, by target, in the consolidated list of potential indicators

Source: GGA technical report.

Further consultations took place in September and the final workshop under the UAE-Belém work programme took place on 3-4 October.

Following on from the numerous sessions held under the GGA, negotiators are now able to go into COP30 with a consolidated list of indicators to discuss, agree and bring into use, allowing progress towards the adaptation goal in Paris to be finally measured.

Back to top

What to expect from COP30?

A final decision on the adaptation indicators is expected at COP30, potentially marking a significant milestone under the GGA.

In his third letter, COP30 president-designate Correa do Lago noted that a “special focus” was to be given to the GGA indicators at the summit. 

He wrote that adaptation is “the visible face of the global response to climate change” and a “central pillar for aligning climate action with sustainable development”.

Therefore, he said COP30 should focus on “delivering tangible benefits for societies, ecosystems and economies by advancing and concluding the key mandates in this agenda”. These “key mandates” are the GGA and the related topic of National Adaptation Plans (NAPs). 

Correa do Lago’s letter added:

“There is a window of opportunity to define a robust framework to track collective progress on adaptation. This milestone will also lay the groundwork for the future of the adaptation agenda.”

Indeed, adaptation has moved up the political agenda this year, with the topic being discussed during the “climate day” at the UN general assembly in September. This included a “leaders’ dialogue” on the sidelines of the assembly, where Carbon Brief understands that leaders of climate-vulnerable nations pushed for specific adaptation targets.

Elsewhere, nearly three-quarters (73%) of new country climate pledges include adaptation components, further emphasising the increased focus the topic is now receiving. 

Despite the increased attention, there are still likely to be challenges at COP30, including the continued fight over finance. This will likely be felt particularly keenly, given that the COP26 commitment to double adaptation finance comes to an end this year.

This was part of the “Glasgow dialogue”, which saw parties commit to “at least double” adaptation finance between 2019 and 2025.

Adade Williams tells Carbon Brief:

“A major expectation [at COP30] is that parties will tackle the gaps in adaptation finance, consider how to link MoI – finance, technology, capacity‐building – with the GGA indicators and possibly set new finance ambitions or roadmaps. The emphasis on MoI means capacity building, data systems, technology transfer and institutional strengthening will gain more traction.”

Adaptation finance was also a key topic during pre-COP meetings in Brasilia in October, with E3G noting that it is a “political litmus test for success in Belém, with vulnerable countries signalling urgency and demanding greater clarity that finance will flow”.

Laughlin tells Carbon Brief that she expects discussions on finance to “dominate in Belém” – in particular, given the legacy of the “new collective quantified goal” (NCQG) for climate finance agreed at COP29, which many developing countries were “starkly disappointed” by. 

Additionally, there may be challenges around the process of negotiations on the GGA indicators, notes Beauchamp, adding:

“We’ve not agreed yet if it is acceptable to open up text of some indicators [to negotiation]. We have 100 of them and, as a technical expert, on one hand [it] is quite worrying, because changing one term in an indicator can change its entire methodology, right? But, at the same time, there is definitely more work that can be done on the indicators.

“So, are we only keeping indicators that can work or that everybody is happy with now, and then we review the set later, for example, with the review of the UAE framework in 2028? Or do we open the whole Pandora’s box and then we start hashing out some new indicators? That’s the first big challenge parties need to grapple with at COP30.”

Despite the challenges, Mulio Alvarez says she would expect a final list of indicators to be adopted at COP30, even if some change during the negotiation process. She adds:

“The Brazilian presidency knows that this is the biggest negotiated outcome of COP30 and they want it to go through smoothly. The adoption of the list would officially launch the UAE framework so that it can begin to track and guide efforts.”

While agreement on indicators would be seen as a political win at COP30, several experts highlighted that it is only a step towards enabling further adaptation work, with Beauchamp noting that parties “need to see this as an opportunity”.

Laughlin adds:

“Although finalising the indicator list is a core deliverable, it is also important that COP30 makes progress on the next steps for the GGA following COP30, including the expectations for reporting, and regular updates to the indicator list so it keeps up with the latest science.”

Back to top

What will the GGA mean for vulnerable communities?

COP30 kicks off on 10 November and negotiators are hoping to hit the ground running with the condensed list of indicators to discuss.

There remain key questions about what the GGA could mean for adaptation around the world – in particular, for those most vulnerable to the impacts of climate change.

Speaking to Carbon Brief, Mulio Alvarez notes:

“In the short term, the GGA metrics [indicators] will likely paint a very challenging picture of the needs for adaptation. In the medium to long term, we hope the GGA will be embedded in policy planning and implementation – supporting risk assessments, helping identify gaps, driving planning and resources and even unlocking investments.”

Others are more cautious about the potential impact of the GGA, the associated framework and its indicators, in terms of driving real progress for adaptation.

Schipper notes that, while the GGA indicators are welcome from a political perspective, “from a scientific perspective, and I think from a development perspective, I think there’s a sort of a high risk that this ends up making people worse off in the end”.

She adds that the incremental approach currently being taken for adaptation is not working and that the indicators can “at best” show us incremental progress.

Schipper notes that there is a risk that the indicators narrow the approach to adaptation to the extent that they are either ineffective or actually produce maladaptive outcomes. She adds:

“I’m not saying that we should abandon the indicators, but I think it’s important to recognise that this is not enough. This is nowhere near enough.”

Others are more optimistic about the long-term potential of the GGA. Laughlin suggests that the indicators could help build systemic resilience, adding that if they were successfully implemented it could mean adaptation is integrated into national development and planning, “making sure that climate resilience becomes a core part of policymaking”. She says:

“For vulnerable populations, this means moving from a reactive approach to a proactive one – embedding resilience into development planning, restoring ecosystems and empowering local communities.

“The success of the GGA in delivering for vulnerable populations hinges on political will, finance and inclusive governance – many of which are currently lacking.”

Beyond COP30, the GGA framework agreed at COP28 includes a number of overarching targets to help guide countries in developing and implementing their NAPs, although these targets are not quantified. 

The targets include countries conducting risk assessments to identify the impact of climate change and areas of particular vulnerability, by 2030. The framework says this would inform a country’s NAP and that “by 2030 all parties have in place” adaptation planning processes or strategies, as shown in the image below.

GGA within the COP28 outcome text.
GGA within the COP28 outcome text. Source: UNFCCC.

Adade Williams tells Carbon Brief that if the GGA is “effectively implemented” it could help develop systemic resilience in the long term, helping to address “not just climate hazards but also underlying structural vulnerabilities”. She adds:

“However, this long-term potential depends heavily on the extent of political will, sustained finance and capacity support available to developing countries. Without these, the GGA risks becoming a reporting framework rather than a transformative mechanism for resilience.”

Back to top

The post Q&A: COP30 could – finally – agree how to track the ‘global goal on adaptation’ appeared first on Carbon Brief.

Q&A: COP30 could – finally – agree how to track the ‘global goal on adaptation’

Continue Reading

Climate Change

Furry Little Peach x Greenpeace

Published

on

What happens when a love of marine life meets a playful imagination?

Sydney artist, illustrator and children’s author Sha’an d’Anthes, better known as Furry Little Peach, has teamed up with Greenpeace to create Happy Ocean Happy Planet: a joyful celebration of the extraordinary creatures that call our oceans home.

Sha’an felt inspired to create an illustration celebrating the beauty and resilience of marine life. Its hopeful message, A Happy Ocean is a Happy Planet, sparked a special collaboration with Greenpeace and a limited-edition t-shirt designed to help protect the oceans that inspired it.

The exclusive Furry Little Peach tee is available as a gift to new regular Greenpeace donors who give $30 or more and make at least three donations. By becoming a regular giver, you’ll help Greenpeace campaign for ocean protection.

Furry Little Peach Sha'an d'Anthes x Greenpeace

ARTIST INTERVIEW: Sha’an d’Anthes (Furry Little Peach)

Sha’an shares the story behind the artwork, the local marine creatures featured in the design and why hope can be such a powerful force for action.

Hi Sha’an! Can you tell us a little about yourself and what you do?

My name is Sha’an d’Anthes, I also go by the pseudonym Furry Little Peach and I’m an illustrator, artist and children’s author based in Sydney, Australia. I love creating joyful, vibrant and nostalgic art that looks at the world through the lens of childlike wonder.

What do you love about drawing animals and nature?

I love all of the different shapes, colour and narrative you get to explore when drawing animals and nature. I’m also a city-slicker these days, and so I think that my work is a sort of escapism (for myself and hopefully for my audience).

How did the Greenpeace collaboration come about?

I went to the premiere of David Attenborough’s documentary Ocean, and felt compelled to create something to share the message of the film. This t-shirt is actually based off of that illustration including the tagline in I included when I shared it “A Happy Ocean is a Happy Planet”. I’m so grateful Greenpeace approached me for the project – it was a blast.

Where did you start when creating the Happy Ocean Happy Planet design?

The Happy Ocean tee starts the same as all of my work – with a brainstorm/braindump and really loose concept sketches.

How did you choose the animals for the illustration?

I actually asked Greenpeace to help me with the research of local marine life and they were so accommodating. They very quickly delivered me a huge list of local species of fish, mammals and coral and I just went through and looked up each creature and curated a little group of sea life that I thought would look sweet together – a mix of sizes, types, colours, textures and shapes.

What did you use to create the artwork?

So much of my work is traditional, but when it comes to things like t-shirts I always use digital drawing programs because I like to draw each colour in a separate layer which requires me to jump in and out of layers because it allows me to control colour and printing. When working digitally I always sketch in Procreate (an Australian digital art app), and then with this project I created final art in Adobe Fresco because it called for a vector graphic (an image that can be blown up to any size).

Do you have a favourite creature in the design?

I love painting Humpback Whales and always have, but I also have a soft spot for the sweet little Jelly Blubber jellyfish.

What did you want people to feel when they saw the artwork?

I specifically wanted to focus on the outcome that all of us want to see – a happy, thriving ocean where creatures are given the time and space to balance themselves. I feel that even when tackling tough subjects, leaning into hope is my natural inclination. As long as we have hope that things can be better, we will continue to take action.

What was the most fun part of creating it?

I actually documented the entire process of this project in a studio vlog on YouTube – and you can see how much fun I’m having doing final art jumping between layers and building the image. I had just come off completing final art for two books which are multi-year long projects, so being able to do a project that from start to finish in just a few days was really freeing at the time.

Watch Sha’an’s Full Vlog

What does a “happy ocean” mean to you?

An ocean that given the time and space to repair and balance itself. Something I really took away from David Attenborough’s Ocean is that ocean ecosystems are actually really good at repairing themselves if we just let them do their thing.

How can people get their hands on the t-shirt?

The shirt is a reward for regular givers to Greenpeace – those who commit to at least 3 months of donations will receive the tee as a gift. Read about how at http://act.gp/flp-tee

How is Greenpeace helping to make our oceans happier places?

They have a deep focus on the health and happiness of our oceans through advocating for the set up of marine sanctuaries, holding big ocean polluters to account and calling for a ban on deep sea mining.

What are you working on next?

I will be jumping headfirst into Peachtober – an annual daily art challenge I run each year in October, if there are any artists reading this it’s a great time so please come join! In terms of publications my next picture book The Late Bird will be out in February 2027 (published by Harper Collins US) and then I have an creative activity book for adults coming out next August with Chronicle US and Penguin Australia. Otherwise you can always check out what I’m tinkering away with in my studio on Instagram and YouTube.

Furry Little Peach x Greenpeace

Continue Reading

Climate Change

AI giant Anthropic’s first Australian data centre deal an “egregious” example of Big Tech double talk

Published

on

SYDNEY, Thursday 17 September 2026 — Greenpeace Australia Pacific has slammed AI giant Anthropic’s deal for its first Australian site in Queensland’s Western Downs, the heart of coal seam gas country, saying the project will entrench gas and turbocharge climate pollution.

The expected electricity demand from the data centre site, situated in the middle of the Western Downs coal seam gas fields, is comparable to 1.5 million Australian households. Greenpeace’s report Energy Vampires: The AI data centres draining Australia called for a moratorium on frenzied data centre development until appropriate guardrails are in place.

Joe Rafalowicz, Head of Climate and Energy at Greenpeace Australia Pacific, said: “This is an egregious example of Big Tech giants being given carte blanche to drain energy and water, and use polluting gas to fuel their hyperscale data centres.

“AI and Big Tech corporations claim to bring new renewable energy to the grid, while blatantly planning to power their operations with polluting fossil fuels.

Planning documents show the first stage of this behemoth project could be powered by ‘behind the metre’ gas — the same playbook AI companies have used in the US, leading to a 20% increase in climate pollution from electricity. Now these companies want to bring their cowboy plans to Australia and the Federal Government is allowing it.

“If they plugged into the local grid, the power required would increase Queensland’s electricity grid emissions by around 6.6 million tonnes — an 18% rise. If they build their own gas-fired power plants, this will drive up Queensland’s emissions even more.

“Billions of dollars are now pouring into a massive pipeline of proposed new data centres, of unprecedented size, being built at incredible speed across the country. Australians should be worried about the extreme lack of scrutiny being applied to these projects, and the corporations leading the data centre charge.

“The data centre build-out is happening without the endorsement of the Australian people, yet we are the ones who will pay the price. We can not allow unchecked data centre expansion to derail our renewable energy transition, entrench gas and turbocharge climate pollution — that’s why Greenpeace has called for an urgent moratorium until appropriate guardrails are in place.”

ENDS

Media contact: Kate O’Callaghan on 0406 231 892 or kate.ocallaghan@greenpeace.org

AI giant Anthropic’s first Australian data centre deal an “egregious” example of Big Tech double talk

Continue Reading

Climate Change

Analysis: India’s power-sector emissions flat for two years due to clean-energy surge

Published

on

Article Contents

A surge in clean energy has kept carbon dioxide (CO2) emissions in check across India’s power sector, with no growth from the first half of 2024 to the same period in 2026.

This guest post is by:

Lauri Myllyvirta, lead analyst at Centre for Research on Energy and Clean Air (CREA) 

Anubha Aggarwal, India analyst at CREA

This is the first time in more than 50 years that there has been no growth in India’s coal power over a two-year period, even as electricity demand grew overall.

At the same time, both oil and gas consumption have fallen across the nation for two years in a row, helping alleviate the shock of the Hormuz crisis.

Nevertheless, the new six-monthly analysis for Carbon Brief shows that India’s emissions grew by 3.7% year-on-year in the first half of 2026, due to increases from steel, cement and other sectors.

Other key findings for the first half of 2026 include:

  • India’s power-sector emissions flatlined at 2024 levels, after a 2.2% decline in the first half of 2025 and a 2.3% rise in the same period this year.
  • Clean energy met all of the 7% rise in India’s electricity demand over the two years, adding 63 terawatt hours (TWh), equivalent to the total demand of Switzerland.
  • India has added 77 gigawatts (GW) of solar in this two-year period, helping meet 60% of the rise in electricity demand overall.
  • While fossil-fuel generation stagnated, generators added 8.5GW of new coal capacity, leading to fewer running hours and increased costs to electricity consumers.
  • CO2 emissions from oil and gas fell by 7% year-on-year, extending a reduction that began in 2025, despite higher demand for road transport fuels.
  • Steel and cement emissions grew by 8% year-on-year, reaching a 23% share of India’s total CO2 in the first half of 2026.

If the pace of India’s clean-energy expansion is to continue, it will need to upgrade its electricity grid, rapidly build out energy storage and boost the flexibility of coal power.

While clean-energy expansion is covering most or all of India’s power-demand growth, the fossil-fuel industry continues to pursue major capital investments.

This includes large amounts of new coal-power capacity, ambitious plans for the conversion of coal-to-chemicals and efforts to boost domestic coking coal production for the steel sector.

While CO2 output from the power sector is flat, with oil and gas in decline, India’s emissions still went up due to the contribution from industry.

India lags behind its competitors – including most large emerging economies – when it comes to electrifying its industrial sector.

Faster progress would enable clean electricity to substitute for fossil fuels in industry, as well as for power, offering the potential for India to cut its emissions overall.

Flatlining fossils

Last year, India’s CO2 emissions from fossil fuels and cement grew at their slowest pace in two decades, according to previous analysis for Carbon Brief.

This sharp slowdown was due to rapid clean-energy growth and flat oil demand, combined with rising emissions from steel and cement.

The first half of 2026 marks a continuation of these trends.

Most strikingly, the ongoing surge in clean-energy generation means that emissions have flatlined in India’s power sector for two years, as shown in the figure below.

Power-sector CO2 was the same in the first half of 2026 as two years earlier, with a small decline in 2025 having been reversed over the same period this year.

For further details, see: About the data.

Beyond electricity generation, India’s key emitting sectors continued to see divergent trends in the first half of 2026, as some saw ongoing decline while others reached new heights.

This is shown in the figure below, which compares year-on-year changes in emissions during the first half of 2026 with the same periods in 2025, 2024 and the average for 2021-23.

Specifically, emissions grew by 2.3% in the power sector, reversing last year’s decline, while demand for gas and oil products fell for another year.

The biggest increases were for steel and cement, where emissions growth accelerated to 8% year-on-year in the first half of 2026, well above the recent trend.

Bar chart titled "Industrial emissions growth is driving up India’s CO2" and subtitled "Change in CO2 per sector, MtCO2 year-on-year." The chart shows emissions across Power generation, Steel and cement, Oil product consumption, and Others. Steel and cement growth rises steadily through 2026 H1, while power generation dips significantly in 2025 H1. Source: Analysis for Carbon Brief by CREA. (alt text generated by Google Gemini)
For further details, see: About the data.

Clean-energy growth matches power demand

The period from the first half of 2024 to the first half of 2026 saw the largest increase in non-fossil power generation on record in India.

This enabled fossil-fuel consumption and CO2 emissions from the sector to stay flat, even as electricity consumption increased.

Indeed, this is the first time in more than 50 years that there has been no growth in coal power over a two-year period, even as electricity demand grew overall, as shown below.

Chart titled "Clean energy caps India's coal power for first time in 50 years" and subtitled "Electricity generation from coal, TWh per 12 months". The line chart shows coal generation steadily rising from near zero in 1975 to a peak over 1,300 TWh in 2024 before flattening. Source: Analysis for Carbon Brief by CREA. (alt text generated by Google Gemini)
For further details, see: About the data.

Over this two-year period, India’s total power generation increased by 7%, some 63TWh, equal to the total consumption of Singapore or Switzerland.

The additional power requirement of 63TWh was met entirely by clean energy. Solar grew by 44TWh, alongside growth from wind (13TWh), nuclear (7TWh) and hydro (8TWh).

Together, clean-energy sources added 70TWh over two years, more than the net increase in demand.

(For comparison, China’s nuclear, wind and solar output increased by 485TWh in 2025.)

The figure below shows that new investments are more than sufficient to maintain this trend, as added power generation from new clean power capacity has stayed above average demand growth for the past 18 months.

Chart titled "Clean power grew faster than electricity demand in H1 2026" and subtitled "Output from new clean capacity and demand growth, TWh per half-year." The chart shows clean power capacity, dominated by solar, rising steadily to overtake electricity demand growth in recent periods. Source: Analysis for Carbon Brief by CREA. (alt text generated by Google Gemini)
For further details, see: About the data.

Over the past two years, India added 77GW of new solar capacity, 11GW of wind, 5GW of hydro and 0.6GW of nuclear capacity.

Solar power continues to dominate clean-energy growth, but, collectively, the other non-fossil sources still contributed 40% of the overall increase in generation.

One factor in electricity demand growth in 2026 is the El Niño, which delayed the monsoon and intensified heatwaves, driving up cooling demand.

India is accelerating investment in energy storage, which will support further growth in clean power. The National Electricity Plan projected a requirement of 82 gigawatt-hours (GWh) of energy storage capacity by 2026-27 and 411GWh by 2031-32.

As of May 2026, the government has issued tenders for around 272GWh of energy storage capacity, including 142GWh of pumped hydro and 133GWh of battery storage systems. Current capacity is 7.5GWh of battery storage and around 60GWh of pumped hydro.

Which states led the clean-power shift?

The fall in power generation from fossil fuels from the first half of 2024 to the same period in 2026 was concentrated in a few states.

Gujarat saw both the largest reduction in fossil-fuel generation and the largest expansion in clean power, as shown in the figure below.

Chart titled "Gujarat is India’s leading state for clean-power growth – and fossil-power decline" and subtitled "Change in power generation by state from H1 2024 to H1 2026, TWh." The horizontal bar chart shows Gujarat leading with largest wind and solar gains and biggest fossil drops. Source: Analysis for Carbon Brief by CREA (alt text generated by Google Gemini)
For further details, see: About the data.

After Gujarat, the largest increases in clean-power generation were seen in Rajasthan and Tamil Nadu, which also saw reductions in power generation from fossil fuels.

Several other states saw declines in fossil-fuel generation due to higher net imports, rather than local clean power. These included Madhya Pradesh, West Bengal and Punjab.

Karnataka and Andhra Pradesh also succeeded in increasing clean-power generation faster than power demand, thereby contributing to keeping fossil fuel-based power generation stable nationwide across the two-year period. However, they exported much of the increase and consequently saw local increases in power generation from fossil fuels.

The two states with the largest increases in power demand, Maharashtra and Telangana, managed to almost match the rise with growth in clean-power generation.

Fall in oil and gas consumption continues

India’s oil consumption continued to fall during the first half of 2026, dropping 1.3% year-on-year, a slight acceleration from the 0.7% reduction in the same period last year.

While diesel and petrol consumption continued to grow, oil consumption was pulled down overall by declines in liquefied petroleum gas (LPG), petcoke (a solid derivative of oil used in the cement industry) and industrial feedstocks. Growth of aviation fuel use eased.

Diesel consumption growth accelerated from 1.8% to 4.1% in the first half of the year, supported by higher freight movement and increased agricultural demand, as the delayed monsoon led to greater use of diesel-powered irrigation.

Petrol consumption returned to growth, increasing 6.9% year-on-year after zero growth in the same period in 2025, reflecting sustained growth in passenger and two-wheeler mobility.

A significant increase in ethanol blending shaved a full percentage point off the growth of petrol consumption. India achieved its 20% ethanol blending target five years ahead of schedule in 2025-26. (Ethanol blending has faced public opposition.)

Electric vehicle (EV) adoption in India is also gaining momentum, with EVs adopted in a widening range of categories.

In Delhi, an EV policy was launched to accelerate electrification of the vehicle fleet, with a particular focus on two-wheelers, three-wheelers (auto rickshaws), commercial vehicles and high-mileage segments, alongside expanded charging infrastructure. Higher EV adoption rates will moderate the growth in emissions from petrol consumption in India.

In contrast, aviation fuel demand growth slowed down from 5% to 2%. The slowdown coincided with the strait of Hormuz and wider crisis, which disrupted international aviation through temporary airspace closures and flight cancellations to several Middle Eastern destinations. Elevated aviation fuel prices also increased airline operating costs, contributing to lower fuel demand.

LPG consumption contracted by 7%, after 5.7% growth in the same period last year, amid disruptions in global LPG markets following the Hormuz crisis.

Petcoke consumption fell 9.9%, more than reversing a 9.3% increase in the same period last year. Rising petcoke prices encouraged cement manufacturers to switch to coal.

Consumption of other petroleum products continued to drop, although the pace of decline moderated from 14% in 2025 to 9% in 2026.

Industrial feedstock use was affected by shortages and price increases.

Naphtha demand contracted as import prices nearly doubled and domestic prices increased by around 60%, prompting petrochemical manufacturers to reduce operating rates and suppress demand for imported naphtha.

Bitumen consumption remained subdued due to slower road construction, driven by persistent land acquisition challenges and higher bitumen costs.

Meanwhile, higher light diesel oil (LDO) prices and shortage of LPG led some industrial consumers to switch back to furnace oil in boilers and heaters, despite the higher air pollutant emissions. Supply of fuel oil to industry increased for the same reason.

Rapid emission growth from heavy industry continues

Steel and cement output in India grew by 8% and 9%, respectively, year-on-year in the first half of 2026, despite rising input prices and weakening profitability.

The growth in steel and cement was supported in part by increased investment in India’s real estate sector, especially in the second quarter. Steel consumption growth outpaced production, implying that inventories built up last year were tapped.

Despite domestic demand growth, profit margins of Indian steel and cement manufacturers remained under pressure for much of the period due to elevated raw material costs – particularly imported coking coal – and higher freight costs stemming from the Hormuz crisis.

The pressure on prices could dampen growth. Cement prices are expected to rise to levels last seen in the 2021-22 financial year, when Russia’s decision to cut back gas exports to Europe drove a sharp increase in fossil-fuel prices.

Outside the steel, cement and power sectors, coal-consumption growth accelerated to 14% in the first half of 2026, up from 3% last year, as the LPG shortage prompted a shift to coal.

Gas shortages resulted in some additional burning of coal for cooking in March and April. The government officially authorised the hospitality industry to use coal, refuse-derived fuel pellets, biomass and kerosene for one month.

The ceramic and tile industry also requested that the government allow the use of coal gasifiers amid the gas shortage. State governments including Delhi NCR, Rajasthan, Tamil Nadu, Gujarat and Maharashtra also allowed industries to temporarily use alternative fuels, including coal.

India’s industrial energy use is dominated by fossil fuels, particularly coal. Indian industry has the second-lowest electrification rate in the G20, as shown in the figure below. The share of electricity in total energy consumption in the sector also lags the world average, in terms of both current levels and the rate of increase.

Chart titled "Indian industry has the second-lowest electrification rate in G20" and subtitled "Electricity share of industrial energy use in 2023. Arrow shows change since 2000." The chart shows that Korea leads above 50%, Saudi Arabia is lowest below 10%, and India grew to 17%. Source: CREA analysis of IEA World Energy Balances 2025 (alt text generated by Google Gemini)
For further details, see: About the data.

The current low rates of electricity use in Indian industry imply that there is major potential for electrification, using technologies and processes already in place in other countries.

New investments in coal

While the clean-power expansion is starting to meet most or all of India’s electricity demand growth, there are still large investment plans across the coal supply chain.

Some 43GW of coal-power capacity was under construction at the end of June. Additional coal-power capacity is seen as necessary to meet increasing peak loads, even as solar power and energy storage are already playing a role in covering daytime and evening peak demand, respectively. The expansion of energy storage will increase this contribution.

Outside the power sector, India has major ambitions to produce chemical-industry products, such as fertiliser and plastic feedstock, from coal through coal gasification, in pursuit of energy security.

The government is targeting a capacity to process 100m tonnes of coal per year in the next four years, despite the technology for coal gasification still being nascent in India. At present, the only operational use of coal gasification is at Jindal Steel Limited, which is reportedly using syngas in its steel-making process.

Meanwhile, India plans to reduce its average CO2 emissions per tonne of steel by 25% by 2025-26, mainly by reducing the share of coal-based steelmaking.

At the same time, the government is aiming to increase the use of domestic coking coal, which it notified in January this year as a “critical and strategic mineral”. Coal miners and steel companies are reportedly planning to establish additional washeries for coking coal to make it suitable for blending with imported coal for use in steel production.

India is also looking to invest in new coal mines in the near future.

These continued investments in coal gasification, domestic coking coal and new coal mining capacity could lock in coal use across industry for several decades.

Outlook for India’s emissions

Over the two-year period from the first half of 2024 to the same period in 2026, India has achieved its largest clean-energy expansion on record.

As a result, power-demand growth has been met entirely by clean electricity and CO2 emissions in the sector have flatlined.

This expansion of clean energy also allowed a reduction in fossil-fuel imports for power generation, with the use of imported coal falling 38% and the use of gas by 35%, supporting the energy security aims of the government and reducing exposure to the Hormuz shock.

In order to keep the clean-energy growth going, India would need to overcome multiple obstacles, including expansion of the electricity transmission network, improvements in grid flexibility to accommodate variable renewables and the timely completion of new projects.

For example, renewable power projects totalling 5.3GW missed completion deadlines and are having to pay penalties to the grid operator in order to retain network access.

Curtailment has emerged as an issue, particularly for projects relying on interstate power transmission, pointing to the need to upgrade the network. (Curtailment refers to electricity generation that is “wasted” because it cannot be accommodated by the power network.)

Another obstacle to be overcome if clean energy is to keep growing will be making coal-power plants more flexible, so they can ramp down during high renewable output.

A flexibility plan for coal-power plants has been delayed by more than a year due to persistent regulatory bottlenecks, contributing to the curtailment of renewable energy.

Expanding energy storage has the potential to ease grid and flexibility constraints, while reducing or eliminating the need for adding thermal-power capacity to meet peak loads.

The Central Electricity Authority has proposed that, after June 2027, all new government-owned solar and wind projects would have “mandatory” two-hour battery storage. (This mirrors a policy that was in place in China until early 2025 and was subsequently scrapped, in favour of more market-based approaches.)

For oil and gas, India’s consumption has been flatlining for the past two years, after half a century of continuous growth that was only briefly interrupted by Covid-19.

This has reduced the impacts of the Hormuz crisis on the country’s trade balance, helping close the gap between supply and consumption. But it has entailed disruptive shifts in many oil-dependent sectors.

For example, high prices and fuel shortages due to the Hormuz crisis led state governments to reverse their orders banning the use of dirtier fuels such as fuel oil, kerosene and coal in industries and commercial establishments.

Meanwhile, EV adoption has also begun to influence oil consumption.

Despite the progress in the power sector and reductions in oil consumption, India’s total emissions went up over the past two years due to a major increase in industrial emissions.

Low levels of electricity use in industry mean that growing industrial output results in increasing direct fossil-fuel use and emissions.

Unless the rate of industrial electrification picks up, increases in heavy industry output will continue to translate into increases in fossil-fuel consumption and CO2 emissions.

About the data

This analysis is based on official monthly data for fuel consumption, industrial production and power generation from different ministries and government institutes.

Coal-power emissions are estimated by combining plant-level coal consumption from the Central Electricity Authority’s (CEA) monthly coal reports with data on the calorific value and emission factors of coal used at different power plants from the CEA’s CO2 baseline database.

For each station and month, total coal consumption is split into domestic and imported coal using the imported share of coal receipts over a trailing two-month window, found to best reproduce the actual split in data available for 2023.

Consumption is converted to CO2 using each plant’s station-specific gross calorific value from the CEA database and IPCC emission factors for domestic coal, imported coal and lignite. The national-average calorific value is used for recently added plants, for which data is not available in the baseline database.

Coal use at steel and cement plants, as well as process emissions from cement production, are estimated using production indices from the index of eight core industries released monthly by the Office of Economic Adviser, assuming that changes in total fossil-fuel use follow production volumes. These production indices were used to scale fuel use by the sectors in 2022.

To form a basis for using the indices, monthly coal-consumption data for 2022 was constructed for the sectors by combining the annual total coal and petcoke consumption reported in IEA World Energy Balances with monthly production data. This work was set out in a paper by Robbie Andrew, a researcher at Norwegian research institute CICERO, on monthly CO2 emission accounting for India. Monthly petcoke consumption was available from the Petroleum Planning and Analysis Cell, while coal consumption by the cement industry was calculated by subtracting petcoke use from total fossil-fuel use.

Annual cement-process emissions up to 2025 were also taken from Andrew’s work and scaled using the production indices. This approach better approximated changes in energy use and emissions reported in the IEA World Energy Balances, than did the amounts of coal reported to have been dispatched to the sectors, showing that production volumes are the dominant driver of short-term changes in emissions.

For other sectors – including aluminium, auto, chemical and petrochemical, paper and plywood, pharmaceutical, graphite electrode, sugar, textile, mining, traders and others – coal consumption is estimated based on data on despatch of domestic and imported coal to end users from statistical reports and monthly reports by the Ministry of Coal, as consumption data is not available.

Coal consumption by “captive” coal-power plants – those supplying power to industrial sites, not to the public electricity network – was calculated based on capacity changes from Global Energy Monitor, assuming constant utilisation, as utilisation has been very stable year-to-year, as calculated from Central Electricity Authority data.

The difference between coal consumption and dispatch is stock changes, which are estimated by assuming that the changes in the amount of coal stored at end-user facilities mirror those at coal mines, with end-user inventories excluding power, steel and cement assumed to be 70% of those at coal mines, based on comparisons between our data and the IEA World Energy Balances.

Stock changes at mines are estimated as the difference between production at and dispatch from coal mines, as reported by the Ministry of Coal.

Coal consumption is estimated in two ways for sectors beyond power, steel and cement. Consumption of domestic coal in these other sectors is taken from the monthly reports by the Ministry of Coal. Their consumption of imported coal is estimated from the total imports of thermal coal reported by consultancy Kpler, by subtracting demand for imports at coal-power plants. The basis for this assumption is that steel and cement industries use little imported thermal coal, according to Ministry of Coal data.

Product-by-product consumption data for petroleum products, as well as gas use by sector, is from the Petroleum Planning and Analysis Cell of the Ministry of Petroleum and Natural Gas.

As the fuel dispatch and consumption data is reported as physical volumes – such as tonnes or litres – calorific values are taken from IEA’s World Energy Balance and CO2 emission factors from 2006 IPCC Guidelines for National Greenhouse Gas Inventories.

The emissions factor for motor oil or petrol was updated, based on the blending percentage of ethanol each year. The ethanol-blending percentage is as reported by the Ministry of Petroleum and Natural Gas.

Calorific values are assigned separately to different fuel types, including domestic and imported coal, anthracite and coke, as well as to petrol, diesel and several other oil products.

The post Analysis: India’s power-sector emissions flat for two years due to clean-energy surge appeared first on Carbon Brief.

Analysis: India’s power-sector emissions flat for two years due to clean-energy surge

Continue Reading

Trending

Copyright © 2022 BreakingClimateChange.com