

The calculation of emissions, particularly in the realm of energy consumption, is a complex process that requires careful consideration of various factors. Two primary methods, location-based and market-based emissions reporting, play a critical role in understanding your company’s carbon footprint.
This article delves into the intricacies of both methodologies, offering insights into their distinct calculations and implications for businesses.
Both location and market based emissions reporting applies to two emission categories: scope 2 or purchased electricity and scope 3 or fuel and energy related emissions. Let’s break down each method starting with location-based emissions.
Understanding Location-Based Emissions
Location-based emissions refers to what you physically consume at your operations site or business facility. It’s calculated using solely the average emission intensity of the local grid where you source power.
 That means a location-based method doesn’t factor in any green measures you’re adopting such as renewable energy credits (RECs). So, location-based emissions would be the same regardless if you use RECs but would be different vs. your market-based emissions.
For a clearer understanding in determining your location-based emissions, let’s use an example of a business in L.A., California. You can find the actual emission factors for your local power grid from the International Energy Agency (IEA) database.
Now, let’s calculate. First step is to get the emissions factor for the average CO2 or GHG intensity of the LA power grid, expressed in kg of CO2e per kWh. Then let’s multiply that emissions factor by the building’s electricity consumption to get Scope 2 emissions.
- Here’s the formula to keep in mind: kWh of electricity used x local grid emissions factor = Location-based Scope 2 Carbon or GHG Emissions
To get location-based emissions for your Scope 3, simply do the same with the upstream emission factor.
The idea behind calculating and reporting Scope 2 location-based emissions is that everyone in the same power grid is equal. Nobody gets exception and everybody shares the same emissions of the grid based on the amount of electricity they consume.
Given the formula above, one option to reduce your location-based emissions is to just decrease overall energy use. Or you can increase on-site renewable energy generation used directly by your office building or production facility.
Understanding Market-Based Emissions
Unlike location-based methods, the calculation for market-based emissions focuses on the individual company and its contract agreements in the market. Market-based emissions are associated with energy a company purchases, which is different from the power the local grid generates.
There are various instruments or contracts involved in getting market-based emissions. These include these common ones:
- Renewable Energy Contracts (RECs)
- Direct contracts
- Supplier-specific emission rates
- The residual mix
Calculating for these energy contracts or instruments should adhere to the GHG protocol Scope 2 emissions quality criteria. If they don’t, the company may still opt to report them separately for transparency. But they can’t be included in calculating market-based Scope 2 emissions.
So how does getting market-based vs. location-based Scope 2 emissions differ?
As mentioned, market-based emissions take into account energy purchase agreements. So, taking the example provided above for location-based emissions, the California company is taking its electricity from the local grid. But they want to buy RECs from a renewable energy developer.
While that company still connects with and consumes power from the grid, the market-based method requires them to factor in emissions of the RECs. By doing that, the company can claim the emission reductions from the renewable energy supply instead of applying the emissions factor of the grid as the case with the location-based method.
Here are the steps to calculate market-based emissions using this formula:
- kWh consumed x Contract source emissions factor (EF) = Market-based Scope 2 CO2e GHG Emissions
- Get the emissions factors for energy sources specified in the contracts (refer to GHG protocol quality criteria)
- Multiple the power bought from a source by its specific emission factor. Do the same for all the sources in energy contracts and sum them all up.
- For electricity use emissions that’s included in your contracts, use the residual mix emission factor.
Residual mix refers to the emission factor for the grid that excludes electricity generation claimed by your electricity contracts.
- A quick tip: choose higher precision EF wherever applicable when calculating market-based emissions as the GHG Protocols Hierarchy suggests.
This approach of measuring emissions is attributed to the same energy consumed used in calculating location-based emissions. When you determine Scope 2 emissions using both methods, you don’t sum them up, but disclose them separately.
The goal is to report these two emissions side-by-side to show different stories about the same activity data.
Comparing Location-Based and Market-Based Emissions
With the differences in calculating Scope 2 emissions, which method should you use?
Given the more detailed and accurate market-based emissions, you might opt for this calculation method. After all, carbon accounting must prioritize accuracy and market-based emissions are more specific to your business operations.
However, calculating market-based is a bit trickier. You need to have a clear understanding of your contract emission factor or know if it’s 100% renewable. It matters a lot as shown in the formula, but it doesn’t fully capture the actual emissions of your energy use.
On the contrary, the location-based method does show it.
According to the World Resources Institute, “the location-based method reveals what the company is physically putting into the air, and the market-based method shows emissions the company is responsible for through its purchasing decisions”.
In other words, both methods tell different sides of the story that’s essential in showing your company’s CO2 footprint. From there, you can decide the corresponding carbon reduction strategies to adopt.
The GHG Protocol provides a comprehensive comparison between the two carbon accounting methods, including their applicability, most useful scenario, and what they miss out.
Market-Based Vs. Location-Based Emissions Method

Policy Implications and Carbon Offsetting
Electricity sourced from a grid lacks differentiation and cannot be distinguished based on its origin. Even if your company buys renewable energy credits (RECs) or similar instruments, they don’t significantly alter or lower your emissions. They also don’t enable a complete disconnection from the grid, unless you establish your own self-sufficient power generation.
You can account for RECs and other carbon credits in your company’s carbon offset inventory. However, they should be accounted for separately as a unique inventory line item and not included in calculating emissions from purchased power.
In contemporary electricity grids worldwide, such as those in the U.S, Canada, and Germany, integrating renewable energy does not result in disconnection from the local electricity grid. Rather, electricity generated by your renewable energy system is often sold back into the grid, with net metering commonly employed.
Consequently, you continue to use grid electricity, with any surplus clean energy benefit shared by all grid users. This integration leads to a reduction in the grid’s overall carbon intensity, a factor that’s useful in accounting for location-based Scope 2 emissions.
Location-Based vs Market-Based Emissions: Closing Thoughts
As new guidance and regulations on carbon accounting and reporting corporate emissions are strengthening, companies should know the basics, at the very least, of factoring in their harmful emissions. Knowing the different methods for accounting emissions, be it location-based or market-based, and their nuances is crucial.
While market-based emissions provide a more granular and specific picture of a company’s carbon footprint, the location-based approach offers transparency about the physical emissions generated at a site.
Recognizing the distinct stories presented by each method allows you to develop effective carbon reduction strategies in line with your company’s or organization’s operational needs and environmental commitments.
The post Market-Based Vs Location-Based Emissions: What’s The Difference? appeared first on Carbon Credits.

Nasdaq has backed one of the first carbon removal credit deals licensed under European Union rules. The project is based in Stockholm and is designed to generate high-quality carbon removal credits under a formal EU framework.
This marks a key shift. For years, carbon markets have relied on voluntary standards with mixed credibility. Now, the European Union has developed a regulated system to define what counts as a valid carbon removal. This move aims to build trust and attract large investors into a market that is still in its early stages.
The deal shows growing interest from major companies. It also reflects rising demand for reliable ways to remove carbon from the atmosphere.
Inside the Stockholm Carbon Removal Project
The removal project is run by Stockholm Exergi. It uses a process called BECCS, or bioenergy with carbon capture and storage. This method burns biomass, such as wood waste and agricultural residues, to produce heat and electricity. At the same time, it captures the carbon dioxide released and stores it underground.
The captured CO₂ will be transported and stored deep beneath the North Sea in rock formations. Over time, it will turn into solid minerals. This makes the carbon removal long-lasting and more secure than many nature-based solutions.
The facility is expected to start operating in 2028. Once active, it will generate carbon removal credits that companies can buy to balance their remaining emissions.
Beccs Stockholm is one of the world’s largest carbon removal projects. In its first ten years, the project could remove about 7.83 million tonnes of CO₂ equivalent. This makes it a key tool for helping the European Union reach climate neutrality by 2050.
The project also aims to scale carbon removal by building a full CCS value chain in Northern Europe and supporting a growing market for negative emissions credits.
This project is important because it is one of the first to follow the EU’s new carbon removal certification rules. These rules define how carbon removal should be measured, verified, and reported. They also aim to reduce risks like double-counting and weak accounting.
EU Certification: Building Trust in a Fragile Market
The European Commission has introduced a framework, also called Carbon Removals and Carbon Farming (CRCF) Regulation, to certify carbon removal activities. This includes technologies like BECCS, direct air capture with carbon storage, and biochar.
The goal is to create a trusted system that investors and companies can rely on. It also established the first EU-wide certification framework for carbon farming and carbon storage in products, not just removals.
Until now, the voluntary carbon market (VCM) has faced criticism. Concerns about transparency and “greenwashing” have made some companies cautious. Many buyers want stronger proof that credits represent real and permanent carbon removal.
The EU framework tries to solve this problem. It sets clear rules for:
- Measuring how much carbon is removed.
- Verifying results through independent checks.
- Ensuring long-term storage of CO₂.
This structure may help standardize the market. It could also make carbon removal credits easier to compare and trade across borders. The Commission states that the goal of having the framework is:
“to build trust in carbon removals and carbon farming while creating a competitive, sustainable, and circular economy.”
Corporate Demand Is Growing—but Still Limited
Large companies are starting to invest in carbon removal. However, the market remains small compared to what is needed.
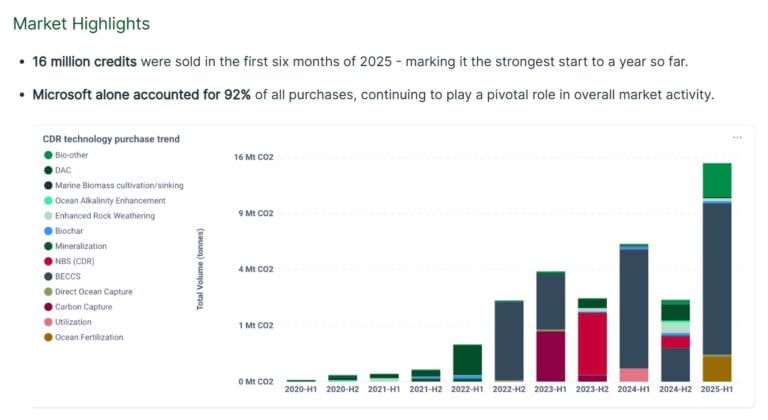
One major buyer is Microsoft. It currently holds about 35% of all global carbon removal credits, making it a dominant player in the market. In fact, it is responsible for 92% of purchased removal credits in the first half of 2025.
Other companies, including Adyen, a Dutch payments provider, have also joined the Stockholm project. These early buyers aim to secure a future supply of high-quality carbon credits as demand grows.
Ella Douglas, Adyen’s global sustainability lead, said in an interview with the Wall Street Journal:
“This project does exactly that [“catalytic impact” to the VMC] while also building key market infrastructure in collaboration with the European Commission.”
Still, many firms remain cautious. Carbon removal technologies are often expensive and not yet proven at a large scale. Some companies also worry about reputational risks if projects fail to deliver real climate benefits.
This creates a gap. Demand is rising, but the supply of trusted credits is still limited.
- SEE event: Carbon Removal Investment Summit 2026
A Market Set for Rapid Growth
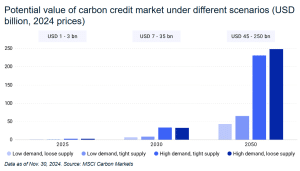
Despite these challenges, the long-term outlook for carbon removal is strong. Estimates suggest the market could reach $250 billion by mid-century, according to MSCI Carbon Markets.
Several factors drive this growth:
- First, global climate targets require large-scale carbon removal. The Intergovernmental Panel on Climate Change estimates that the world may need to remove around 10 billion metric tons of CO₂ per year by 2050 to limit warming.
- Second, many companies have set net-zero goals. These targets often include removing emissions that cannot be avoided, especially in sectors like aviation, shipping, and heavy industry.
- Third, new regulations are pushing companies to disclose and manage emissions more clearly. This increases demand for credible carbon solutions.
However, the current supply falls far short of what is needed. Only a small share of the required carbon removal credits has been developed or sold so far.
Balancing Removal and Emissions Cuts
While carbon removal is gaining attention, experts stress that it cannot replace emissions reductions. Removing carbon from the atmosphere is often more expensive and complex than avoiding emissions in the first place.
Groups like the European Environmental Bureau warn that over-reliance on credits could delay real climate action. They argue that companies should set separate targets for reducing emissions and for removing carbon.
The EU framework reflects this concern. It treats carbon removal as a tool for addressing residual emissions, not as a substitute for cutting pollution at the source. This distinction is important. It helps ensure that carbon markets support, rather than weaken, overall climate goals.
From Concept to Market Infrastructure
The Stockholm project marks a turning point for carbon removal. It shows how rules, strong verification, and corporate backing can bring structure to a fragmented market.
With support from players like Nasdaq, carbon removal is moving closer to becoming a mainstream financial asset. At the same time, the European Union’s certification system is setting the foundation for a more credible and scalable market.
The path ahead remains complex. Technologies must scale. Costs must fall. Trust must grow. But the direction is clear.
Carbon removal is no longer a niche idea. It is becoming a key part of the global climate economy, with the potential to shape investment flows for decades to come.
The post Nasdaq Invests in First EU-Certified Carbon Removal Credits from Stockholm Exergi appeared first on Carbon Credits.

The nuclear energy industry is entering a new phase of transformation. This shift is no longer just about building reactors—it is about building them faster, smarter, and more efficiently.
A recent breakthrough led by the U.S. Department of Energy (DOE), in collaboration with Idaho National Laboratory, Argonne National Laboratory, Microsoft, NVIDIA, Everstar, and Aalo Atomics, highlights that AI tools can streamline the nuclear regulatory process.
AI and DOE’s Genesis Mission: Breaking Bottlenecks in Nuclear Energy Deployment
The work supports President Trump’s Genesis Mission, a national initiative aimed at driving a new era of AI-accelerated innovation and discovery. The mission focuses on using advanced technologies like AI to solve critical national challenges, from energy to healthcare and beyond.
Under the Genesis Mission, DOE recently announced $293 million in competitive funding to tackle twenty-six pressing science and technology challenges, including one dedicated to speeding up nuclear energy deployment.
Rian Bahran, Deputy Assistant Secretary for Nuclear Reactors. said,
“Now is the time to move boldly on AI-accelerated nuclear energy deployment,” “This partnership, combined with the President’s orders, represents more than incremental ‘uplift’ improvements. It has the potential to transform how industry prepares its regulatory submissions and deploys nuclear energy while upholding the highest standards of safety and compliance.”
Simply put, from licensing to construction and operations, AI is now helping eliminate long-standing bottlenecks.
Faster Nuclear Licensing with Advanced Tools
The DOE’s recent announcement is a big step in modernizing nuclear regulation. Normally, preparing licensing documents for nuclear reactors is slow and complicated. It requires reviewing thousands of pages of technical data and making sure everything meets strict rules.
This shows how AI can make nuclear licensing faster and more accurate, helping advanced reactors reach the market sooner. Here’s how AI is simplifying this usually long and complex process.
Kevin Kong, CEO and Founder of Everstar, added:
“Nuclear is poised to solve today’s critical energy challenges,” said “We’re excited to partner with INL to meet the moment, working together to accelerate regulatory review and commercialization.”
Microsoft and NVIDIA Partnership: Building AI Infrastructure for Nuclear Energy
While the DOE demonstration focused on licensing, the broader transformation is being driven by a powerful collaboration between Microsoft and NVIDIA.
Together, they are developing a full-stack AI ecosystem designed specifically for nuclear energy. This platform combines cloud computing, simulation tools, and advanced AI models to streamline every phase of a nuclear project.
Key technologies in this ecosystem include:
- NVIDIA Omniverse for simulation and digital modeling
- NVIDIA CUDA-X and AI Enterprise for high-performance computing
- Microsoft Azure AI for data processing and automation
- Microsoft’s Generative AI tools for permitting and documentation
This integrated system enables developers to manage complex workflows in a unified environment. Instead of working with disconnected tools and datasets, teams can now operate within a single, AI-powered framework.
As a result, nuclear projects become more efficient, transparent, and predictable.
Carmen Krueger, Corporate Vice President, US Federal, Microsoft, further added:
“Our collaborations with DOE, INL, and across the industry are demonstrating how we can effectively bring secure, scalable AI technologies to solve key energy challenges and achieve the broader national and economic security goals envisioned by the Department’s Genesis Mission.”
Aalo Atomics: Cutting Permitting Time and Costs with AI
One of the most compelling real-world examples of AI impact comes from Aalo Atomics.
By leveraging Microsoft’s Generative AI for Permitting solution, Aalo has achieved dramatic improvements in project timelines. The company reported:
- A 92% reduction in permitting time
- Estimated annual savings of $80 million
These results show how AI can address one of the biggest challenges in nuclear development—delays caused by regulatory complexity.
Permitting often takes years and requires extensive documentation. However, AI can automate much of this work, allowing teams to focus on critical decision-making rather than repetitive tasks.
For Aalo, the value goes beyond speed. The technology also improves confidence in project execution by ensuring that all documentation is consistent, complete, and aligned with regulatory expectations.
This video demonstrated further details:
AI-Powered Nuclear Lifecycle: From Design to Operations
The impact of AI is not limited to licensing. It extends across the entire lifecycle of a nuclear plant. In the blog post, written by Darryl Willis, Corporate Vice President, Worldwide Energy and Resources Industry of Microsoft, explained how AI can help nuclear in a broader context.
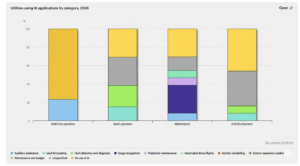
- Design and Engineering Optimization: AI and digital twins allow engineers to simulate reactor designs in real time. This enables faster iteration and better decision-making. Developers can reuse proven design patterns and instantly evaluate how changes affect performance, safety, and cost.
- Licensing and Permitting Automation: Generative AI handles document drafting, data integration, and gap analysis. It ensures that applications are complete and consistent, reducing delays during regulatory review. This allows experts to focus on safety assessments instead of administrative tasks.
- Construction and Project Delivery: Advanced simulations now include time and cost dimensions. These 4D and 5D models allow developers to track progress, predict delays, and avoid costly rework. AI also enables real-time monitoring, ensuring that construction stays on schedule and within budget.
- Predictive maintenance and Plant Performance: Once a plant is operational, AI continues to add value. Predictive maintenance systems can detect issues early, reducing downtime and improving reliability. Digital twins provide continuous insights into plant performance, helping operators maintain optimal efficiency.
The post AI Solutions from Microsoft and NVIDIA Power DOE’s Nuclear Energy Genesis Mission appeared first on Carbon Credits.

Climate change is not only a physical threat, but it also affects the world’s economy. A major new study published in the journal Nature on March 25, 2026, puts a clear number on this impact. It finds that carbon dioxide (CO₂) emissions from the United States caused about $10.2 trillion in total economic damage worldwide between 1990 and 2020. This makes the U.S. the largest single contributor to climate-related economic loss over that period.
The study shows that emissions slow economic growth in many countries. Rising temperatures cut productivity, lower output, and hurt long-term economic performance around the globe.
Marshall Burke, the lead author of the study, remarked:
“If you warm people up a little bit, we see very clear historical evidence, you grow a little bit less quickly. If you accumulate those effects over 30 years, you just get a really large change by the end of 30 years. It’s like death by a thousand cuts. And you have people being harmed who did not cause the problem, and that feels just fundamentally unfair.”
The researchers focused on carbon dioxide, the most common greenhouse gas. They used data on how temperature affects economic activity and then linked that to how much CO₂ different countries have emitted since 1990. This method links climate science to real economic results, including slower growth, lower productivity, and smaller national outputs.
Counting the Dollars: $10 Trillion in U.S.-Linked Damage
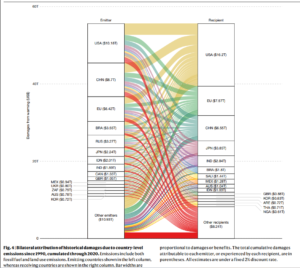
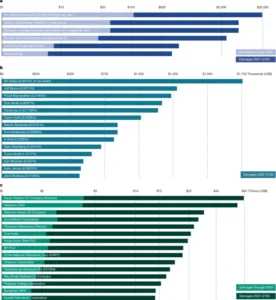
One of the study’s central findings is striking. From 1990 to 2020, U.S. emissions likely caused around $10.2 trillion in global economic damage. This means that warming linked to U.S. emissions has reduced economic production across many countries. The study links these impacts to heat’s long-term effects on labor, agriculture, and overall economic growth.
The damage is not confined to other nations. Roughly 30% of that $10.2 trillion figure is estimated to have occurred within the United States itself. In other words, U.S. emissions have slowed economic growth at home as well as abroad. The remaining impacts are spread across the global economy.
The researchers found that U.S. emissions led to about $500 billion in damage in India and around $330 billion in Brazil during that time. These figures show how carbon released in one area can affect economies far away.
A New Framework for Loss and Damage
The Nature study introduces a new framework for assessing what scientists call “loss and damage.” This term refers to harms that cannot be prevented by reducing emissions or avoided through adaptation alone.
The study uses economic data and climate models. It tracks how temperature changes over the years impact economic output.
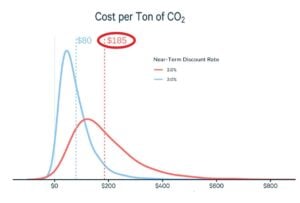
- To put the numbers into context: one tonne of CO₂ emitted in 1990 is estimated to have caused about $180 in global economic damages by 2020.
But that same tonne is projected to cause an additional $1,840 of cumulative damage by 2100, as warming continues and its effects compound over time. This highlights that past emissions still contribute to future economic harm.
The researchers highlight that these estimates focus on economic output, like goods and services. They do not account for all types of climate damage. They do not include costs from loss of life, health impacts, biodiversity collapse, cultural heritage losses, or many kinds of infrastructure damage. These excluded impacts could raise the true total cost of climate change even further.
The Social Cost of Carbon Revisited
This study is part of a broader scientific effort to understand the economic impacts of climate change. Climate and economic models show that rising temperatures are already slowing economic growth. If emissions stay high, this slowdown will get worse in the future.
Analyses by major international institutions and research groups project that climate change could reduce global GDP by a significant percentage by mid-century. This is compared to scenarios with strong mitigation, though exact figures vary by method.
The concept of estimating a “social cost of carbon” (SCC) — a monetary estimate of economic damage per tonne of CO₂ — has been used in policy analysis for years. It helps governments weigh trade-offs in climate policy. For example, they can decide how much to invest in emissions cuts versus adaptation.
However, traditional SCC estimates have been debated. They depend on assumptions about future growth, discount rates, and climate sensitivity. The Nature study advances this approach by tying economic outcomes directly to observed climate impacts.
Economists and climate scientists agree that warming impacts several areas. These include agricultural yields, labor productivity, energy demand, and health outcomes. These effects reduce economic output and increase costs for businesses and governments. The latest research makes these links more explicit by assigning dollar values to the historical impacts of emissions.
Equity and Global Responsibility
The research’s results also highlight important equity questions. Low-income countries often face bigger economic impacts compared to their emissions histories.
For example, nations with warmer climates and more fragile infrastructure may experience greater output losses due to temperature increases. These effects grow over time and can worsen existing development challenges.
At the same time, richer countries with higher historical emissions may take a larger share of responsibility for damage. The Nature study shows it is possible to calculate responsibility in monetary terms. However, turning those numbers into legal or financial obligations is still complex.
Tail Risks and Future Costs
The researchers also point toward the future. It finds that future damages from past emissions are much larger than the losses already accrued.
Since CO₂ remains in the atmosphere for centuries, its warming effects — and the economic damages linked to them — will persist well beyond 2020. This “tail risk” means that the total cost of historical emissions could rise sharply over the rest of this century.
Climate risk is increasingly integrated into economic planning and finance. Governments, businesses, and international institutions are incorporating climate scenarios into investment decisions and risk models.
This includes assessing how rising temperatures may affect infrastructure costs, insurance markets, supply chains, and national budgets. Without strong mitigation and adaptation measures, these economic pressures are expected to grow.
A Shared Reality, Quantified
The Nature study offers a clear and data-based way to think about the economic harms of climate change. Emissions from the United States since 1990 have caused over $10 trillion in global economic damage. This includes harm in the U.S., India, and Brazil.
These findings do not assign legal liability. However, they provide a meaningful picture of how climate change affects the global economy in terms of the social costs of carbon. They show that the costs of climate impacts are measurable and significant.
As the world continues to adapt and respond to climate change, understanding these economic links will be crucial for policymakers, businesses, and communities.
The post $10 Trillion in Carbon Cost? How U.S. Emissions Hit the Global Economy appeared first on Carbon Credits.


-
Climate Change8 months ago
Guest post: Why China is still building new coal – and when it might stop
-
Greenhouse Gases8 months ago
Guest post: Why China is still building new coal – and when it might stop
-

 Greenhouse Gases2 years ago
嘉宾来稿:满足中国增长的用电需求 光伏加储能“比新建煤电更实惠”
-
Climate Change2 years ago
Bill Discounting Climate Change in Florida’s Energy Policy Awaits DeSantis’ Approval
-

 Climate Change2 years ago
嘉宾来稿:满足中国增长的用电需求 光伏加储能“比新建煤电更实惠”
-
Climate Change Videos2 years ago
The toxic gas flares fuelling Nigeria’s climate change – BBC News
-

 Renewable Energy5 months ago
Sending Progressive Philanthropist George Soros to Prison?
-

 Carbon Footprint2 years ago
US SEC’s Climate Disclosure Rules Spur Renewed Interest in Carbon Credits