Connect with us

Published

on

In the early 2000s, a new field of climate-science research emerged that began to explore the human fingerprint on extreme weather, such as floods, heatwaves, droughts and storms.

Known as “extreme event attribution”, the field has gained momentum, not only in the science world, but also in the media and public imagination. These studies have the power to link the seemingly abstract concept of climate change with personal and tangible experiences of the weather.

Scientists have published more than 400 peer-reviewed studies looking at weather extremes around the world, from wildfires in the US and heatwaves in India and Pakistan to typhoons in Asia and record-breaking rainfall in the UK. The result is mounting evidence that human activity is raising the risk of some types of extreme weather, especially those linked to heat.

To track how the evidence on this fast-moving topic is stacking up, Carbon Brief has mapped – to the best of our knowledge – every extreme-weather attribution study published to date.

Carbon Brief’s analysis reveals:

  • 71% of the 504 extreme weather events and trends included in the map were found to be made more likely or more severe by human-caused climate change.
  • 9% of events or trends were made less likely or less severe by climate change, meaning 80% of all events experienced some human impact. The remaining 20% of events and trends showed no discernible human influence or were inconclusive.
  • Of the 152 extreme heat events that have been assessed by scientists, 93% found that climate change made the event or trend more likely or more severe.
  • For the 126 rainfall or flooding events studied, 56% found human activity had made the event more likely or more severe. For the 81 drought events studied, it’s 68%.

First published in July 2017, this article is the fifth annual update (see endnote) to incorporate new studies. The aim is that it serves as a tracker for the evolving field of “extreme event attribution”.

Using the map

The map above shows 504 extreme weather events and trends across the globe for which scientists have carried out attribution studies. The different symbols show the type of extreme weather; for example, a heatwave, flood or drought. The colours indicate whether the attribution study found a link to human-caused climate change (red), no link (blue) or was inconclusive (grey).

Mapped: How climate change affects extreme weather around the world
How to use our map of attribution studies.

Use the plus and minus buttons in the top-left corner, or double click anywhere, to zoom in on any part of the world. Click on a symbol to reveal more information, including a quote from the original paper to summarise the findings and a link to the online version.

The filter on the left allows users to select a specific type of weather event to look at or, for example, only those found to be influenced by climate change.

The filter can also be used to highlight extreme events from a particular year. (Note: earlier versions of this map classified events by the year that the study or analysis was published.) To isolate studies that assess the changing trends of weather extremes, click the “trend” box in the filter.

The software used to make the map currently only works with a Web Mercator projection (as used by virtually all major online map providers). It is worth noting that this – like all map projections – offers a somewhat distorted view of the world.

It is important to note that the weather events scientists have studied so far are not randomly chosen. They can be high-profile events, such as Hurricane Harvey, or simply the events that occurred nearest to scientific research centres. (More on this below.)

The map includes three different types of studies. The circles and hexagons on the map indicate papers published in peer-reviewed journals. The different shapes refer to whether the study considers an individual extreme event (circles), such as a wildfire or storm, or whether it analyses longer-term trends in extreme weather (hexagons), such as the change in frequency of flooding or marine heatwaves over time.

The third shape – triangles – indicate rapid attribution studies. These are quickfire assessments of the climate change contribution to extreme weather events, published online shortly after an event concludes. (More on this below.)

Finally, it is worth noting that some of the icon locations are approximate – particularly for studies that cover large regions. For example, global studies can be found grouped together in the middle of the Atlantic Ocean.

Extreme weather types

The events and trends shown on the map are covered by 431 individual scientific papers or rapid studies. Where a single study covers multiple events or locations, these have been separated out into individual entries on the map.

Combining the evidence over the past 20 years, the literature is heavily dominated by studies of extreme heat (30%), rainfall or flooding (25%) and drought (16%). Together, these make up more than two-thirds of all published studies (71%). The full list is available in this Google sheet.

As the chart below shows, the number of extreme events studied has grown substantially over the past 10-15 years. Note that formal studies typically follow a year or so after the event itself as the writing and peer-review process for journal papers can take many months.

The majority of studies included here have been published in the annual “Explaining extreme events” special issues of the Bulletin of the American Meteorological Society (BAMS). Each bumper volume typically contains around 15-30 peer-reviewed studies of events from the previous year. Other studies have been found through the Climate Signals database and online searches through journals. This update includes studies published up to the end of May 2022.

(Note: The map currently only includes studies published in English.)

Specific types of event can be displayed in the chart below by clicking on the category names at the top.

Number of attribution studies by extreme weather event type and year

Number of attribution studies by extreme weather event type and year. Note: the total number of events dipped in 2017 because the Bulletin of the American Meteorological Society special report for that year was published in early 2018 rather than late 2017. Chart by Carbon Brief using Highcharts.

Most of the categories of extreme weather are self-explanatory, but “storms” and “oceans” require a bit of explanation.

For ease of presentation, the “storms” category includes both tropical cyclones – such as hurricanes and typhoons – and extratropical storms. The “oceans” category encompasses studies looking at marine heatwaves, storm surges and the strength of El Niño events.

Newer categories include “coral bleaching” and “ecosystem services”, reflecting the ongoing developments in attribution science. For example, a rapid attribution study concluded that climate change had “drastically” increased the likelihood of the conditions leading to bleaching of the Great Barrier Reef in 2016 – by at least 175 times. And a 2022 study found that “extremely early” cherry-tree flowering in Kyoto in March 2021 was made “15 times more likely” by climate change.

For this latest iteration of the map, a new category of “compound” extreme events has also been added. This includes, for example, a 2021 study that found climate change had contributed to the “high likelihood” of combined dry and hot events in recent decades over most of China.
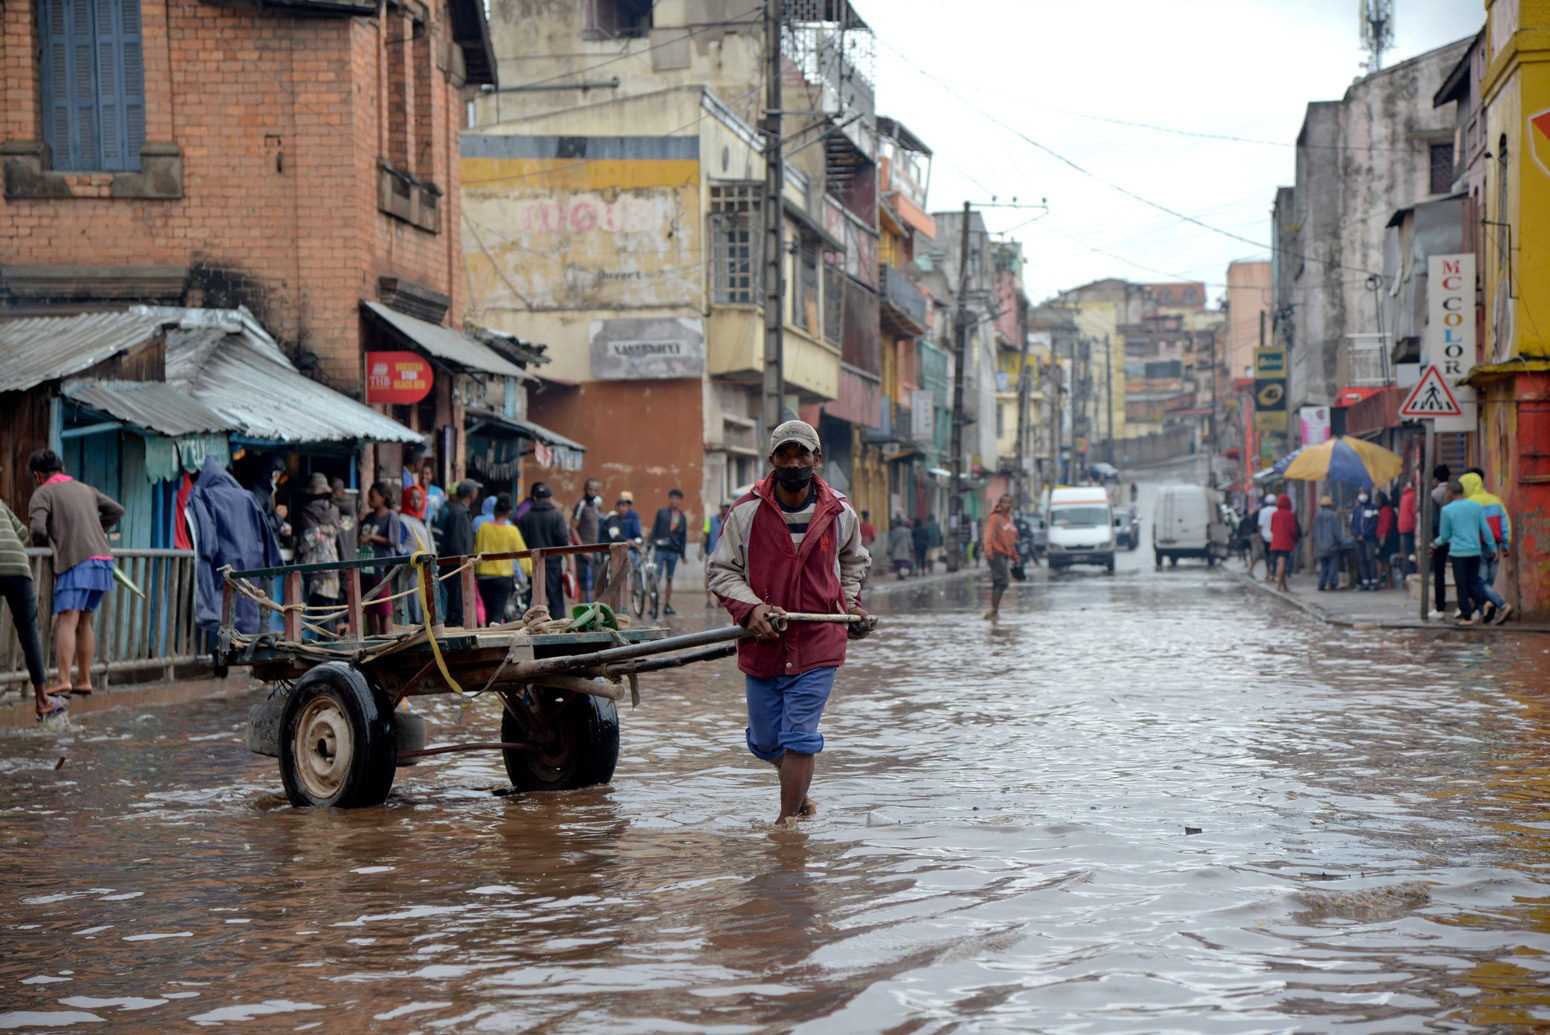
A man wades through a flooded road in Madagascar, after tropical cyclone Batsirai, Feb 2022
A man wades through a flooded road in Madagascar, after tropical cyclone Batsirai, Feb 2022. Credit: Xinhua / Alamy Stock Photo.

Such studies show that attribution studies are increasingly considering the impacts of extremes, rather than focusing purely on the weather event.

One of the first of these “impact attribution” studies was published in 2016. It estimated that 506 of the 735 fatalities in Paris during the 2003 European heatwave were down to the fact that climate change had made the heat more intense than it would otherwise have been. The same was true for 64 of the 315 fatalities in London, the study said. Health impacts have increasingly become a focus of attribution studies.

Similarly, a 2021 study found that 37% of “warm-season heat-related deaths” across 43 countries between 1991 and 2018 “can be attributed to anthropogenic climate change and that increased mortality is evident on every continent”. Another 2021 study, which the authors unpacked in a Carbon Brief guest post, found that climate change was a “critical driver” of the drought that led to a food crisis in Lesotho in 2007. And a third 2021 study – also the subject of a Carbon Brief guest post – on the rising threat of an “outburst flood” from glacial lakes in the Peruvian Andes found that the retreat of the region’s glaciers was “entirely attributable” to human-caused warming.

This shift towards impacts “is quite significant”, says Prof Peter Stott, who leads the climate monitoring and attribution team at the Met Office Hadley Centre and has been a co-editor of the BAMS reports since they began in 2012. He tells Carbon Brief:

“Impacts are hard to do because you have to establish a significant link between the meteorology and the impact in question. As editors, we’ve been trying to encourage more studies on impacts because it’s the impacts rather than the meteorology per se that tends to motivate these types of study – and if we only have the attribution on the meteorological event then we only have an indirect link to the relevant impact.”

Attribution of climate impacts could even be used in the courts, one 2021 study explained. The authors wrote a Carbon Brief guest post explaining how attribution science can be “translated into legal causality”. They wrote:

“Attribution can bridge the gap identified by judges between a general understanding that human-induced climate change has many negative impacts and providing concrete evidence of the role of climate change at a specific location for a specific extreme event that already has led or will lead to damages.”

Finally, attribution research has also identified the “signal” of human influence in other indicators of climate change, such as increasing average temperature, rising lake temperatures or sea level rise. Recent research has even been able to detect the fingerprint of climate change “from any single day in the observed global record since early 2012, and since 1999 on the basis of a year of data”. These types of studies have not been included in the attribution map as the focus here is on extremes.

Human influence on extreme weather

Of the attribution studies included here, scientists found that human-caused climate change has altered the likelihood or severity of an extreme weather event in 80% of cases studied (71% made more severe or likely and 9% made less so).

In Carbon Brief’s first edition of this analysis in 2017, 68% of events were found to have a human impact (with 63% made more severe or likely and 6% less so).

While these figures are not representative of all extreme weather events – attribution studies have only been conducted on a relatively small number – previous research has taken this broader view. For example, a 2015 study estimated the fraction of all globally occurring heat and heavy rainfall extremes that was attributable to warming. The authors found that around 75% of “moderate daily hot extremes over land” and 18% of “moderate daily precipitation extremes over land” were attributable to the observed temperature increase since pre-industrial times. These fractions are expected to increase with further warming, the authors noted.

There are several ways of carrying out an attribution analysis. (A team of attribution scientists wrote a Carbon Brief guest post in 2021 that unpacks their methods.) One of the most common is to take observations and/or climate model simulations of an extreme event in the current climate and compare them with idealised model runs of that event in a world without human-caused global warming. The difference between the “with” and “without” climate change simulations indicates how the likelihood or severity of that extreme event has changed.

Note that events are classified here as having an human impact if climate change is found to have influenced at least one aspect of that event. For example, a study of the 2011 East Africa drought found that climate change contributed to the failure of the “long rains” in early 2011, but that the lack of “short rains” in late 2010 was down to the climate phenomenon La Niña. This event is, thus, designated as having a human impact.

For the majority of events affected by climate change, the balance has shifted in the same direction. That is, rising temperatures made the event in question more severe or more likely to occur. These events are represented by the red in the chart below. Clicking on the red “slice” reveals that heatwaves account for 40% of such events, rainfall or flooding for 20%, and droughts for 15%. Return to the original chart, and do the same with the other slices to see the proportion of different weather types in each category.

Pie chart showing the proportion of extreme events and studies

Pie chart showing the proportion of extreme events/studies that were found to have been made more likely/severe by climate change (red segment), less likely/severe (orange), had no link identified (blue) and were inconclusive or lacked sufficient data (grey). Clicking on a segment reveals the makeup of different types of extremes within that category. Chart by Carbon Brief using Highcharts.

In 11% of extreme weather events and trends studied, scientists found no discernible influence from human activity. These are coloured blue in the map and the chart above. For a further 9%, the observational data or modelling techniques used in the study were insufficient to reach a reliable conclusion (shown as grey in the map and pie chart).

In 9% of studied weather events and trends, scientists found climate change had made the event less likely or less severe (pale orange in the chart above).

Unsurprisingly, this category includes blizzards and extreme cold snaps. However, it also features a few studies that suggest climate change has lessened the chances of heavy rainfall, and another that found rising temperatures have made agricultural drought in California less likely.

Drought is complicated (more on this below). Briefly, though, it is worth noting that five other studies looking at different aspects of the California drought over 2011-17 found climate change had played a role. Two found no discernible link (pdf, p7-15), while one was inconclusive (pdf, p3).

Interestingly, a 2020 study analysed the way links between climate change and the California drought were portrayed in US media. It finds that the links were “covered widely in both local and national news”, but notes:

“However, legitimate differences in the methods underpinning the attribution studies performed by different researchers often resulted in a frame of scientific uncertainty or disagreement in the media coverage.”

As the case of California’s drought shows, it is often necessary to dig deeper to understand the full picture. The rest of this article looks at the evidence for the three most-studied types of extreme weather – heatwaves, heavy rain and floods, and droughts – as well as some of the main issues in event attribution, and where the field as a whole is heading.

Heatwaves

The attribution map includes studies of 152 extreme heat events, of which 142 (93%) have been made more likely or more severe because of climate change. No studies have found a heatwave that has been made less severe by climate change, while studies of two events (1%) identified no influence and a further eight (5%) were inconclusive.

In recent years, studies have shown that several heat extremes would have been impossible or virtually impossible without human influence on the climate. These include Siberia’s heatwave of 2020, the Pacific north-west “heat dome” event of 2021 and Europe’s record-breaking summer of 2021.

A volunteer pours water on a pedestrian during a heatwave in southern Pakistan, May 2022
A volunteer pours water on a pedestrian during a heatwave in southern Pakistan, May 2022. Credit: Xinhua / Alamy Stock Photo.

The studies on extreme heat that did not find a role for climate change were an analysis of the Russian heatwave in 2010 and a rapid attribution study of the all-time high temperatures recorded in Rajasthan, India in May 2016. For the latter, the authors suggested that “the lack of a detectable trend may be due to the masking effect of aerosols on global warming and increased use of irrigation”.

While heatwaves are the most-studied extreme event in attribution literature, they are becoming “less and less interesting for researchers”, notes a Bloomberg article from 2020. Dr Friederike Otto is a senior lecturer at the Grantham Institute for Climate Change and the Environment at Imperial College London and co-leader of World Weather Attribution, a consortium of scientific organisations founded in 2014 to deliver “timely and scientifically reliable information on how extreme weather may be affected by climate change”. She told Bloomberg that the consortium chose not to investigate California’s record-breaking summer 2020 heatwave as “the evidence is so strong already”.

A particularly well-studied region for heatwaves in the literature is Australia, which accounts for 10% of the heat-related events included here. And climate change was found to play a role in all but one of the 15 Australian heat events studied. It is worth noting for that one event, however, that although the study (pdf, p145) was inconclusive for the city of Melbourne in south-east Australia, the authors did detect a human influence on extreme heat up the coast in Adelaide.

This raises a few important points. First, finding that climate change contributed to an event is not the same as saying it “caused” that event. Attribution is about working out if the likelihood or magnitude of a particular event happening now is different from what it would be in a world that was not warming.

A useful analogy – as explained in the first BAMS report in 2012 – is of a baseball player who starts taking steroids. If the player begins hitting 20% more home runs than before, it would not be possible to say for sure whether a particular home run is because of the steroids or the player’s spontaneous skill. But it is possible to say how the steroids have altered the likelihood that the player hits a home run, by comparing their current and historical performances. As the report put it:

“Given that steroids have resulted in a 20% increased chance that any particular swing of the player’s bat results in a home run, you would be able to make an attribution statement that, all other things being equal, steroid use had increased the probability of that particular occurrence by 20%.”

Another important point is that in cases where attribution science finds that climate change is making a given type of extreme weather more likely, it does not necessarily follow that the chance of experiencing that kind of weather gets incrementally higher each year. Natural variability means that there will still be ups and downs in the strength and frequency of extreme events.

Finally, there is usually a level of confidence attached to attribution results. So, while two studies might both find a role for human influence in a given weather event, the signal may be stronger for one than the other. For the purposes of this analysis, the attribution map does not distinguish between high- and low-confidence results, but users can click through to each study for more details.

Heavy rain and flooding

Of the 126 rainfall or flooding events included in the attribution map, 71 (56%) found human activity had made the event more likely or more severe – a far smaller proportion than for heat-related studies. Nineteen studies (15%) found that climate change had made the whole event less likely to occur. Of the remaining heavy rainfall events, studies of 24 (19%) found no evidence of a link to climate change, while 12 (10%) were inconclusive.

That there is a more divided set of results for extreme rainfall than for heatwaves could suggest several things. In some cases, limited data might make it difficult to detect a clear “signal” of climate change above the “noise” of weather considered normal for a particular region. In other cases, an inconclusive result could reflect the fact that rainfall or flooding events are inherently more complex than heatwaves, with many ways for natural variability to play a role. Human factors, such as land use and drainage, also play a part in whether heavy rain leads to flooding.
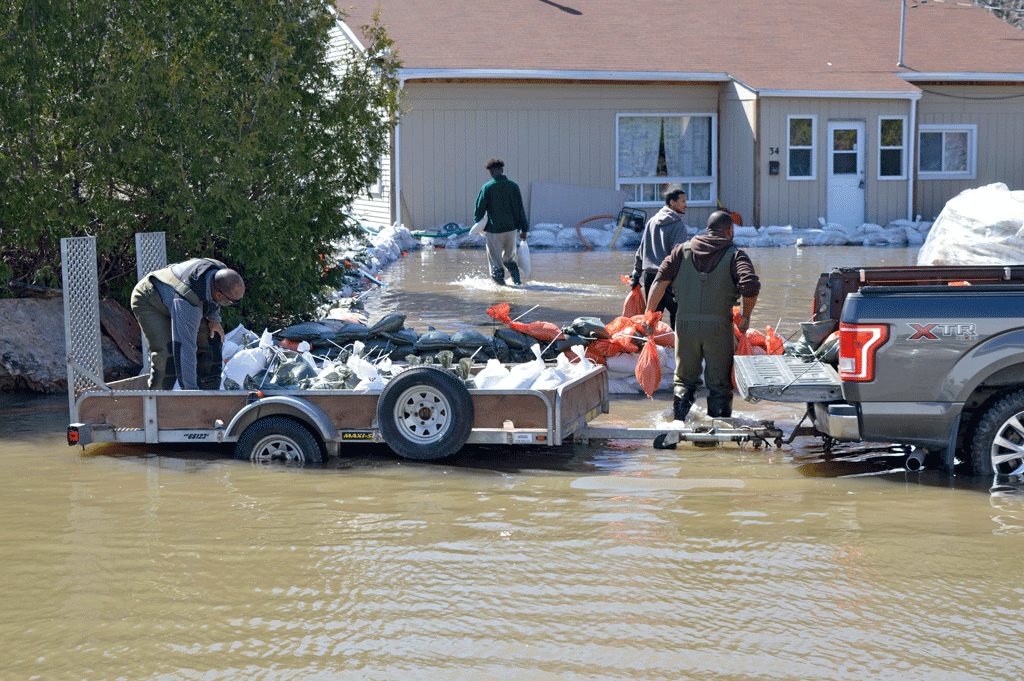
Volunteers help move sandbags to protect a home from rising flood waters near Ottawa Canada, during 2019 floods
Volunteers help move sandbags to protect a home from rising flood waters near Ottawa Canada, during 2019 floods. Credit: Colin Clarke / Alamy Stock Photo.

Take the UK, for example. While one study found climate change had increased the risk of floods in England and Wales in Autumn 2000 by at least 20% (and even up to 90%), another found little influence on summer rainfall in 2012 (pdf, p36).

This raises another important point. When it comes to interpreting the results of event attribution studies, it matters what the question is. For example, a 2013 study asked whether recent wet summers in north-western Europe were a response to retreating Arctic sea ice (pdf, p32). The answer from the study was “no”. But, as a foreword from that year’s BAMs report explains:

“Given the numerous ways climate change could influence precipitation in this region, a ‘no’ result for the role of Arctic sea ice should not be interpreted as an absence of any role at all for climate change.”

This is similar to an argument made by Dr Kevin Trenberth, distinguished senior scientist at the National Center for Atmospheric Research, and colleagues in a Nature Climate Change “perspective” article in 2015.

The paper notes that, in a chaotic weather system, the complex dynamics of the atmosphere mean the size and path of a storm or heavy rainfall event has a large element of chance. This can make it tricky to identify where climate change fits in, potentially underestimating its influence.

Therefore, rather than analysing the weather patterns that bring a storm to an area, the authors argue that scientists should be looking at how the impact of that storm has been boosted by temperature changes – known as “thermodynamic” effects. Higher temperatures mean warmer seas, higher sea levels and more moisture evaporating into the atmosphere. These are changes that scientists can be more confident in, the authors wrote, and so should be the focus for attribution studies – rather than looking at changes to circulation patterns in the atmosphere.

For example, the paper reexamines an earlier study (pdf, p15) that suggested climate change had reduced the chances of the five-day heavy rainfall event that hit north-east Colorado in September 2013. Trenberth and colleagues argue that while climate change might not have made the specific weather system that brought the rain more likely, it will have contributed to the sheer volume of moisture in the atmosphere.
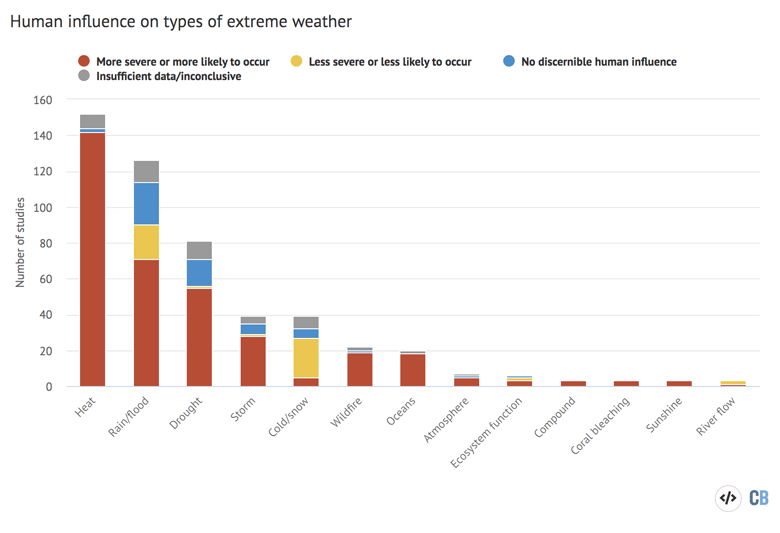
Chart shows the number of studies for each type of extreme event that fall within each category of human influence

Chart shows the number of studies for each type of extreme event that fall within each category of human influence: More severe/likely (red), less severe/likely (yellow), no influence (blue) and inconclusive (grey). Chart by Carbon Brief using Highcharts.

While attribution studies of heatwaves are generally more straightforward than storms – as they focus on thermodynamic influences – the type of question they are asking is still important. The Russian heatwave in 2010 is a good example of this. One study looking at the severity of the event did not find a role for climate change. Yet another one, which did find an influence, looked at the likelihood of the event.

This apparent contradiction is tackled by a third study that reconciles the other two. It explains that “the same event can be both mostly internally-generated [i.e. by natural variability] in terms of magnitude and mostly externally-driven [i.e. by human-caused climate change] in terms of occurrence probability”.

Otto, who is lead author of the third study, tells Carbon Brief:

“The studies, thus, only appear to be contradictory, but are, in fact, complementary.”

It is also important to stress that the absence of evidence for a link to climate change is not the same as evidence of absence. In other words, it does not necessarily mean there was no human influence, just that a particular analysis did not find one. This is why a single study should never be considered the final word on how climate change influences a given type of extreme weather.

Drought

Of the 81 drought events and trends considered here, climate change was found to have increased the severity or likelihood of 55 (68%). Of the remainder, the likelihood or severity was reduced for one event (1%), while no discernible link with human activity was found for 15 (19%) and 10 (12%) were inconclusive.
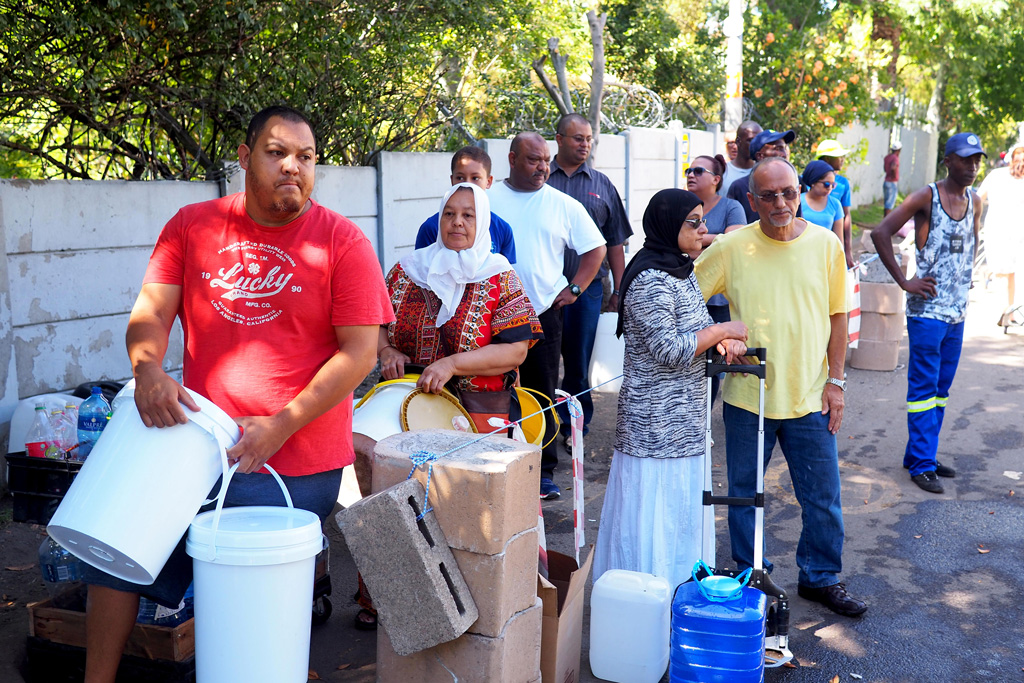
Capetonians queue for water at natural springs around the city during the water crisis, January 2018. Credit: tim wege / Alamy Stock Photo

Capetonians queue for water at natural springs around the city during the water crisis, January 2018. Credit: tim wege / Alamy Stock Photo

This mixed bag of results reflects the inherent complexity of droughts. And, again, the specific question matters. Conclusions about the role of climate change in a specific drought could depend on whether a study looks at temperature, rainfall or soil moisture, for example.

As the 2015 BAMS report explains:

“Drought continues to be an event type where the results require significant context, and easy answers often remain elusive because of the many meteorological, hydrological, and societal drivers that combine to cause drought.”

(For more on the different ways that droughts can be categorised, see this Carbon Brief guest post from 2018.)

Geographical reach

While much has been achieved in the field of extreme event attribution in a short space of time, scientists are constantly looking for ways to tailor their work to suit the people who might use it.

One major goal since the early days of the field has been to expand extreme event attribution to cover a larger and more diverse geographical area.

Where in the world scientists can carry out attribution studies – and for what kind of events – will always be limited by the quality and availability of observed data and appropriate models. The attribution map highlights, for example, that there are relatively few studies of extreme weather in Africa and South America.

In another example, scientists hoping to analyse Super Typhoon Mangkhut – which hit the Philippines in September 2018 – were unable to in part because of “very poor quality” observed data in publicly available datasets and a lack of models.

At the moment, there is also a heavy leaning towards weather events that are local to the modelling groups, or that have a particular scientific interest. Otto explains:

“For example, scientists often do attribution studies because an event occurs on their doorstep. The UK, California and Boulder [in Colorado] are, therefore, studied much more than other parts of the world, but that does not necessarily make them places particularly impacted by climate change.”

This means that while the studies carried out so far are indicative of the role climate change is playing in extreme weather around the world, they should not be considered representative of all types of extreme weather everywhere, says Otto. She tells Carbon Brief:

“[The studies so far] are part of a picture, but we don’t know what’s on the missing puzzle pieces. And, crucially, we don’t know how many pieces are missing.”

For example, Otto recently penned a Carbon Brief guest post on how the lack of monitoring of heatwaves in Africa means they are a “forgotten impact” of climate change.

Real-time extreme weather attribution

As well as expanding the science to cover different types of weather and more of the world, scientists are getting faster at turning the handle on extreme event attribution studies – sometimes crunching the numbers just days after an event has occurred.

The rapid studies included here are all produced by the World Weather Attribution (WWA) initiative, described earlier, or the UK Met Office.

An example of analysis performed by the latter includes their review of the UK’s weather in 2020, which was published by Carbon Brief. This showed that climate change increased the likelihood of the UK’s warm year by approximately a factor of 50.

While the WWA individual rapid assessments are not individually peer-reviewed, they are conducted using methods that have been through the peer-review process. As the 2014 BAMS report explains:

“Much like other routine analysis, such as an operational seasonal forecast, statements made about heat events using these methods do not necessarily need to go through the peer-reviewed literature to be considered credible.”

By conducting the analysis in the immediate aftermath of a weather event, these rapid studies provide almost-real-time information on the influence of climate change, rather than having to wait many months for a formal study.

(In some cases, these rapid assessments are later published in peer-reviewed journals. In these instances, the formal study is included in the attribution map, rather than the initial analysis. In some cases, this means earlier rapid assessments are removed from the Carbon Brief map in order to add in the relevant peer-reviewed paper once it is published.)
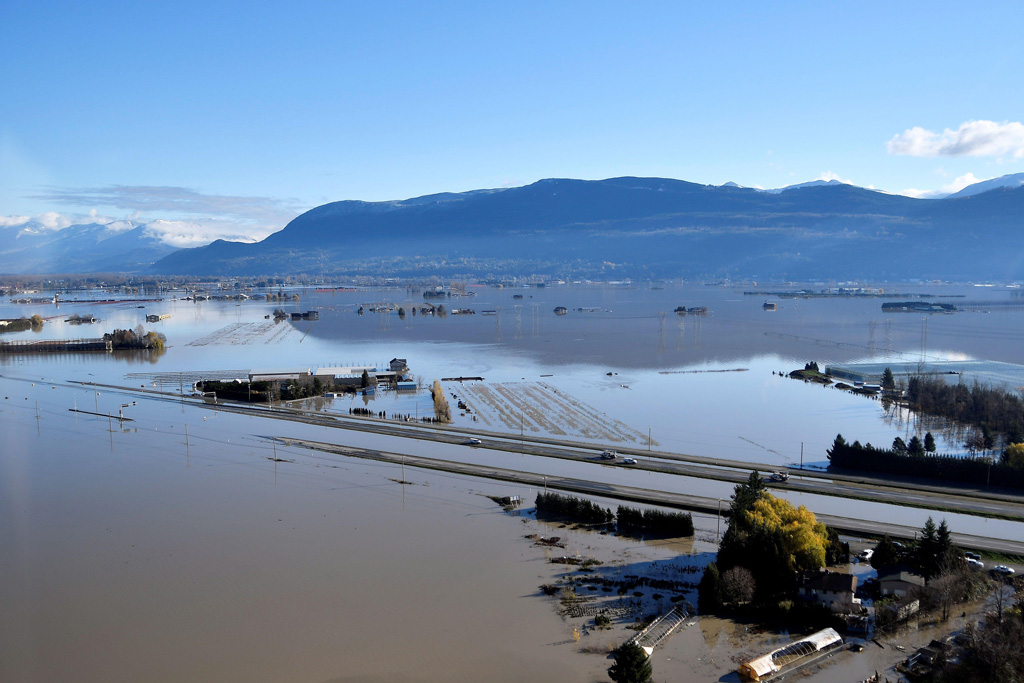
The Trans Canada highway remains partially submerged by flood water after rainstorms lashed the western Canadian province of British Columbia in November 2021
The Trans Canada highway remains partially submerged by flood water after rainstorms lashed the western Canadian province of British Columbia in November 2021. Credit: Reuters / Alamy Stock Photo.

The European Centre for Medium-Range Weather Forecasts (ECMWF) has been working on a pilot “operational attribution service” through the Copernicus Climate Change Service (C3S).

This collaboration between the UK Met Office, German weather service (DWD), Meteo France, Dutch weather service (KNMI) and the University of Oxford will “demonstrate how attribution of extreme weather events can be carried out operationally by national meteorological services”, Prof Stott tells Carbon Brief:

“In this project we are developing and testing the protocols we will need to enable rapid and reliable assessments of the extent to which recent extreme weather events have been made more or less intense or more or less likely by climate change. We started at the beginning of the year and so far we have tested our procedures on an analysis of the 2018 heatwave in Europe.”

The progress to date has “demonstrated the importance of international collaboration for developing new techniques and processes”, says Stott. But “national meteorological services across Europe will continue to have a particular remit to deliver advice on weather and climate in their own countries”, he adds:

“At the Met Office in the UK we are developing our operational attribution capability to help inform the public, policymakers and journalists about the extent to which damaging extreme weather events like the floods in Yorkshire [in 2019] have been affected by climate change.”

An evolving science

As the science of extreme event attribution has matured and become more nuanced, so has the choice of terminology around extreme weather and climate change.

While some attest that all extreme weather must be affected by a world that is warming, this warrants some caution. As the first BAMS report in 2012 noted:

“While it has been argued that in the Anthropocene, all extreme weather or climate events that occur are altered by human influence on climate…this does not mean that climate change can be blamed for every extreme weather or climate event. After all, there has always been extreme weather.”

But while it would be premature to suggest that any single study is the last word, it is clear that – in many cases – the science can do better than that. Similarly, scientific thinking has clearly moved on from the unsatisfactory statement that it is not possible to attribute any individual weather event to climate change. Indeed, as mentioned earlier, there have been some studies that have concluded that an event – or aspect of an event – would have been impossible without climate change.
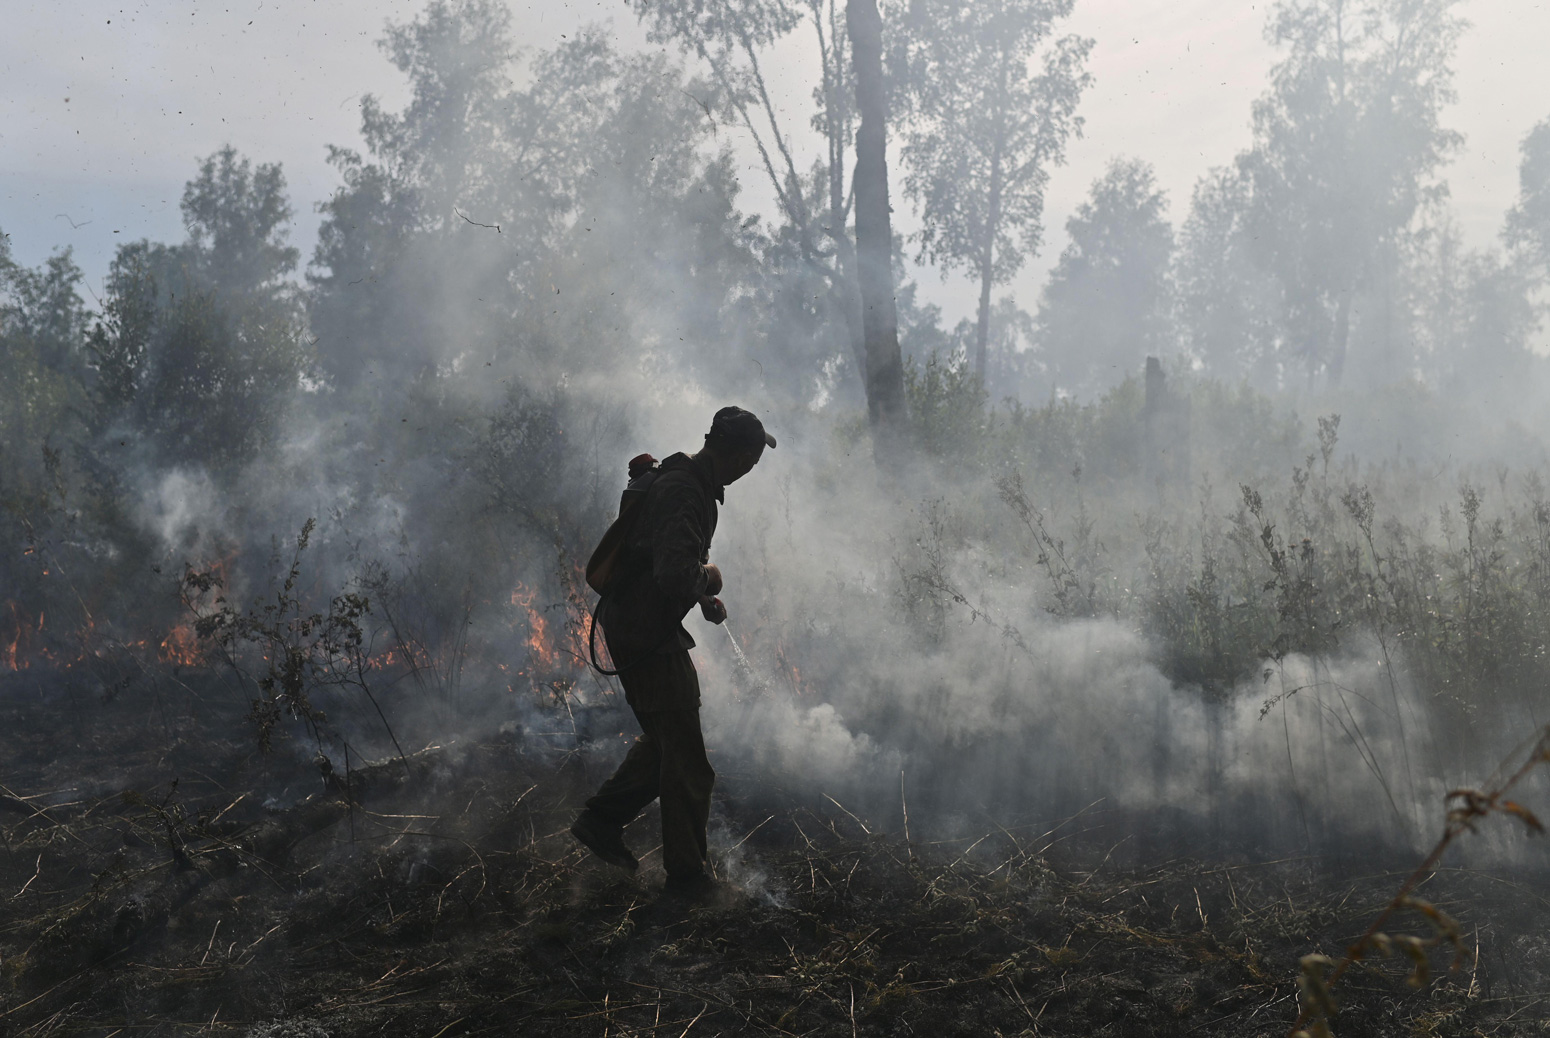
Russian Federal Agency for Forestry works to put out a forest fire in Basly, Russia in August 2020
Russian Federal Agency for Forestry works to put out a forest fire in Basly, Russia in August 2020. Credit: Reuters / Alamy Stock Photo.

Ultimately, there are no blanket rules in attribution. Scientists need to examine the circumstances of each individual weather event – or a longer pattern of events for trend studies. It is only by combining evidence from all around the world that they can begin to draw broader conclusions.

Attribution studies, therefore, rely heavily on the quality and availability of observational data and climate model simulations. In a short paper for the journal Weather, Dr Otto says that “the models used for attribution need to be able to reliably estimate the likelihoods of the types of events being attributed”.

As discussed earlier, attribution studies of heatwaves tend to be more straightforward because of their focus on thermodynamic effects, rather than atmospheric circulation. Yet, Otto tells Carbon Brief that recent studies suggest models overestimate the year-to-year variability of heat extremes in some parts of the world, and thus underestimate the trend and the role of climate change.

In a rapid attribution study of the western Europe summer heatwave in 2019, for example, Otto and her colleagues found that, for the month of June, the models “show about 50% smaller trends than observations in this part of Europe and much higher year-to-year variability than the observations”. Similarly, a study of the 2019-20 Australian bushfires noted that “models underestimate the observed trend in heat” and so the “real increase could be much higher”.

These findings emphasise how important it is to analyse models and observations together, Otto says:

“This made me realise just how important attribution is for the scientific community – and everyone using climate science – at bringing observations and models together in a very concrete real-world test case.

Attribution can, therefore, be used to help scientists “identify where the models are doing well and for what they are not in a much more direct way than the classical skill assessment of climate projections does”, adds Otto.

Forecasted attribution

One attempt to move attribution science forward was the very first “advance forecasted” attribution analysis, which quantified the impact of climate change on the size, rainfall, and intensity of Hurricane Florence before it made landfall in North Carolina in September 2018.

The analysis ran two sets of short-term forecasts for the hurricane: one as the climate is today and the other in a simulated world without human-caused climate change. The researchers concluded at the time:

“We find that rainfall will be significantly increased by over 50% in the heaviest precipitating parts of the storm. This increase is substantially larger than expected from thermodynamic considerations alone. We further find that the storm will remain at a high category on the Saffir­-Simpson scale for a longer duration and that the storm is approximately 80km in diameter larger at landfall because of the human interference in the climate system.”

The analysis received a mixed reaction. Prof Stott told Carbon Brief that it was “quite a cool idea”, but would be dependent on being able to forecast such events reliably. Dr Kevin Trenberth, distinguished senior scientist at the National Center for Atmospheric Research, described it as “a bit of a disaster”. He told Carbon Brief that the quality of the forecast was questionable for the assessment:

“The forecasts made were not good: the intensity of the forecast storm at landfall was category 4 or 5 as I recall, instead of category 2. And so the statements made were based on quite flawed assumptions: namely, that they had a good forecast.”

A key requirement for a reliable attribution study is for models to accurately replicate the extreme event, Trenberth added, but “obviously one can not assess the goodness of the forecast if one does this in advance”.

Houses in North Carolina sit in floodwater caused by Hurricane Florence
Houses in North Carolina sit in floodwater caused by Hurricane Florence. Credit: Reuters / Alamy Stock Photo.

The authors subsequently published a paper in Science Advances that “reviews the forecasted attribution with the benefit of hindsight”. The findings show that climate change increased rainfall amounts “associated with the forecasted storm’s core” by around 5%, and contributed to Hurricane Florence being “about 9km larger in mean maximum diameter (or a 1.6% increase in storm area) due to climate change”.

The authors acknowledged that the “quantitative aspects of our forecasted attribution statements fall outside broad confidence intervals of our hindcasted statements and are quite different from the hindcasted best estimates”. In short, the results are quite a way off what they forecasted.

However, the authors also said they have identified what went wrong with their forecasted analysis. Problems with the way their “without climate change” model runs were set up created a larger contrast against their real-world simulations. The results thus suggested that climate change would have a bigger impact than it actually did.

Nonetheless, the study did identify a quantifiable impact of climate change on Hurricane Florence, adding to the evidence from studies by other author groups, the researchers concluded:

“As the climate continues to warm, it is expected that extreme tropical cyclone precipitation events and resulting inland flooding will become yet more frequent.”

In addition, a 2021 study of the record Australian heat event of October 2015 noted the potential of their methods “to provide attribution statements for forecast events within an outlook period”. This will “allow for informed messaging to be available as required when an extreme event occurs, which is of particular use to weather and climate services”, the authors wrote.

On the topic of forecasts, a 2021 study showed how it was possible to use a weather forecast model for attribution. The researchers, who penned a Carbon Brief guest post about their work, tested their methods using the European heatwave of February 2019 – an event their model successfully predicted:

“We find that the direct impact of the extra carbon dioxide (CO2) that humans have pumped into the atmosphere made the event 42% more likely for the British Isles and at least 100% (two times) more likely for France.”

Their work “so far represents just the first few steps towards an operational forecast-based attribution system”, they noted.

Finally, as well as casting forwards, attribution can also look back in time. A 2020 study on the US “Dust Bowl” heat and drought events of the 1930s takes an unconventional approach of looking at how the past event “would behave” with present-day levels of greenhouse gases.

The researchers find that “the return period of a 1-in-100-year heatwave summer (as observed in 1936) would be reduced to about 1-in-40 years” in today’s climate.

Carbon Brief will continue to add new extreme event attribution studies to the map and update the accompanying analysis every year. Please get in touch with any suggestions of attribution studies that could be included.

The post Mapped: How climate change affects extreme weather around the world appeared first on Carbon Brief.

https://www.carbonbrief.org/mapped-how-climate-change-affects-extreme-weather-around-the-world/

Continue Reading

Climate Change

Interview: COP31 president says electrification is ‘surest way to protect citizens’

Published

on

Last month, COP31 president-designate Murat Kurum launched a target for 35% of the world’s final energy to come from electricity by 2035.

In an interview with Carbon Brief, Kurum says that the target was not a political choice, but instead reflects the latest evidence on “what is needed to keep 1.5C within reach”.

The ongoing Hormuz crisis means there is an “urgent” need for renewables and electrification, which are the “surest and cleanest way to protect citizens” from high energy prices.

Kurum says that the Brazilian and Ethiopian presidencies of COP30 and COP32, as well as the EU, UK and Canada, have welcomed the target.

He adds that “all have confirmed it will be central to discussions at COP31”.

In the interview, Kurum – who is also Turkey’s minister of environment, urbanisation and climate change – tells Carbon Brief where the target came from and what he expects to happen next.

Carbon Brief: You recently launched a target for 35% of the world’s final energy to come from electricity by 2035. Where did this idea come from?

Murat Kurum: The “35 by 35” target is grounded in technical data and based on the IEA [International Energy Agency] and IRENA [International Renewable Energy Agency] analysis of what is needed to keep [the 1.5C Paris Agreement target] within reach. The level was not chosen politically. Rather, it reflects what the science and the energy modelling tell us is required.

CB: Why do you think an electrification target is important right now?

MK: The case for the target is urgent right now. The latest war in the Gulf has made energy diversification – and, in particular, renewable energy transition and electrification – a top global priority, because it is the surest and cleanest way to protect citizens around the world from high and volatile energy prices.

At a time of real fragmentation in international relations, a single, shared target is needed to focus global efforts by aligning governments, businesses and investors behind a common benchmark and to send a clear market signal.

CB: Which countries are supporting this target so far?

MK: The reaction so far has been extremely positive and, while we presented our target at the UN June climate meetings in Bonn, our earlier conversations with parties at both the Petersberg and Copenhagen climate dialogues paved the way for this launch.

For example, the EU, UK, and Canada have welcomed the target, as have the Brazilian COP30 and Ethiopian COP32 presidencies. All have confirmed it will be central to discussions at COP31.

This support has been reflected in the business community as well, with polling by the We Mean Business Coalition showing that 90% of businesses expect to have largely electrified their operations by 2035 and that 88% expect electrification will make their business more competitive.

CB: How do you hope and expect to see this taken forward at the COP? Could it be in the formal COP outcomes, or part of the second global stocktake?

MK: We are now taking electrification forward as an “action agenda” initiative to bring actors together and drive progress. The action agenda and the [formal COP] negotiations are separate, but complementary, with different processes and thresholds, and it is too early to say what all countries might be able to agree in the negotiations. That is for parties to determine as the year progresses.

We are focused and determined to use COP31 as a moment to spark a global conversation about electrification.

CB: What are the key priorities for reaching the target?

MK: The critical sectors for reaching the target are buildings, transport and industry, which together account for around 45% of global emissions. Financial support for the developing world and investment in grids and infrastructure is also crucial.

The target also builds on COP28’s target to triple renewable energy capacity and seeks to take advantage of the tumbling cost of renewable power and other technologies critical to the energy transition. This is a journey that Turkey itself is taking ambitious steps on, including our plan to reach 120GW [gigawatts] of renewable capacity by 2035.

This interview was first published in the 10 July 2026 edition of Carbon Brief’s DeBriefed weekly newsletter. Sign up for free.

The post Interview: COP31 president says electrification is ‘surest way to protect citizens’ appeared first on Carbon Brief.

Interview: COP31 president says electrification is ‘surest way to protect citizens’

Continue Reading

Climate Change

DeBriefed 10 July 2026: Deadly Europe heat | EU electrification leak | COP31 president interview

Published

on

Welcome to Carbon Brief’s DeBriefed. 
An essential guide to the week’s key developments relating to climate change.

This week

‘Catastrophic’ climate impacts

RECORD HEAT: Western Europe experienced its hottest June on record – some 3C above average – according to analysis covered by the Guardian. It said the finding came “as the UK enters its third heatwave of the year and wildfires ravage France and Spain”. Le Monde said 10,000 people had been evacuated due to wildfires in southern France.

‘EXCESS DEATHS’: The June heatwave killed more than 2,700 people in France, according to a guest post analysis for Carbon Brief. Similar analysis for Germany said there had been more than 5,000 “excess deaths”, reported Bloomberg. Meanwhile, an ongoing heatwave in the US has killed at least 30 people, said USA Today.

STORM TEST: Floods have killed 39 people in Guangxi province in southern China, said state-run newspaper China Daily. Scientists warned that climate change and the weather phenomenon El Niño are exposing China to “catastrophic storms” that will test its resilience in 2026, reported Reuters. The nation’s latest official climate report found that “extreme weather and climate events…have become more frequent and severe”, said China National Radio.

Around the world

  • EU ELECTRIFICATION: The European Commission is set to unveil a 2040 target for EU electrification on 17 July, reported Bloomberg. Citing a leaked draft, it said the plan would aim to cut oil use in half and gas use by two-thirds.
  • PEAKING PLAN: China has published an “action plan” for peaking emissions during the 15th five-year plan period to 2030, reported Xinhua. It lists targets including “new energy vehicles” making up 30% of cars on the road by 2030, said Reuters.
  • CLIMATE ‘FLAT EARTHER’: The Trump administration has appointed Matthew Wielicki, described by Politico as a “climate critic”, to lead the office in charge of the US national climate assessment. Common Dreams quoted a scientist describing the move as “like putting a flat-earther in charge of NASA”.
  • UGANDAN SUIT: A group of farmers from Uganda have launched a legal suit in London against the East African oil pipeline, according to Climate Home News.

23%

The share of Irish electricity used by data centres in 2025, reported the Irish Times.

2%

The share of global electricity used by data centres in the same year, according to Carbon Brief analysis of the Energy Institute statistical review.


Latest climate research

  • Meltwater from the western Himalayan glaciers will peak at around 2C of warming, before declining at higher warming levels | Environmental Research Letters
  • Current coral restoration efforts may be unsuitable for temperate reefs, including those in the Mediterranean | Nature Ecology & Evolution
  • People tend to underestimate the level of “broad public support” for climate action | Nature Climate Change

(For more, see Carbon Brief’s in-depth daily summaries of the top climate news stories on Monday, Tuesday, Wednesday, Thursday and Friday.)

Captured

Average number of days per year with a daily maximum temperature of at least 30C in a selection of major European cities, for each decade since the 1950s

Carbon Brief explained – via eight facts – why air conditioning rates in some parts of Europe are relatively low, as the technology emerges as a new front in the global “culture war” over climate action. Analysis for the article illustrated that, in many parts of the world’s fastest-warming continent, air conditioning simply was not needed in the past.

Spotlight

COP31 president speaks to Carbon Brief on electrification

This week, Carbon Brief interviews Murat Kurum, president-designate of the COP31 UN climate talks in November and Turkey’s minister of environment, urbanisation and climate change, on his target to boost global electrification.

Carbon Brief: You recently launched a target for 35% of the world’s final energy to come from electricity by 2035. Where did this idea come from?

Murat Kurum: The “35 by 35” target is grounded in technical data and based on the IEA [International Energy Agency] and IRENA [International Renewable Energy Agency] analysis of what is needed to keep [the 1.5C Paris Agreement target] within reach. The level was not chosen politically. Rather, it reflects what the science and the energy modelling tell us is required.

CB: Why do you think an electrification target is important right now?

MK: The case for the target is urgent right now. The latest war in the Gulf has made energy diversification – and, in particular, renewable energy transition and electrification – a top global priority, because it is the surest and cleanest way to protect citizens around the world from high and volatile energy prices.

At a time of real fragmentation in international relations, a single, shared target is needed to focus global efforts by aligning governments, businesses and investors behind a common benchmark and to send a clear market signal.

COP31 president-designate Murat Kurum. Credit: Supplied by COP31 secretariat

CB: Which countries are supporting this target so far?

MK: The reaction so far has been extremely positive and, while we presented our target at the UN June climate meetings in Bonn, our earlier conversations with parties at both the Petersberg and Copenhagen climate dialogues paved the way for this launch.

For example, the EU, UK, and Canada have welcomed the target, as have the Brazilian COP30 and Ethiopian COP32 presidencies. All have confirmed it will be central to discussions at COP31.

This support has been reflected in the business community as well, with polling by the We Mean Business Coalition showing that 90% of businesses expect to have largely electrified their operations by 2035 and that 88% expect electrification will make their business more competitive.

CB: How do you hope and expect to see this taken forward at the COP? Could it be in the formal COP outcomes, or part of the second global stocktake?

MK: We are now taking electrification forward as an “action agenda” initiative to bring actors together and drive progress. The action agenda and the [formal COP] negotiations are separate, but complementary, with different processes and thresholds, and it is too early to say what all countries might be able to agree in the negotiations. That is for parties to determine as the year progresses.

We are focused and determined to use COP31 as a moment to spark a global conversation about electrification.

CB: What are the key priorities for reaching the target?

MK: The critical sectors for reaching the target are buildings, transport and industry, which together account for around 45% of global emissions. Financial support for the developing world and investment in grids and infrastructure is also crucial.

The target also builds on COP28’s target to triple renewable energy capacity and seeks to take advantage of the tumbling cost of renewable power and other technologies critical to the energy transition. This is a journey that Turkey itself is taking ambitious steps on, including our plan to reach 120GW [gigawatts] of renewable capacity by 2035.

Watch, read, listen

HEATED: A Financial Times long read asked if Europe – the world’s fastest-warming continent – is “prepared for a world of extreme heat”.

LITIGATED: The Outrage and Optimism podcast spoke to Prof Joana Setzer and Catherine Higham about the latest trends in climate litigation.

‘SHATTERED’: Confidence in fossil-fuel exports via the strait of Hormuz has been “shattered”, wrote IEA chief Fatih Birol for Foreign Policy.

Coming up

Pick of the jobs

DeBriefed is edited by Daisy Dunne. Please send any tips or feedback to debriefed@carbonbrief.org.

This is an online version of Carbon Brief’s weekly DeBriefed email newsletter. Subscribe for free here.

The post DeBriefed 10 July 2026: Deadly Europe heat | EU electrification leak | COP31 president interview appeared first on Carbon Brief.

DeBriefed 10 July 2026: Deadly Europe heat | EU electrification leak | COP31 president interview

Continue Reading

Climate Change

Eight facts about air conditioning amid an overheated global debate

Published

on

As successive heatwaves hit Europe, air-conditioning (AC) has emerged as a new front in the international “culture war” over climate action.

France, Germany and the UK have experienced record-breaking heat and thousands of heat-related deaths this summer, with June temperatures in many regions passing 40C.

This has drawn attention to the relatively low rates of AC use in these countries – and in Europe as a whole – especially when compared to its widespread adoption in the US.

Legacy newspapers, bloggers and even Elon Musk have all weighed in on “European hostility” to AC, criticising Europe’s “cultural conservatism” and “overbearing governments”.

Right-wing politicians, including National Rally in France and the UK Conservatives, have styled themselves as champions of AC, while opposing efforts to tackle climate change.

Missing from most of these interventions is the fact that human-caused climate change has made once-rare heat far more common, in what is the world’s fastest warming continent.

Carbon Brief analysis for this article shows that, until the 2020s, it was rare for many European cities to see days above 30C, making AC an unnecessary expense.

Here, Carbon Brief explains – via eight facts – why AC rates in some parts of Europe are relatively low, as well as clarifies and contextualises some of the misleading claims circulating about the technology.

Much of Europe has not needed AC in the past

AC installation rates in northern parts of Europe are very low. The best available estimates suggest that 6% of households in Germany and just 4% in England use AC.

However, these rates are largely explained by the historical climates in these nations.

Unlike the US, much of the housing stock and infrastructure in Europe was built at a time when AC did not exist and was not necessary.

Moreover, nations such as France, Germany and the UK have only started to regularly experience extreme heat in recent decades.

The chart below shows the average number of days per year, in each decade since the 1950s, when maximum temperatures have exceeded 30C in major European cities. Capitals such as London and Paris have seen a significant jump since around 2000.

Average number of days per year with a daily maximum temperature of at least 30C in a selection of major European cities, for each decade since the 1950s
Average number of days per year with a daily maximum temperature of at least 30C in a selection of major European cities, for each decade since the 1950s. Source: Copernicus ERA5, Carbon Brief analysis by Dr Zeke Hausfather.

Prof Jan Rosenow, an energy and climate researcher at the University of Oxford, tells Carbon Brief:

“For most of the 20th century, northern Europe simply didn’t need cooling. Homes in Britain and Germany were built to keep heat in, not out, because winters were cold and summers rarely hot.”

Much of the commentary about the relatively low rates of European AC use focuses on cultural or “ideological” factors. (See: Some European nations have ‘resisted’ AC – but its popularity is growing.)

However, Rosenow says people’s views on AC in these countries likely stem from their historically colder climates. He adds:

“Attitudes formed around those facts, not the other way round…There is a cultural element, but it is the product of climate, not of some green ideological project.”

In the past, many in Europe relied on traditional methods to keep buildings cool. Richard Black, head of communications at Climate Analytics, made this point in a post on LinkedIn:

“Once, residents of cities such as Paris could cope with summer heatwaves by opening shutters and windows during the night, and closing them again in the morning to trap the cool air inside…We’ve reached a limit to this sort of adaptation.”

Now, with Europe around 2.5C warmer than pre-industrial levels, climate change is routinely driving record-breaking heatwaves, even in the north of the continent.

This is forcing a reappraisal of societies that were “built for a climate that no longer exists”, as the UK’s Climate Change Committee (CCC) put it in a recent report.

Experts broadly agree that much of Europe will indeed need more AC, particularly in spaces housing the most vulnerable populations, such as care homes, schools and hospitals.

At the same time, they also emphasise broader, “passive” efforts to make cities and homes cooler alongside increased AC use. (See: AC is not the only answer to overheating cities.)

Back to top

AC is already widely used in hotter parts of Europe

During periods of extreme heat, articles criticising “European hostility” towards the technology frequently note that “only about 20%” of households in Europe have AC.

Often, this is contrasted with the US, where more than 90% of households have AC installed. (In fact, the US is something of a global outlier, matched only by Japan.)

However, the continent-wide figure for Europe obscures the reality. In southern Europe – where temperatures are and have always been higher – AC is relatively common.

The map below, based on official EU data, shows that southern European nations use far more household energy for “space cooling” than those in the north.

Percentage share of household energy consumption used for “space cooling”, including AC, in EU member states and the Balkans
Percentage share of household energy consumption used for “space cooling”, including AC, in EU member states and the Balkans. Source: Eurostat.

Government figures show that nearly 60% of Italian households have AC. Household-level data in many countries is patchy, but various analyses have placed that figure at 70-80% in Greece and 41% in Spain – with higher penetration in the hotter, southern part of the country.

The same pattern can be seen within France. International coverage has stressed the country’s “cultural resistance to AC”, citing a nationwide figure from 2020 that suggests “only” 25% of French households have AC.

However, polling data from customers of the Hello Watt energy app suggests that there is a distinct north-south divide in French uptake. At least 60% of households in Mediterranean regions of France are equipped with AC, according to these figures.

This can be seen in the map below, with households across northern regions, including Paris, reporting far lower AC installation rates, often below 5%.

Percentage share of households equipped with AC in departments of mainland France
Percentage share of households equipped with AC in departments of mainland France, according to polling data. Source: Hello Watt.

Finally, when making such comparisons to Europe, it is worth noting that high rates of AC use reported for the entire US also obscure significant differences between – and within – US states. This, too, aligns with differences in regional climate.

Hotter states in the US south have near-universal AC access. But in Washington, a north-western state with a climate more comparable to that of western Europe, 66% of people have AC in their homes.

Back to top

Some European nations have ‘resisted’ AC – but its popularity is growing

International commentators have written extensively about Europe’s “longstanding resistance to cooling technology”, especially when compared to the US.

Newspaper editorials in the Washington Post and the Wall Street Journal, alongside numerous op-eds and blog posts, have added fuel to this “culture war”. Elon Musk has even promoted an AI-generated message stating that Europeans “should just install AC”.

Often, European attitudes are attributed to “guilt” about AC’s energy demand, “cultural conservatism” or “overbearing governments”. One commentator ascribed divergent attitudes in Europe and the US to “different ideas about physical suffering and sacrifice”.

Meanwhile, right-leaning commentators and climate-sceptic groups have blamed “climate policies, which view AC as an unnecessary luxury”.

In general, these critiques often fail to consider the most obvious explanation, which is that AC adoption is low in northern Europe because the historical climate made AC unnecessary.

Critical articles have instead drawn attention to restrictions on AC use in some European countries, as well as the lack of support for AC in official heatwave guidance.

For France, in particular, polling has indeed highlighted widespread disapproval of AC, both on environmental grounds and due to alleged health impacts. Such messages have also been voiced regularly in French media and by left-leaning and green politicians.

However, across Europe there are plenty of signs that such attitudes are shifting, following successive spells of extreme heat.

Amid the June heatwave, there were reports from Germany, France and the UK of “skyrocketing” AC sales. This surge was even acknowledged by the foreign ministry in China, due to the nation’s role in supplying many of these products.

The shift is taking place in politics as well. Marine Tondelier, leader of the French Green party – which has traditionally opposed AC – recently stated that “there are places where we just can’t do without AC anymore”.

Overall, AC has been on the rise across Europe, with France, Spain and the Netherlands all using more than twice as much energy for AC and other “space cooling” technologies in 2024 as they did in 2015.

AC production in Germany has also risen by at least 75% in recent years and a growing share of German homes are being built with it installed.

Notably, there is little evidence that “climate policies” are blocking Europeans from installing AC. Polling in Germany shows that, while people are concerned about environmental impacts, the high costs of installing and running it are perceived as greater barriers.

Finally, there is an important distinction between individual AC units in people’s homes and installing them in public spaces, such as hospitals, care homes and schools.

While neither is widespread in France, support for the latter can increasingly be found across the political spectrum, from Greens to the far-right National Rally (RN).

Back to top

AC emissions are growing, but its climate impact could be limited

Some people have noted that a wider rollout of AC in Europe could drive up emissions.

As noted in the Financial Times by columnist and chief data reporter John Burn-Murdoch, there is a logic to this argument, “at least superficially”. He writes:

“AC uses a lot of energy; if the proposed defence against emissions-driven global warming means emitting more, then we have an obvious problem.”

The emissions impact of AC depends heavily on the generation mix of a country’s power sector.

According to the International Energy Agency (IEA), “space cooling” – mostly AC, but this does include some fans – used 2,100 terawatt-hours (TWh) of power globally in 2022.

As such, it was responsible for 1bn tonnes of carbon dioxide (CO2) from electricity use globally. This equates to around 2.7% of total CO2 emissions globally from fossil fuels and industry.

(As well as indirect emissions through power use, AC units can also directly release greenhouse gases – used as AC refrigerants – when they leak or are improperly disposed of. Following the 2016 Kigali Amendment, countries are progressively trying to phase down the use of potent greenhouse gases in AC units.)

In a LinkedIn post, Lauri Myllyvirta, lead analyst at the Centre for Research on Energy and Clean Air and regular Carbon Brief contributor, says:

“There is a lot of alarmist messaging about how much electricity AC uses. However, on an annual basis, the demand is not that substantial. Currently, AC uses about 1% of electricity in the EU and catching up to adoption rates in the US would double this.”

According to the IEA estimates from 2018, “if left unchecked, energy demand from AC will more than triple by 2050”, reaching 6,200TWh of power.

By mid-century, households would contribute the most to the increase (70%), with at least two-thirds of the world’s households potentially having AC, according to the Paris-based agency.

Decarbonising electricity grids and energy-efficiency improvements can reduce AC emissions and their impact on climate.

For instance, in countries with a low-carbon electricity mix – such as France, where nuclear energy accounts for 67% of its electricity generation – expanding AC would have a more limited climate impact than in other countries.

In countries such as India, there could be a more significant increase in emissions as AC is adopted, due to the role coal plays in the country’s energy mix, especially during the night. Demand is growing fast – following low access historically – and many AC units are inefficient, with high electricity use.

According to a new working paper from the India Energy and Climate Center (IECC) at the University of California, Berkeley, “room AC” – portable plug-in units, as opposed to those permanently installed in buildings – already accounts for nearly one-quarter of India’s peak electricity demand (60-70GW) – and this is before the majority of Indian households have bought their first AC unit.

Dr Nikit Abhyankar, co-faculty director of the IECC, tells Carbon Brief that, as AC use is expanded across the world, it should be paired with solar and battery storage, where the “economics have completely shifted” in the last few years. This will help to cut both energy bills and emissions.

According to the IEA, accelerating energy efficiency improvements could deliver more than one-third of all CO2 emission reductions between now and 2030.

The global energy demand needed to run ACs alone in 2050 could be reduced by 1,300GW – the equivalent of all of China and India’s coal plants – through energy efficiency measures, it estimates.

Aditya Valiathan Pillai, a climate adaptation researcher at King’s College London, tells Carbon Brief that, as the use of AC expands, there is a conversation to be had about where and “what type of technology [is used] and who gets access” to it.

A final point is that many AC units are air-to-air heat pumps, which can efficiently heat homes, as well as keeping them cool. As such, wider AC adoption could boost the adoption of electrified heat, helping to cut emissions from gas boilers.

Back to top

Heat from AC can contribute to directly warming cities

Some critics of AC mention its electricity demands and associated CO2 emissions from fossil-fuel combustion, which contribute to raising the temperature of the entire planet. (See: AC emissions are growing, but its climate impact could be limited.)

But AC also has a localised impact. It works by removing heat from indoor air and pushing it outdoors, raising temperatures on the street and exacerbating the “urban heat island” effect.

Left-leaning French politicians are among those citing this as an argument against AC, particularly in cities. Indeed, Emmanuel Grégoire, the Socialist mayor of Paris, appeared to be making this point in an interview with Le Monde, during the June heatwave:

“[AC] can be useful for cooling collective spaces and protecting the most vulnerable populations, but individual AC is a scourge – it makes the problem worse by heating the city even more.”

One study concludes that, in a city such as Phoenix, Arizona, where the technology is widespread, AC use during a heatwave can raise night-time temperatures by 1-1.5C.

Another models a nine-day heatwave in Paris – in a future with “massive” AC use – and finds an increase in external temperature of more than 2C, due to heat emitted by the units.

Given this, some scientists argue that AC can be a form of climate “maladaptation” – referring to actions that backfire and make people more vulnerable to global warming.

The Intergovernmental Panel on Climate Change (IPCC) has highlighted this issue, concluding:

“AC may constitute a maladaptation because of its high demands on energy and associated heat emissions, especially in high-density cities.”

Compared to the US, more people in Europe live in dense, urban areas. According to Dr Vincent Viguié, a climate change economist at École des Ponts ParisTech, this could leave Europeans more exposed to heat from AC units. He tells Carbon Brief:

“If you live in a neighbourhood that is not dense, like in a suburban neighbourhood or in the countryside, you don’t care about this…So, once again, there is a key difference between US and European cities.”

Viguié is among the experts arguing that other climate-adaptation measures should be considered alongside AC, to keep entire cities cool – not just individual homes. He says:

“It’s not to say that the heat released by AC by itself is a reason to forbid AC…It’s just that not taking that into account may lead to bad decisions.”

Back to top

More AC could help to reduce heat deaths in Europe

Heatwaves can be deadly, especially for older or vulnerable members of society.

According to climate scientists at World Weather Attribution, “heatwaves cause more deaths in Europe than all other natural hazards combined”.

The heatwave in June 2026 is estimated to have killed more than 20,000 people in Europe. In France – which has seen some of the hottest temperatures – the heatwave caused more than 2,700 heat-related deaths, according to analysis published by Carbon Brief.

AC does help to protect people from the effects of extreme heat. A 2021 study found that globally, AC averted an estimated 190,000 heat-related deaths annually during 2019-21.

With its much higher penetration of AC, the US has fewer deaths due to extreme heat than Europe.

Heat kills around 11 people out of every 100,000 in Europe, compared to around two people in the US, according to analysis by data scientist Dr Hannah Ritchie from Our World in Data.

Several publications have pointed out that “Europe’s heatwaves are deadlier than American gun violence”. While this is technically accurate in absolute terms, Ritchie says the comparison is “a bit silly” for a number of reasons, not least because on a per-capita basis, US gun deaths are higher.

Average annual deaths per 100,000 for heat and gun deaths in the US (red) and Europe (blue) to as close to the end of 2024 as possible
Average annual deaths per 100,000 for heat and gun deaths in the US (red) and Europe (blue) to as close to the end of 2024 as possible. Heat deaths are based on excess death methodology, not death certificates. Source: By the Numbers.

However, experts suggest that AC is only one part of a wider effort to protect people from extreme heat.

A 2020 study looking at heat-related mortality in Canada, Japan, Spain and the US, found that excess deaths due to heat decreased between 1972 and 2009.

For example, the proportion of deaths due to extreme heat fell from 1.7% to 0.5% over the period in the US and 3.5% to 2.8% in Spain.

However, an increase in AC only explained 16.7% of the drop in the US and 14.3% in Spain.

The research concludes that “other factors have played an equal or more important role in increasing the resilience of populations”. This is supported by research that shows changes to cities, such as planting more trees, as well as behavioural shifts and public-health measures, can all protect people from dangerous heat.

Additionally, across Europe there is already a range of policies and measures in place to protect the most vulnerable from heatwaves. Many of these were brought in following the unprecedented summer of 2003, when 70,000 died from extreme heat.

These policies were highlighted by French environment minister Agnès Pannier-Runacher, in response to the far-right National Rally (RN) party’s AC proposals:

“The incompetent RN has just found out that nursing homes need air-conditioned rooms. Thank you, but it’s actually been mandatory since 2004.”

Another study found that measures that have already been rolled out in France would cut the projected death toll of a 2003-like heatwave by more than 75%. This is in part due to the expansion of AC in places such as nursing homes, but also other approaches, such as heat action plans.

For example, France has a multi-tiered action plan, which includes local governments ensuring access to cooled spaces and water, keeping a list of vulnerable individuals for targeted interventions, as well as national information campaigns.

According to the UN’s office for disaster risk reduction, this French plan has led to a “significant reduction in heat-related mortality”.

While action plans have proved successful in a number of nations, less than half of European countries have such a plan in place.

Back to top

‘Net-zero rules’ are not blocking AC installation in the UK

In the UK, Conservative politicians and right-leaning media have tried to pit the adoption of AC against net-zero policy.

Writing in the climate-sceptic Daily Telegraph, columnist Matthew Lynn claimed falsely:

“Strict net-zero rules now mean that aircon is effectively banned in the UK.”

(Further down the article, he concedes: “AC is not strictly speaking banned in new-build homes in the UK. But tough environmental rules mean that it is very hard, and expensive, to install in practice.”)

The same narrative has been used in articles by GB News, the Sun and others. A separate article in the Daily Telegraph’s “money” section goes further, claiming that AC had been “torn from homes under net-zero clampdown”.

A blog post from the Ministry of Housing, Communities and Local Government rebuts these claims, stating:

“There has been media coverage this week suggesting that AC is banned in homes. This is incorrect.”

For the UK, while it is true that fewer than 5% of homes currently have AC, this is largely due to the fact that it was not hot enough in the past to warrant the expense. Historically, the focus has therefore been on keeping buildings warm, rather than cool.

Extreme heat has previously been rare in the country, so homes were built with insulation and other measures to keep heat in during the “dank winters”. (See: Much of Europe has not needed AC in the past.)

Current regulations do not ban the installation of AC outright. However – as the government’s blog post notes – there is no blanket rule, meaning there are some localised differences.

Certain areas – or certain kinds of properties – may be subject to additional complications for installing AC.

In a 2025 video on Instagram, shadow secretary of state for energy security and net-zero Claire Coutinho referenced the London plan, for example, which is a framework for development in the capital launched in 2021. She said:

“[London mayor] Sadiq Khan says no. The London plan says we shouldn’t have air con because it uses too much energy. But this is mad! This is a poverty mindset that we need to get away from.”

The London Plan does not stop homes from having AC. It simply says that, for new buildings, passive design measures should be prioritised, such as the orientation of the building, the window design and incorporation of measures such as external shading and trees.

A recent response from the mayor added further measures, such as the need to “minimise the necessity for the operation of mechanical measures including AC, which would further add to the heat island effect within urban areas and add operational cost to residents”.

Elsewhere, new-build homes across England must meet the requirements of “part O” of the 2022 building regulation updates. This includes addressing overheating in buildings through energy-efficient design and prioritising passive cooling, with AC as a last resort.

For existing buildings, most AC units fall under “permitted development rights”, meaning no planning application is required to install them.

Additionally, regulations were relaxed in 2025 to make it easier to install an air-to-air heat pump – which can both heat and cool air – without planning permission.

This means that, far from blocking the expansion of AC, net-zero policy has made it easier to install specific cooling systems.

Speaking to Carbon Brief, Andrew Sissons, director of sustainable future at Nesta, says the government must now implement its announced £2,500 subsidy for air-to-air heat pumps “as quickly as possible”, to further ensure that the technology can be rolled out efficiently. He adds:

“[The government] should also continue to expand permitted development rights for air-to-air heat pumps, with a particular focus on flats and homes in denser areas. As long as heat pumps meet the MCS [Microgeneration Certification Scheme] noise test, there are few reasons to limit their use via the planning system.”

Some properties, such as large homes, listed buildings or those in conservation areas, may still require planning permission to install an air-to-air heat pump or other AC. Sissons notes that this can add cost and delay to installation.

While it cannot be said that AC has been blocked or banned due to net-zero, neither has it been prioritised.

This may shift as temperatures continue to rise. UK government advisors at the Climate Change Committee (CCC) suggest that 22% of the UK’s housing stock will likely need active cooling, such as AC, to cope with 2C of global warming.

The CCC’s recent adaptation report also calls for all new homes to be built using low-cost, passive cooling measures, alongside more AC.

Active cooling such as AC is more likely to be needed for retrofitting existing homes, the report adds.

Back to top

AC is not the only answer to overheating cities

AC has become increasingly politicised in Europe, as demonstrated by France’s RN party announcing its “grand plan for AC” in all public buildings.

As noted by Dutch MEP Gerben-Jan Gerbrandy, this “far-right” embrace of AC is coming from the same people who for years have “delayed emissions reductions”.

In response, left-leaning policymakers in Europe have frequently downplayed the role of AC, prioritising programmes of urban greening and retrofitting older buildings.

Such approaches for dealing with extreme heat have already proved successful. Therefore, many experts argue that these methods, alongside AC, will be essential to prepare for a hotter world.

According to the IPCC’s sixth assessment report, adaptive infrastructure, such as urban forests and green roofs, can reduce energy use because of cooling, with co-benefits for climate, air quality, physical and mental health.

While retrofitting older buildings for heat as well as insulating them from the cold might prove challenging, urban greening and an active shade policy – one that determines how much of every street is exposed to direct sunlight – are simple measures cities can adopt.

Some experts have also warned about the high cost of running AC, expressing concerns that excessive reliance on the technology could increase energy poverty.

In a Carbon Brief guest post published in 2025, researchers at the Basque Centre for Climate Change found that framing AC as the “default solution” can miss the opportunity to design “more inclusive, human-centred responses” to rising temperatures.

William Lewis, a PhD candidate and one of the guest post’s authors, tells Carbon Brief it is not a case of “one or the other”, when considering AC and other options:

“We have this opportunity in European countries to choose a slightly different path [from the US], which isn’t AC in every single home.”

King’s College London’s Pillai says that, by centring the debate on AC, the far-right response to the heatwaves in Europe has “completely neglected the science of how you cool human beings”.

There are many solutions, he adds, that are already widely used across hot developing countries, such as ceiling fans, windows that open and cross-ventilation, as well as strategies to reduce cumulative hours of heat exposure.

Pillai tells Carbon Brief that, while places reaching 42C and higher “definitely need to think about AC very seriously”, places in the “low to mid 30Cs” could rely on these alternatives.

Behavioural change, he adds, is the “least glamorous part” of heat policy, but “pulls most of the weight” of protecting people. These include a wide range of actions and responses – from reducing heat exposure, to wearing lighter clothing and drinking more water and fluids.

There are also workplace protections. Pillai tells Carbon Brief that these could include legislation on mandatory work breaks, cooling and shade requirements at workplaces, as well as health insurance that covers heat stress days that have been lost by heat-exposed workers.

Back to top

The post Eight facts about air conditioning amid an overheated global debate appeared first on Carbon Brief.

Eight facts about air conditioning amid an overheated global debate

Continue Reading

Trending

Copyright © 2022 BreakingClimateChange.com