
Weather Guard Lightning Tech
Inside Power Curve Testing with ArcVera Renewables
Allen and Joel discuss power curve testing with John Bosche, co-founder of ArcVera Renewables and member of the IEC technical committee that sets the global 61400-12-1 standard. He breaks down the nitty-gritty details and complex requirements for accurately measuring a wind turbine’s all-important power performance. Visit https://www.arcvera.com/
Sign up now for Uptime Tech News, our weekly email update on all things wind technology. This episode is sponsored by Weather Guard Lightning Tech. Learn more about Weather Guard’s StrikeTape Wind Turbine LPS retrofit. Follow the show on Facebook, YouTube, Twitter, Linkedin and visit Weather Guard on the web. And subscribe to Rosemary Barnes’ YouTube channel here. Have a question we can answer on the show? Email us!
Pardalote Consulting – https://www.pardaloteconsulting.com
Weather Guard Lightning Tech – www.weatherguardwind.com
Intelstor – https://www.intelstor.com
Allen Hall: Welcome to the special edition of the Uptime Wind Energy Podcast. I’m your host, Allen Hall, along with co host, Joel Saxum. A wind turbine’s power curve is key to a revenue generating wind farm. We have not discussed power curve measurements on the podcast before, even though we do. Run across them all the time.
And we thought it was due time to bring in an expert. And our guest today is John Bosch, co founder and president of ArcVera Renewables, who represents the U S and as an expert on the IEC tech committee, which maintains the IEC 61400 12 1 standard for power performance testing, John also participates on the IEC.
Tech advisory group that votes on us positions regarding all standards and John has spent a long career in the wind industry. He’s worked in wind since 1990 and. Back in 2001, he founded Chinook Wind up in Washington State, and Chinook merged with VBAR Greg Poulos, in 2017 to form ArcVera Renewables that everybody knows.
John, welcome to the program.
John Bosche: Hey, thanks, Allen. Thanks, Joel. It’s good to be here with you today.
Allen Hall: So we’re trying to understand the power curve. So we talk about it all the time, but we’ve never been involved in a measurement of it. And I know when we travel around and go visit wind sites, everybody just assumes that, Oh, a power curve is this, and there’s a plot and we get it from GE or Vestas, whoever we get it from.
And here’s this magical thing. And all our lives depend on it and that the wind turbines are producing this amount of power with that amount of wind. But how is, I would like to learn, like, how is that created and how is that validated? Because those are two things I just don’t understand yet.
John Bosche: The power curve in some ways really is the most important part of the power curve.
It’s what at ArcVera, we say the arc in arc vera is connecting the meteorology part, which is what Greg does to the the power curve, which turns that meteorology into energy. And and I, not just the power curve, but the machinery in general, so the power curve really is that important bridge of, converting the wind into.
Into energy. It edits. At its heart, it’s a very simple concept. At a given wind speed, there’s a certain amount of power you expect and, at different, at the next higher wind speed, it’s a little more power and up until you hit rated power. It’s, you could say it’s equivalent to the EPA mileage when you buy a car you expect it’s going to get whatever 36 miles to the gallon or something.
And of course then your mileage may vary and there’s never a guarantee or a warranty on the mileage with the car. With wind turbines, you do get a warranty from the turbine vendor. They guarantee the power curve. But in order to enforce that guarantee, you have to actually go measure the power curve.
If you don’t measure it, then it’s just deemed that the wind turbine meets that power curve. And if you’re disappointed later down the road, five years or something. You’re just out of luck because you didn’t measure the power curve. So that’s the reason why companies often often measure, measure, spend the money to measure a power curve.
Joel Saxum: Let’s talk on this one. So now this brings to something to mind and it will show a lot of people something. And this is one I, we talked about with another expert in the field the other day and they said, XYZ turbine company makes like. 200 different variants. When we say a Vesta’s V100, everybody assumes it’s the Vesta’s V100.
However, for different wind resource locations, different blades, so this is why you see different turbines that may be the same model, but they have shorter blades, or longer blades, or different model blade and they’re rated for different wind speeds, but it’s the same nacelle type, but in a different area.
So there, you could have a a GE15, but that GE15 may have. 10 different iterations of it based on, are you in a high wind speed, are you in a low wind speed, are you in turbulent winds, are you this or that and that changes the power curve for every one of those. It would be like you said the car thing, right?
It would be like if you had a certain model of car with a different, different motor in it, or different tires on it, or different arrow on it, or something of that sort. Each one of those, will each one of those sub models have a different type of power curve? And you test against that?
John Bosche: Yes and no. For a given wind turbine model, there’s generally a power curve though there will be multiple power curves for different air densities. There also are different power curves for different operating modes, for example low noise mode, or maybe a load reduction mode.
But those are usually special cases. Generally, for a given turbine model and a given air density, there’s just one, one power curve. The one exception is GE does publish low, medium, and high turbulence power curves. And so you want to make sure you’re using the correct turbulence value in the, in selecting the power curve.
Normally, as you say, if you change the rated power or extend the blades a little bit, that usually results in a new turbine model. That has to be recertified with a new type certificate and a new power curve. For example, the GE, you mentioned the GE 1. 5, it also was available as a GE 1. 6. That was officially a different turbine model than the GE 1. 5. And then it became a GE 1. 7 and, et cetera. And so those are, those iterations are generally considered a new turbine model with some minor variation, you can maybe. have a small change in rated power without requiring a new certification.
One thing that will vary on a wind turbine is maybe the supplier of the blades. So maybe a GE turbine can have TPI blades or LM blades and those blades have different aerodynamic properties. So The turbine actually performs slightly different with those two different blades, but GE doesn’t publish they don’t publish a TPI power curve and an LM power curve, it’s just one power curve.
And that is that is a little sometimes it seems like they, there should maybe be two different power curves, but. They have to, pick a power curve that maybe goes down the middle between those two blades, or hopefully the two blades perform approximately similarly.
Allen Hall: I didn’t know that!
Okay, so that’s fascinating.
Joel Saxum: Okay, so let’s go baseline here. Let’s go I just installed a wind farm. We’ve commissioned date, it’s February 14th, Valentine’s Day 2024. I’m calling you guys to make sure that it’s correct. What is the process? How does it work?
John Bosche: The first thing you have to do is evaluate the terrain.
So if the terrain is flat, and there’s a mathematical description of flat terrain, and it’s way flatter than you would think if you have a little, gully through the site for, rain runoff, that can change it from flat terrain to not flat terrain.
And but you, so there’s a mathematical formula that’s prescribed in the IEC standard. You just evaluate the terrain. If it’s flat terrain then that’s a much simpler procedure. If it’s not flat terrain, if it’s considered complex, you have to actually start maybe six months or a year before the wind turbines ever get installed.
And you install a temporary met tower at the location where the turbine will be and a permanent met tower that’s upwind, a bit upwind of either upwind or off to the side, generally two between two to four rotor diameters away from the turbine location, and you collect data from those two towers for a period of time.
And then you can create kind of wind speed ratios between the Met Tower location and the turbine location. Then when you’ve removed the temporary tower and put the turbine in, you can adjust the wind speed from the permanent tower to reflect the wind speed conditions at the wind turbine location.
So that’s called a site calibration. Once you’ve done the site calibration, or in the case of flat terrain, you don’t have to do a site calibration. So you have this permanent met tower that’s upwind of the turbine again, two to four rotor diameters. And then you collect data from that tower simultaneously with collecting power data from the wind turbine and you’ve been the wind speed and the power data and that do some density corrections and some filtering.
And that creates the power curve. It’s a very simple process except that there are a thousand details that can, that have to be attended to carefully. So The type of anemometer you use is important. It has to be calibrated the, all of the calibration, not only all of the sensors, temperature, pressure, everything have to be calibrated.
Not only calibrated, but they have to be an IEC 17025 calibration, which you don’t always automatically get when you buy sensors. You have to ask for that specifically, and then how they’re actually mounted on the tower their requirements, how long the boom has to be. Diameter of the boom and the, distance of the anemometer from the boom.
The height, the height has to be within plus or minus 2 percent of the hub height and, then same thing with the power measurement equipment, there are requirements for calibration and accuracy of those sensors and so yeah, there’s as I say, there, it’s the reason why there are, there, there’s a standard that’s 300 pages long or whatever it is cause there are a lot of details to attend to.
Joel Saxum: Your use cases for you guys.
Okay. ArcVera gets a phone call. Is it usually always we’re looking to develop this wind farm? Yeah. Can you get involved in that, that basically pre feed stage or what is it? What is your business? What does the business look like when you get engaged from an operator?
John Bosche: Yeah, it can be a, and of course we do much more than just power curve testing.
So often our engagement starts with the wind resource assessment, which might be years before the project gets built. We might work on the independent engineering report for the project. Maybe the project changes hands somewhere along the way, we might do some due diligence. You never know where our involvement picks up.
Sometimes it picks up at the time when the power curve is done. There might be a power curve RFP that’s sent out by a developer, and we respond to that and get selected to do the power curve measurement. It’s a variety of when we get involved.
Joel Saxum: Okay, so the next question I have for you, and this is going in a different direction.
You’re a part of on, you’re on that IEC standard. That has to deal with power curve testing and power curve items in general. I’ve seen power curves used as basically investigative tools for turbine failures, for blade failures, for rotating equipment failures. Do you guys get involved in that side of things and, or have you ever had an operator come to you and say, Hey, we got 100 turbines out here’s a bunch of SCADA data, can you tell us where we can do things to optimize, which ones are not running well, which ones are, is that a thing you guys do too?
John Bosche: Sure, we do that a lot, we’ll do, we call it an operational assessment, so we look at how a wind farm is operating, and all of the, generally when we’re involved in that, it might be a, an underperforming wind farm, so we’ll look at the power curves, we look at all of the individual power curves for, All of the turbines on the site, generally using the cell anemometers looking for kind of outlier turbines, and we can calculate the weight loss for the project and, um.
See if that matches how that matches up with the Pre construction estimate for the weight loss. We can look at, project availability. We can look at electrical losses. There’s. There, there are, a dozen or so different components that may add up to that overall underperformance of the project when it comes to if there are component failures occurring we do that as well.
So that would be a root cause analysis and we we often do we definitely look at SCADA data as part of that root cause analysis, whether we would look at the power curve specifically, maybe we wouldn’t sometimes for example, a loop. A turbine overperforms its power curve.
It’s a, a three megawatt turbine, but it’s producing power up to 3. 3 megawatts or something. So that can add extra loads to the blades and, the yaw system, everything. And so that might, that could be a source of of root cause for the failure. Usually not, but it could be.
We also see that weird things like often wind turbines have wind sector management, so they have to shut down during certain wind conditions when the wind is from a certain direction and a certain wind speed, and those parameters often get entered incorrectly, or perhaps they were originally entered correctly, and then later during maintenance, they get re entered incorrectly, so now the turbine is shutting down From a wind direction that it doesn’t need to shut down, but it doesn’t shut down from the direction it does need to.
And so that first of all hurts production, but also can lead to, a lot of damage from the wake induced turbulence of the neighboring turbines.
Allen Hall: And all these power curve measurements and all the wake measurements, what are we talking about in terms of percentages here? Like, how accurate is the power curve measurement?
Is it plus or minus 1%, 5%? And where does it fit into all the discussion about lost energy?
John Bosche: Probably the 5 percent is pretty close. And it depends on several things, the terrain, how close the Met tower is to the turbine, et cetera. So that range is maybe three to 7 percent for the uncertainty on the overall power curve test.
And one thing that’s interesting most I don’t know if I’d say most, certainly many warranties are written where. The power curve guarantee is the published power curve minus the uncertainty of that test. If there’s say a 5 percent uncertainty, they’re really guaranteeing 95 percent of the power curve.
Many wind farm developers and owners are using this decide not to do a power curve test because it’s pretty unusual to see a wind turbine underperformed by more than 5%. So you might see more commonly, 1 or 2 percent underperformance that doesn’t lead to a warranty claim and they decide, because of this Because of this 5 percent allowance, it’s not worth their money and the effort to test the power curve.
On the other hand, um, sometimes they do underperform by more than 5%. And it’s usually, it’s often, developers who’ve been burned in the past with underperforming turbines that choose to spend the time and effort and money to do the power curve test. The other reason they do it is if generally it’s, it would be the tax equity investors that.
Make, make that a requirement that they have to do a power curve test.
Joel Saxum: Yeah. The financial services sector I see as being something that you could use you guys so much in that, like the due diligence phases. Okay. So let me look at it this way in a different light. If you’re a business investor and you’re going to go buy a business, if you can see that there’s a little bit of degraded performance in the business and immediately see where you could fix it.
And you got numbers on that. That’s a win. That’s a business. I would want to buy a wind farm. I would want to buy. Oh, we can squeeze a little more performance of us because we engage shark bear. They told us what was going on out here. And now if we do a little bit of corrective maintenance and get things moving.
John Bosche: Yeah, leading edge erosion is a huge issue.
It can definitely degrade, the performance by. By many percent, in, in severe cases, I don’t know more than 10 percent reduction in performance. And okay. That needs to be taken care of on a regular basis and I’d say it’s a, it’s an, generally it’s an investment that’s well worth spending to keep the production up.
Joel Saxum: John, what is your opinion, then, being a power curve expert, on some of the solutions in, out in the wild, out in the wind industry market, of erosion and telling people what their AEP performance loss is?
John Bosche: You can measure directly the power curve and determine how much, it’s been degraded from so that’s one of the benefits of doing a baseline power curve test.
When the project is new, then you can remeasure down the road to look for degradation. You can also do actually more accurate than doing that is do a side by side. Repair the leading edges on one turbine and don’t repair the leading edges on the neighboring turbine and see how much the relative difference in performance.
That’s probably the best way to, to evaluate changes, whether it’s from vortex generators, leading edge repairs any other kind of, blade upgrades. But the other thing with leading edge erosion is not only does it degrade performance, but it also degrades the structural reliability of the blade.
And eventually, if it gets bad enough, moisture can ingress into the blades and That that creates its own problems when it freezes also potentially creates lightning, lightning issues when there’s extra moisture inside of the blade. There’s, there are a lot of good just reasons for the structural health of the blades to keep the leading edges repaired.
Joel Saxum: One of the things we always talk about leading edges go bad, aerodynamic performance suffers, creates tip, creates vortices and dirty air behind it. It’s bad for lightning as well. So like leading edge erosion is something that the world definitely needs to be TA taken care of.
John Bosche: Yeah, leading edge erosion is a whole separate topic. I’d love to talk, I can talk for hours about that, but there’s even what causes leading edge erosion is really, an interesting topic of ongoing research and it’s a, it’s really a fascinating topic, actually, in the old days, when wind farms were mostly in Palm Springs and in the ultimate past.
We thought it was blowing sand that caused the leading edge erosion. Now, it turns out it’s more, it’s water droplets actually that causes it.
Allen Hall: I was just over at the leading edge erosion conference last week at and yeah, it’s this huge topic and it all revolves around power loss and what that power loss isn’t.
I know that’s one of the questions that was a big discussion point. In fact, we spent about an hour in discussion about what is the likely losses there and what kind of range are we talking about? And I think one of the problems is that we don’t go out and really measure it. And I’m not sure why that is, but it does seem like measuring the power curve or doing side by side measurements would be a really good solution to it, to quantify it because different parts of the world have different levels of erosion and different effects.
What, how long does it usually take to do that, to do the side by side or to do a power curve measurement? Was it a six month process, a year process, a two year process to really get fine enough data?
John Bosche: In that case, you’re not doing an IEC standard power curve test. You’re doing maybe more of an informal power curve test.
And you can take as long, as little, as much or little time as you want, really. I, if you have, if you do it during the, a good wind sea, high wind season, Probably a month is enough time for collecting data to really do a, if you’re doing, for example, a side by side test during the wind season a month, I would say would be long enough.
If you really want to, fill all of the wind speed bins for the IEC standard, you probably need to allow for 3, 3 months or 4 months But but for these informal tests, you don’t, you’re not required to fill all of the bins and meet all of the IEC requirements.
Allen Hall: What’s the error bars on those kind of tests?
Because I hear the side by side tests of just from power curve discussions and adding a VG or something of that sort to blades and they try to do side by side. Using SCADA data, really rough data. It doesn’t seem it’s all that accurate. If you’re looking for a percent or two, those, isn’t that sort of hard to find?
And do you need to do an IEC type of measurement to really get the resolution that you need to determine if that condition works?
John Bosche: Yeah. And something like evaluating VGs, again, you’re, the good thing is you’re not going for absolute accuracy. Let’s say the test is off by 3%. If it’s off by the same 3 percent before and after, then you don’t really care that much.
What you’re looking for is a relative change in performance after the bleed improvements are made.
Allen Hall: And there must be a lot of discussion at the IEC level about. These measurements, this is all about money at the end of the day and generating power. Is there a lot of discussion at the IEC committee at the moment?
And I know there’s a new revision issued about a year or so ago. What’s, where’s the IEC committee and what’s the next steps there?
John Bosche: The most recent substantive update of the IEC -12-1 was in 2017. The 2022 document, which is edition three. Doesn’t really change and change it in a substantive way.
It really just reorganizes the document and it has to do with all of the details of how you measure the wind historically have lived in that dash 12 dash 1 document. And so now there are many other standards dash 15, for example, needs to refer to wind measurements. Even, the acoustics measurements or loads measurements standards need to refer to how to measure the wind.
So instead of those standards, all referring to dash 12 dash one, that’s been pulled out, it’s in 50 dash one now. And it really is just pulling some of those details out. Into standalone documents.
Allen Hall: Yeah, we’re getting finer and finer on the measurements and there’s more and more measurements to make.
You mentioned acoustics and I was thinking the same thing. Acoustic seems to be a big player at the moment. We were just talking to an operator, an offshore wind farm. We had acoustic treatments offshore, which sounded weird. Like, why would the ocean care what the noise is? But. Yeah, there’s a lot of work going on at Acoustics.
Joel Saxum: The fishermen like to fish in peace.
Allen Hall: Clearly they do. And that’s part of that IEC spec though, like trying to standardize all these measurements is, must be, you guys must meet what, once or twice a year to, to go over these discussions.
John Bosche: Generally, IEC standards go through what’s called maintenance cycles in which, they’re updated, say from.
Version 1, Edition 1 to Edition 2, and those those update cycles can last anywhere from a year to sometimes 7 years it just depends how complicated it is and how extensive when a maintenance cycle is active, the group probably generally meets several times a year, maybe 3 4 times a year, and then in between, like right now on the -12-1, we haven’t been meeting regularly since 2017.
And we’re just about to embark on a new we have embarked now on a new maintenance cycle. So for the next couple of years, we’ll meet quarterly and and address kind of the, changes in the state of the art of how you would do power curve measurements.
Allen Hall: And What’s the latest in the state of the art?
John Bosche: So LIDAR was addressed in addition to, for ground mounted LIDAR. And then actually more recently, there was a dash 50 dash three standard. That addresses nacelle mounted LiDAR and I was also involved in that effort, and it’s actually, at the moment, it can only be used in flat terrain, again, as defined by this set of equations in the IEC standard, but it really, it, it does away with the need for a MET tower, and I think, and it seems to be quite accurate, so it’s I think it’s It’s an exciting new advancement for our industry.
Allen Hall: Yeah, we’ve seen a lot more action on the Nacelle metal lidars. And just curious where the direction was there, because it does seem like an advancement and just haven’t seen it implemented all that much.
John Bosche: An interesting thing that we’ve seen on a bunch of different power curves we’ve done at different sites and different turbine models is that despite the fact that, following the IEC standard, we adjust for air density and even can adjust for Wind shear and turbulence.
Even with those adjustments, we’ll see sometimes a very big difference in the power curve from summer to winter, sometimes 5 or 10 percent from summertime to winter time. And so it’s something for, project owners and developers to be aware of is. Actually, when you measure the curve, power curve matters as much, if not more than, the details of the measurement.
If you measure if you measure in the summer, you’re going to get a worse looking power curve. If you measure in the winter, you’re going to get a good looking power curve. There can be sometimes a game played, between the turbine vendor and the and the project owner as to when you start the test.
Joel Saxum: Yeah, it makes sense to me based on the flexibility of the blades. You’re losing power when blades flex.
Allen Hall: And the air is denser, right?
John Bosche: That’s right. The density, yeah, I hadn’t thought about the stiffness aspect. That could be a good area to investigate. My best theory is that in the summer when the air density is lower, that affects the Reynolds number of the wind flow over the blades.
And lower Reynolds number brings you closer to a stall condition. Blades often are operating near or even in stall near the root of the blade. And so it’s just a question of how much of the blade root is in a stall condition. And maybe in the summer, there’s a little bit more of the blade that’s in a stalled condition and affects the performance.
That’s my best theory.
Allen Hall: Yeah. It’s something as an operator, you wouldn’t think about all that much, but you’re right, John. That’s totally part of the power curve is right temperature, density, and as Joel pointed out, things about the turbine itself, right? We’ll make a difference in the power curve.
So it does matter. And I know there’s a lot of discussion in the industry about trying to maximize power curve and get the energy up and do all those great things. And this is why people need to call ArcVera right? They need to get ahold of you to ask these questions, to get some answers, need an expert.
John Bosche: But importantly, if the power curve is measured for sort of these winter ideal conditions, and you measure the power curve in the winter, you think everything’s fine, but half of the year, it’s the turbine could be significantly underperforming. If you didn’t account for that in the pre construction energy estimate.
Then then you can get significant underperformance just because of this seasonal variation in the power curve. And so it’s worth thinking about. And and for us, for we consultants who do the pre construction energy estimates it’s something for us to consider in our calculations.
Allen Hall: Yeah, absolutely. So how do people find out about ArcVera? How do they get ahold of you, John? Because you’re a wealth of knowledge here. Where do they go?
John Bosche: Well, arcvera.com is our website. It has lots of information and bios and white papers. And we publish monthly anomaly maps for for how, whether the wind is higher than average or lower than average for the, all of the U S and Brazil, South Africa, and India, which are other countries that we operate in.
A lot of our clients find those to be quite interesting. And if anyone wants to reach out to me, my email addresses. john.bosche@arcvera.com.
Allen Hall: John, it’s been great to have you on the program, and we need to have you back. Thanks, guys.
John Bosche: It’s been a pleasure.
Allen Hall: We’ll see you at some of the conferences coming up.
John Bosche: I’m looking forward to it.
https://weatherguardwind.com/inside-power-curve-testing-arcvera-renewables/
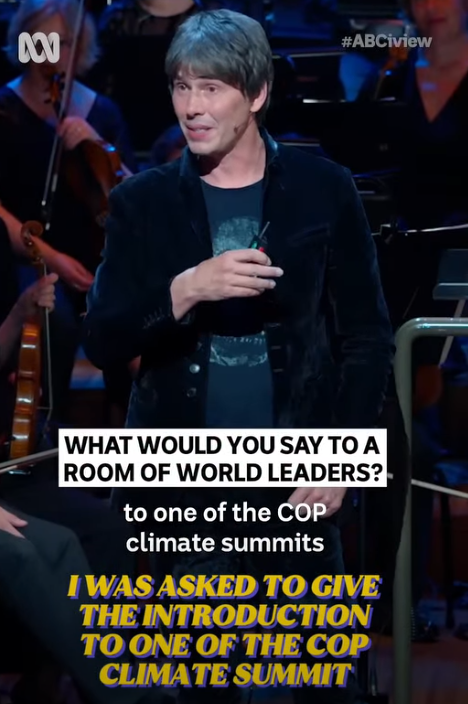 Dr. Brian Cox has risen to the status of what I would call an “astrophysics badass” in a matter of just a few short years. Anywhere you go on social media, there’s Cox making you think the most profound thoughts imaginable.
I won’t give anything away, but I caution you to fasten your seatbelt.
Professor Brian Cox on Our Obligation to Deal with Climate Change
Weather Guard Lightning Tech
Gulf Wind Scales Uptower Repairs, Sheds Storm Loads
David King from Gulf Wind Technology returns to discuss serial uptower blade repairs, passive load shedding, and data-driven testing.
Sign up now for Uptime Tech News, our weekly newsletter on all things wind technology. This episode is sponsored by Weather Guard Lightning Tech. Learn more about Weather Guard’s StrikeTape Wind Turbine LPS retrofit. Follow the show on YouTube, Linkedin and visit Weather Guard on the web. And subscribe to Rosemary’s “Engineering with Rosie” YouTube channel here. Have a question we can answer on the show? Email us!
Welcome to Uptime Spotlight, shining light on wind energy’s brightest innovators. This is the progress powering tomorrow
Allen Hall : David, welcome back to the program.
David King: Yeah, I’m so glad to be here. A lot’s happened since the last time I was on, so, uh, this is gonna be great.
Allen Hall : It’s been about a year. Mm-hmm. And last year we were at OM&S in Nashville, and you were talking about root fusion, and this is the insert fix uptower for the blade inserts, right?
So we’re having a lot of blade bolt issues, and the inserts are starting to pull out or become loose, and the blades are moving around. A lot of our operators in the States are trying to solve that problem, and they don’t wanna remove the blades and bring anything down tower. They would like to fix it uptower.
That’s where your solution came in. How’s that going?
David King: Yeah, so I mean, it, it’s really been a five-year journey for us. I mean, we’ve been doing this- I remember that, yeah … for a [00:01:00] very long time. You know, it started like any process does, with a problem statement. Sure. And we’ve been working through from problem statement, you know, going through process development, going through structural development, going through pilots.
Uh, we did a, a huge pilot deployments about three years ago, where those were being monitored. Um, we’re now in a position where we’re in serial deployment, and that’s what’s really exciting. You know, we’re doing about 200 blades a year, uh, of, of serial deployment. We’ve, we’ve done that now, uh, we’re going into our second year of that.
Nice. So we’re extremely excited by that. That comes with its own sets of challenges as you scale up. How do you maintain quality? We even touched a little bit on a few of these things last year. Um, but yeah, we’re really excited to be doing that. Uh, we’re trying to keep it, you know, again, process-driven.
How do you simplify a process that allows you to scale up appropriately, train people appropriately? A- a- and that’s what we’re really excited about this year, is being able to bring this, uh, so that we’re not, um, you know, basically supply constrained, ’cause there is a lot of demand for this, and still able to maintain a very high level of, of quality as we, [00:02:00] we scale up.
Allen Hall : Yeah, and that’s the key to all sort of repairs in the wind industry. You like to do it once and be done with the life of the turbine. Now, so you’re going uptower. You’re drilling some holes up along the blade, injecting those with a resin system, curing it, basically reinforcing what is already there That all makes sense to me.
Engineering-wise, that makes sense to me. But a- again, it goes back to the technicians and the training and the deployment of it. Are you starting to train technicians, bring them in, show them how to use the, use the machines and, and get them out in the field so they are ready to go? It, it… ‘Cause it seems like you’re at that threshold now.
David King: No, absolutely. So we, we believe in people first, right? Yeah. People at the end of the day make things happen. And so, you know, the best ways to do that is give people the right tools to be successful, and where that comes from is training. That’s a huge part of it. We have a, a certified training program that we run.
Uh, it started out as an internal program we were running. It basically has five levels to it. Uh, we’ve now extended that to, uh, enabling, uh, you know, basically [00:03:00] preferred partners to be able to take part in that training, uh, to be able to utilize modular kits, pumps and equipment, to be able to, you know, go out and meet that demand that’s out there, but do so in a way that’s, uh, controlled.
Yeah. And so really that comes back to that certified training program. And really, you know, level one is about a lot of your basic safety, procedural base type, uh, you know, making sure people are competent, uh, they’re not gonna get themselves hurt. Right. They’ve got the right personality traits about focus, uh, you know, detail focus and things like that.
Yeah. Uh, level two to that program is, is really about, um, basically getting people to a stage in which they can be a, uh, team member. Uh, they’re able to be on a team and contribute to that team in an effective manner, be in the field.
Allen Hall : That’s really important. A lot of-
David King: Absolutely …
Allen Hall : companies miss that aspect of being a team member instead of an individual.
Yeah, you have to work with other people. Yeah. It’s, it’s critical.
David King: It’s massively important. Personalities clash. You’ve got to be able to work through that sort of thing. And so that level one to level two is really kind of taking your green horn hat off and putting, “Okay, I, I, I can be on this team and I’m, I’m a, a contributing [00:04:00] member.”
And then at level three, that’s your team leads. Those are people that are leading teams. They’re leaders. They’re up and coming. They’ve got a career path, career trajectory. Level four is our mentors. That’s the people that are going out there and that are basically qualified to now actually mentor other people in the field.
Allen Hall : Yeah.
David King: And then your level five is train the trainer. How do you grow more trainers so that you’re not constrained on that training factor? And that, that’s kind of how we, we typically run training.
Allen Hall : Uh, and Gulf Wind has the ability to do that. I mean, I’ve been to your facilities, they’re impressive, and that’s one of the limitations for a lot of companies.
They don’t have the facilities to train people, and they don’t have the resources you do. That opens up a lot of opportunities. Obviously, you’re in the composite repair business. You have crews out fixing wind turbine blades. Some of the more complex ones is what I hear. I mean, I hear it secondarily, but I assume that’s what’s happening.
What are, are the areas that you get called in on to do composite repairs?
David King: We, we really do anything that stops somebody else. Okay. So we wanna be there when there’s a problem where you’re like, “I don’t know where to go next. Uh, this is a big [00:05:00] problem. We’re unsure. Maybe there’s a new technology at play.
Maybe it’s, uh, a carbon spar cap. Maybe it’s something, uh…” You know, obviously the root stuff that’s very complicated. Sure. And, uh, it’s just gonna require a little bit more engineering. It’s gonna require a little bit more rigor, and that- that’s where we say, look, we, we can, whether it means testing something, verifying something, training somebody on a process, developing a process- Yeah
or just doing something complicated, that’s where we excel.
Allen Hall : Well, that- that’s what I hear from the road is, uh, Gulf Winds here and I think, “Uh-oh. You must have a really serious problem because you’re calling in the experts to do the, the difficult things.” Carbon pultrusions, carbon fabric in, in blades today is such a massive problem because it’s not, it’s not fiberglass.
It’s just a lot more to deal with, and some of the loading issues we’re finding and, boy, it’s just all over the place. They need Gulf Winds Technology to, to come on site to give them a hand. Now, a- as part of the growth of the business, and you guys have been growing. Every year I, I see they’re just… it’s just a little bit bigger, a little more [00:06:00] people.
I walked on LinkedIn and hiring some engineers and some people to work over the summertime. That’s all great. What’s the structure look like now? How are you trying to organize yourself as a business?
David King: Yeah, so we really break down into three different structures. We have our service division, and that’s, um, putting people out there to solve problems in the field.
As simple as it gets, right? It’s like you’ve got a problem, we’ve got the right people with the right solutions, and they’re gonna go deliver, uh, a result. Um, and then we’ve got an engineering division. That’s about developing problems. It also has a lot to do with IP. You know, things like root fusion, that’s a pat- protected technology.
Sure. All of our technology, we do a lot of investments in, in, you know, patent protection and IP work, and so that sits inside that engineering division. Uh, it’s how we, we have the smarts of the company kinda sat in there. Uh, it also is what allows us to really get into some of these, uh, kinda juicy problem statements that are a little bit prickly maybe.
Uh, and we love getting into those and solving them. Yeah. And then the third and final thing is the composite side of things, and that’s the, the manufacturing. That’s that 30,000 square [00:07:00] foot composite manufacturing facility where we wanna be the best in vacuum infusion. We wanna be the best in prepreg, the best in pultrusions, complex assemblies, and be trying to de- uh, just deliver really high-quality composites to the industry.
Allen Hall : Yeah, and you have the equipment to do a lot of testing. And I think a, a lot of operators don’t realize what you have And the knowledge that’s sitting there, when I run into operators across the country that have complicated issues, particularly if they have carbon, I mean, oh my gosh, you, you need to be calling experts here.
And if they have issues they haven’t really sussed out, they don’t know, they don’t understand the engineering that went into that blade, they need to be talking to you guys about Why is this blade designed the way it is? How should I approach this? Do I need to be turning my turbines off until I figure out a solution?
A lot of times there’s not a lot of resources there because the, the designs are more complex than ever. But on the, on the same hand, I would say they’re not doing a lot of testing of their own materials. [00:08:00]
David King: Yeah, and there’s a huge space for that. And which is crazy. Absolutely. Yeah. It’s, it’s, uh, it’s definitely a gap.
It is. And we see it as a gap that needs to be filled. Yes. And so that’s where, you know, we, we say you’ve gotta give the engineers the tools to be successful. Sure. And so what are those tools? You know, that could be anything from what does an aerodynamicist need? They might need a metrology scanner. Right.
So we do 70 million plus point scans of full blades. We’ve done now a full blade scan and, uh, I think we did it in about an hour, which was a, a new record of how quickly you could get 70 million points on a blade. Wow. And then that allowed- Uptower
Allen Hall : or
David King: downtower? It was downtower. Okay. Okay. It was outside in the field, but it was downtower.
Okay. It’s still impressive. So that was a little, little, little bit easier than uptower. Sure. Maybe that’s next. Um- Yeah. But, um, no, and then so what can you do with that? Well, then you can go, uh, really analyze, you know, the performance of that blade. Maybe you can go do something in a wind tunnel with it.
So coming back to that toolkit- Yep … an aerodynamicist needs a wind tunnel. We have aerodynamicists, so we have a wind tunnel. Then going on to, like, a structural engineer. What does a structural engineer need? Well, they need their FE tools. They need some good first principle approaches to, to structures.
But they also need test equipment. Right. They need to be [00:09:00] able to develop and characterize materials both in static and fatigue. And so we’ve made a lot of investment in those sort of test equipment, uh, so that we can, we can put numbers to things. You know, I think the wind industry needs more data. Less speculation and more data-driven decisions, and the, where that starts is really building up that test base.
And we, we believe in this thing called the testing pyramid, and what it is is, like, you’ve gotta characterize the material. That’s where you’re gonna have thousands of samples. Right. That’s your tensile, double lap shear testing, all the basics. Then you do your subcomponents. Add some geometry into that, that- Add some shape.
Exactly. Maybe that’s hundreds of samples. And then you’re gonna go on top of that to, like, your full component. And look, we don’t have a blade test stand yet, but- Right … that’s kind of that, that space. And then the final top of that pyramid is go do it in the field, get results- Run it … and then run that back into your design cycles.
And I think the more we can do that as an industry, the more successful we’re gonna be as an industry.
Allen Hall : Yeah, and I think a lot of operators don’t think they have to participate in that, and they’re sadly mistaken. And the fact that the industry has grown as fast as it has means [00:10:00] there’s some holes in some of the engineering that maybe they didn’t consider the, the site assessment properly or they didn’t understand some of the manufacturing variability.
Now you own this product, you’re gonna have to do some of the homework that maybe the OEM should have done. It’s your site. You own it. And a lot of times I think, uh, as an owner/operator, they don’t realize there’s resources. Like, okay, well maybe do some mechanical testing. Maybe the repairs I had last summer aren’t working out the way that I think.
Maybe I need to look at some materials
David King: and see if- And we want you to own your data. Well, that’s exactly it, right? That’s really what it comes down to is like you wanna own the data, know your blades, know your products, whether it’s, you know… I know you’re very, uh, you know, uh, specialized in lighting, really know your stuff.
Everybody’s gotta take that same approach. Know your stuff- You need to know it … or go find the experts that know it- Right … and work with them. Yeah.
Allen Hall : Well, at, at this point in the industry’s growth, you realize who’s all percolated towards the top, right? You, you, you see the companies like Goldwind that have the expertise in-house and, and have established themselves as a [00:11:00] knowledge center, as a resource for the US and globally, and there’s only a couple of those spread around the world in that- We as an industry need to be utilizing you more to help us solve problems.
Because if I don’t tell Gulf Wind what’s going on, Gulf Wind can’t help come to a solution.
David King: And we find that really, like, just the more you know, you start finding all sorts of new opportunities. Yeah. ‘Cause we almost learn what you don’t know, in a way. You kind of realize that, like, there’s so much more out there.
Yeah. And that’s where it gets really exciting. That’s where it’s like you can get these novel solutions, people who take creative approaches. Um, and, and I really think that’s what’s gonna take this industry forward, especially now when, you know, there are some headwinds for wind. And all that means is we’ve gotta get sharper, and we’ve gotta be, uh, more agile.
And I think it’s actually almost times like this that create some of the best, uh, behaviors in an industry to, uh, take it forward into the future really.
Allen Hall : Yeah. Wind’s not gonna go anywhere, but it’s being stressed a little bit. And in those stress points, we need to take the time to reflect and to make the industry [00:12:00] stronger.
But in order to do that, we need to be relying upon the sources that we have. There are global sources. There are so many resources to touch into. I think you guys are, are doing amazing things. Obviously, being down in your facility, seeing the wind tunnel, just blown away by that. Seeing the mechanical testing, seeing the, the 3D printing of air foils and all that work you’re doing, plus the ability to scan blades, do large scale studies.
I remember one was on CMS at the time, thinking, “All right. Somebody’s, somebody’s actually doing the right thing. There’s a study happening so we can understand what’s happening in CMS.” Like, those things need to happen as an industry to grow.
David King: Oh, absolutely. And I know you and I were at WOMA- Yes … quite recently.
Yeah. And we heard about that LEP study. Yes. And what a prime example- … of people going out there, getting real life data. Yes. And then, uh, making it accessible so that people can make smart decisions, and again, drive the cost of energy down and make wind successful. It’s, it’s amazing.
Allen Hall : It, uh- Yeah. Yeah, yeah.
But the transfer of knowledge is the key, right? And you guys are involved [00:13:00] in looking at some, what LEP will do to improve a blade, but also what leading edge damage will do to erode performance. Those are some of the things that a lot of operators don’t understand. Like, is that blade being in that damaged form even affecting my AEP?
It depends on the turbine, I think, a lot of times. But you better be asking the question at least. Talk to somebody who knows.
David King: Yeah. ‘Cause it, it’s really interesting. I mean, you know, I think it so much drives back to that business case for the operator, and they all have their own approaches. And, and really- Yeah
you know, most people are repairing LEP when it becomes structural. That’s the- That’s right … that’s the predominant approach. And, you know, I understand that approach very… You know, I, I get it from an operator’s point of view. Um, but yeah, there’s definitely, uh, other things you could do to try and make a, a data-based business decision.
Um- Sure.
Allen Hall : Sure. Now, what are some of the cool new things that Gulf Wind is working on, that you haven’t announced to the world yet, but you’d like to announce? I know you’ve been working on things. I’ve seen all the white papers being published. There’s some things- Back behind the scenes, what’s new?
David King: Yeah. I mean, so, you know, you take something like Roof [00:14:00] Fusion, right?
Right. Which is a long process to develop. So we, knowing that everything that, uh, you have as an idea is gonna take almost maybe three, four, five years to actually bring to market- Sure … we’re always starting on this constant cycle of development. Right. And so the things- You know
Allen Hall : it’s gonna be five years.
David King: Exactly. Yeah. And so, you know, I mean, it’s like the patents on this stuff take three, four, five years to work out. Yeah. And so it- it’s a very important part of the entire process. Yeah. But to, to answer your question, we do have some exciting things both in the aero side, uh, side of the world. Uh, we have been doing a lot of development work around, uh, basically, uh, passive load shedding, so the ability for a turbine, or actually any structure, to be able to react to the wind in a passive manner.
Uh, so you don’t need any sort of mechanicals. You don’t need anything, uh, that’s going to break in the field, and the structure itself is able to actually react to the load that’s coming onto it and change its aerodynamic, uh, profile and change its load that it’s experiencing. So you get these… Uh, that’s a very interesting new technology.
Yes. Uh, it’s something that we’ve been working on for about three or four years now. It’s now, uh, [00:15:00] getting demonstrated, uh, which we’re very excited about. Uh, we also have some technologies, uh, around new connection types between metal and composites. So this is, uh, something that’s, uh, probably got a lot of, um, application in aerospace, but I think it’s also gonna find its way into wind.
And this is just a new way of really trying to fix some of the problematic joints that we’ve been dealing with now for the last few years, but looking forward, not looking backward. Yeah. Right. Sure. Not being retroactive. Right. But how do we do that next generation of roof pushing design, for example? And we’ve got a really exciting method for that, that, uh, is been tested now.
We have test results for it, and they look extremely good. Uh, we also are making some major CapEx investments this year into- Sure … new manufacturing equipment. So we have, um, some… I, I would say some, some pretty advanced, um, automation we’re trying to bring to composite manufacturing- Okay … around pre-preg carbon fibers and things like that, which is gonna be very, very exciting I think.
Uh, I hope it finds its way into the wind industry. It’ll probably start in other industries. Sure. Maybe kind of this, uh, [00:16:00] subsea, you know, and, uh, and air, uh, space first- Sure … you know, around UAVs, ROVs- Sure … that sort of thing. But I think it’s also gonna have applications in wind, and we’re really, really excited about that.
Well,
Allen Hall : that’s good because it, it does seem like wind is downstream of a lot of aerospace things ’cause it does, definitely costs money to develop those, and aerospace is a place where that can happen. However- If you work out all the kinks and you solve all the manufacturing issues, it is directly applicable to wind.
David King: And it’s massive volume. The beautiful thing about wind is that the volume, when you get something right and you do it right, you get to deploy technology. Yeah. Yes. You, you get to take it off the shelf- Right … and put it in the world and make it happen, which is, there’s nothing more exciting as an engineer.
Allen Hall : Well, I mean, in, in terms of blade manufacturing, how many times have we talked about automating that so we have less things like wrinkles and some ply issues, overlaps, those kind of things where automation would help, but we just haven’t really refined it enough to i- implement it at a large scale in a blade factory.
David King: Exactly. And it’s always usually too bespoke, you know? It is. It’s like you solve the problem for the, the 40-meter blade, and now- Right … there’s a [00:17:00] 45-meter blade, and we need all new CapEx. Right. And then it doesn’t, uh, doesn’t scale well.
Allen Hall : That doesn’t scale at all. No. Right. So that’s why they haven’t done it, is because they know the next generation of blade is coming.
It’s another 10 meters longer, and that’s not gonna fit in this building, and doesn’t make sense- We’re in trouble … to buy the equipment.
David King: Yeah, exactly.
Allen Hall : Right. So it, it, it’s a- Yeah … it’s a constant evolving industry. Now, I, I had looked at your load shedding patent application or patent. Maybe it came out as a patent.
David King: Yep.
Allen Hall : Mm-hmm. Okay. I wanna understand that a little bit since I’m here talking to you now. The load shedding piece was because, uh, you’re in Louisiana, that’s where hurricanes- Come up … every once in a while, if people haven’t read the papers. But the load shedding technology makes sense because now you can deploy wind turbines in places that you otherwise may not do it because of the risk of typhoons, hurricanes, even tornadoes on some level, some odd wind situations.
You wanna explain what that technology is? Yeah.
David King: Really what it’s doing is it’s trying to decouple the, uh, turbine’s ability to protect itself from its requirement to maintain power and maintain [00:18:00] control. So if you have something that relies on electrical hydraulics or anything like that- Yeah … it’s gonna be extremely susceptible to failing, uh, when- Yes
there’s a grid outage or when you have a battery that fails or, you know, most airplanes require, like, dual redundancy or triple- Triple … triple redundancy because of that very reason, and we just can’t afford to do that in wind. No. And so the innovation then that gets required is you have to have something that’s passive, something where the structure itself has been designed in a way where the laminate is designed in a way where it’s going to not react progressively like a linear fashion as you apply load, right?
It keeps bending and bending and bending. Right, right, right. But it’s gonna have quite a sudden reaction to a very particular load case. And so that’s what we’ve been able to do is-
Allen Hall : Okay …
David King: basically construct that laminate in a way where when it, the right load is applied, in this case, that’s the, the hurricane load or the extreme load- Right
we can shed that load, uh, completely by the structure simply reacting to the load, and that’s very exciting for wind. It has a lot of other applications ’cause- Sure it does … basically allowing you to hinge composites. We now can- Right … with [00:19:00] composites almost in an origami fashion, hinge them any way we want, which is really, really exciting.
Nice. And we’re excited to bring that now to other areas besides just wind and, and wind will be a key one as well.
Allen Hall : Sure it will. Yeah. Wow, okay. That’s cool. I mean, that’s why I follow Gulf Wind Technology on LinkedIn to see all the cool things that are coming out because, uh, if, if you’re thinking about- What’s new, what’s next.
There’s probably three or four places, honestly, in the world that I rely upon, DTE being one, Fraunhofer being another, and then Gulf Wind Technology. Like, okay, let’s… So they tram for it here. I… Let’s, let’s see what’s going on this week. That’s amazing. And I, I know that as you guys get more experience out in the field and people will start to recognize the name, it’s just only gonna grow to something even bigger.
So that, that’s fantastic. I know you, you spend a lot of time making
David King: this business go. We’re de- definitely very excited about it. Yeah. But with, with growth comes, you know, a, a discipline. Right. You have to be very disciplined. Yes. And so that’s something, you know, we’ve gotta be very focused on. Yeah. That’s where things like that certified training program are important.
Yes. It’s where [00:20:00] how we patent things is very important. Yes. How we, uh, you know, kind of set up company structure is very important. So I know we touched on a few of those subjects today. Yeah. But those are really just about trying to be able to maintain quality as we grow. A- and that’s really important to our customers, it’s important to us, and it’s how we maintain the brand.
Allen Hall : We gotta get back down to Louisiana. I’m really curious to see what’s happening inside the buildings and see where you’re at, because, uh, I know there’s great things happening there. And I really appreciate the time. Thank you for coming over to Australia. I thought your, your talks and your, your presentation and being on panels in Australia was really insightful to a lot of Australians, because you’re just bringing a different viewpoint into that marketplace.
And, and that’s what Gulf Wind does. So I, I appreciate all that effort. And, uh, yeah, we should connect up this summer. Come down and check out what’s going on.
David King: Absolutely. If you’re willing to brave the heat- Oh, no. … you are always welcome. And our aim is that every time you come to that factory, hopefully it’s like a, a whole new world.
We wanna surprise you with something new, because, uh, that’s the only way we can demonstrate progress.
Allen Hall : Oh, that’s a deal.
David King: So.
Allen Hall : Okay, great. Well, thank you,
David King: Dave. Great to see [00:21:00] you. Thanks
Allen Hall : for being on the
David King: podcast. Thank you very much.
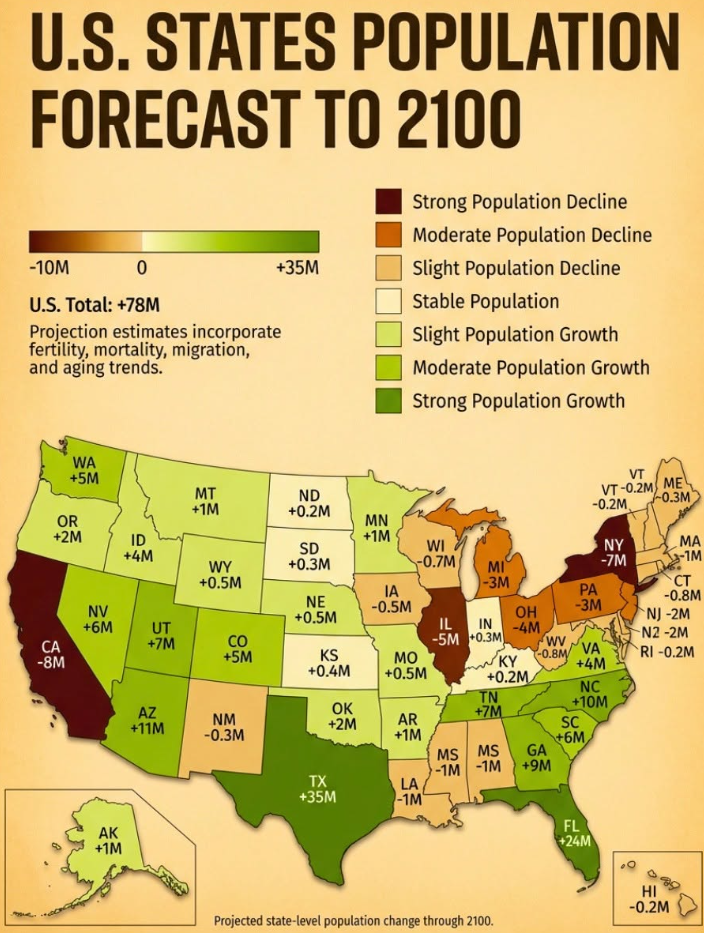 Of course, there is no science or math behind the map here. But it fits the narrative that people are fleeing California because of its (you name it) environmental regulation, high taxes, woke ideologies, etc.
Why would anyone want to live in a state that, if it were a nation on its own, would be the fourth largest economy on Earth? Leads the planet in innovation? Where someone can ski and surf in the same day?
Better get yer ass down to Texas, the oil-drillin’ and death penalty capital of the world.


-
Climate Change10 months ago
Guest post: Why China is still building new coal – and when it might stop
-
Greenhouse Gases10 months ago
Guest post: Why China is still building new coal – and when it might stop
-

 Greenhouse Gases2 years ago
嘉宾来稿:满足中国增长的用电需求 光伏加储能“比新建煤电更实惠”
-

 Climate Change2 years ago
嘉宾来稿:满足中国增长的用电需求 光伏加储能“比新建煤电更实惠”
-
Climate Change2 years ago
Bill Discounting Climate Change in Florida’s Energy Policy Awaits DeSantis’ Approval
-

 Renewable Energy8 months ago
Sending Progressive Philanthropist George Soros to Prison?
-

 Carbon Footprint2 years ago
US SEC’s Climate Disclosure Rules Spur Renewed Interest in Carbon Credits
-
Greenhouse Gases11 months ago
嘉宾来稿:探究火山喷发如何影响气候预测