
Verra has used nearly a million “hot air” carbon credits to compensate for bogus offsets generated by rice-paddy projects backed by energy giant Shell in China, Climate Home News can reveal.
In a case described as “shocking” and “deeply alarming” by experts, the leading carbon registry replaced 960,000 credits issued for rice-field methane reduction activities that had been found to overstate emissions cuts with an equivalent number of junk credits from other failed Chinese rice projects, its records show.
“It’s frankly unbelievable that Verra considers it appropriate to compensate for hot air credits with other hot air credits,” said Jonathan Crook, policy lead at Carbon Market Watch. “To pretend this is a satisfactory resolution is both absurd and deeply alarming.”
Shell’s links to bogus offsets
Shell is linked to both sets of projects, which Verra ruled as no longer valid in August 2024 after detecting “unprecedented” failures in their implementation. Last year, an investigation by Climate Home News and Dialogue Earth cast serious doubt on whether any emissions-cutting activities were carried out on the ground at all.
In response to those findings, a Shell spokesperson said “the projects in question are not managed or operated by Shell”. But the oil and gas major was closely involved in 10 rice-farming programmes in China as their “authorised representative” and, as Climate Home News reported last year, partly relied on their worthless carbon offsets to market “carbon-neutral” liquefied natural gas (LNG).
Regulatory filings in the US show that Shell, acting as a broker, last year offered to potential buyers the same carbon credits that have now been used as partial compensation for the 10 projects.
-
Zimbabwe forest carbon megaproject generated millions of junk credits
Verra is seeking compensation for offsets issued “in excess” by the controversial Kariba REDD+ scheme. But the registry’s track record in obtaining remedies raises concerns -
EU’s new climate target lines up multibillion-dollar boost for carbon markets
Analysts estimate the EU will buy at least 50 billion euros worth of carbon credits in the 2030s to help meet its emissions-cutting goals, giving a huge boost to the market in offsets


For more than a year, Verra failed to replace nearly 2 million worthless credits issued by the 10 projects, after the Chinese developers stopped responding to the registry’s communications with them. Shell abandoned the programmes shortly after Verra ordered that the credits should be compensated.
The credits were primarily used by Shell to offset real greenhouse gas emissions created by its vast fossil fuel operations. Other users of the phantom rice-farming offsets include Chinese state-owned fossil fuel firm PetroChina, Singapore-based DBS Bank and UK energy supplier OVO Energy.
In early October this year, updates to Verra’s registry showed that 960,000 excess credits across the 10 projects had been replaced with an equivalent number of credits drawn from four separate rice-cultivation programmes that were also axed at the same time.
Those original credits had not been voided and technically remained available to the account holder, even though Verra scrapped the underlying programmes and unsuccessfully pursued their representatives for redress. The Chinese company behind the four projects failed to respond to Verra’s requests, leaving it unclear whether the credits will ever be replaced.
Verra’s rules in the spotlight
A Verra spokesperson told Climate Home News that the account holder, “which requested to remain anonymous”, asked the registry to cancel those credits and, subsequently, Verra decided to count them towards the compensation process for the other 10 sham projects.
While Climate Home News could not verify the identity of the account holder in question, Shell declared in public filings that, in 2024, it had marketed those 960,000 credits to potential buyers.
Verra said its rules allow any active credits to be used to cover excess issuance elsewhere, even if those credits themselves need to be replaced. Commenting on this specific case involving the sham rice-farming projects, the spokesperson added: “While the source projects have been rejected and must address their own over-issuance, the credits used here were valid at the time of cancellation.”
Grayson Badgley, a research scientist at climate solutions non-profit CarbonPlan, said this sort of logic might allow Verra to balance its credit ledger but does nothing to help the planet’s atmosphere. “This isn’t just about following the rules – it’s about making sure that the carbon market supports meaningful climate action,” he added.
Compensation orders piling up
Carbon market experts told Climate Home News the case raises serious questions about Verra’s ability to safeguard the integrity of its carbon credits at a critical time when a rapidly growing number of bogus offsets require compensation.
Over 10 million worthless credits produced by the discredited Kariba forest protection megaproject in Zimbabwe, and already used by corporations to back up their green claims, need to be replaced after Verra found the threat to the forest had been exaggerated in the project’s original forecast.
Zimbabwe forest carbon megaproject generated millions of junk credits
In a separate development, Verra is now also seeking the compensation of around 4.5 million credits issued by four vast tree-planting schemes in China. The registry axed the projects last Friday after a year-long review failed to confirm they had been approved by government authorities – a key requirement – and that official documentation had not been falsified.
Shell tied to failed tree-planting schemes
While a Chinese company was in charge of the projects’ implementation, official documents show that, for years, Shell had been directly involved as an “authorised representative”. This role, which the energy giant also held in the rice paddy schemes, gave the firm all the “applicable rights and responsibilities” in relation to the activities.
Shell exited all four tree-planting projects in December 2024, a month after Verra informed the firm it would start the investigation that ultimately led to their cancellation last week.


“We purchase and retire a range of Verra-certified credits and were disappointed to learn of the issues Verra identified with these projects and are looking at Verra to replace any credits that were issued under these projects,” a Shell spokesperson told Climate Home News.
For Carbon Market Watch’s Crook, Verra’s unwillingness to deal with “huge loopholes” is not only deeply troubling but also counterproductive as it undermines trust in the registry, while leaving it exposed to future misconduct by unscrupulous actors.
“Rather than take real accountability for this scandal, Verra seems intent on propping up a collapsing house of cards,” he added, referring to the compensation of rice-farming credits.
The post “House of cards”: Verra used junk carbon credits to fix Shell’s offsetting scandal appeared first on Climate Home News.
“House of cards”: Verra used junk carbon credits to fix Shell’s offsetting scandal
SYDNEY, Monday 27 July 2026 — In response to an announcement that Woodside’s Browse to North West Shelf (Browse) Project was declared a State Significant Project by the WA Government, the following comments can be attributed to Senior Campaigner at Greenpeace Australia Pacific, Hannah Schuch:
“The WA Government must not ignore the significant risks clearly associated with Woodside’s plans to drill for gas at the pristine Scott Reef — to endangered marine life, our oceans, and our climate — all of which are valued and relied upon by Western Australians.
“The WA Environmental Protection Authority has already found Woodside’s plans to drill at Scott Reef would have unacceptable impacts on the environment without considering the climate impacts of 1.6 billion tonnes of carbon pollution associated with this disastrous proposal.
“Woodside’s gas drilling plans, including seismic blasting and carbon dumping in the heart of a precious ecosystem, pose potentially fatal risks to pygmy blue whales and genetically unique green sea turtles, and could cause a catastrophic oil spill.
“If the WA and federal governments are concerned with the prosperity of WA, they must reject Woodside’s nature and climate-wrecking proposal to drill for gas at Scott Reef.”
—ENDS—
High res images and footage of Scott Reef can be found here.
For more information or to arrange an interview, please contact Emma Sangalli on 0431 513 465 or emma.sangalli@greenpeace.org
Cook Government must recognise risks posed by Woodside’s Scott Reef drilling plans
This summer has seen Europe suffer through a series of record-breaking heatwaves.
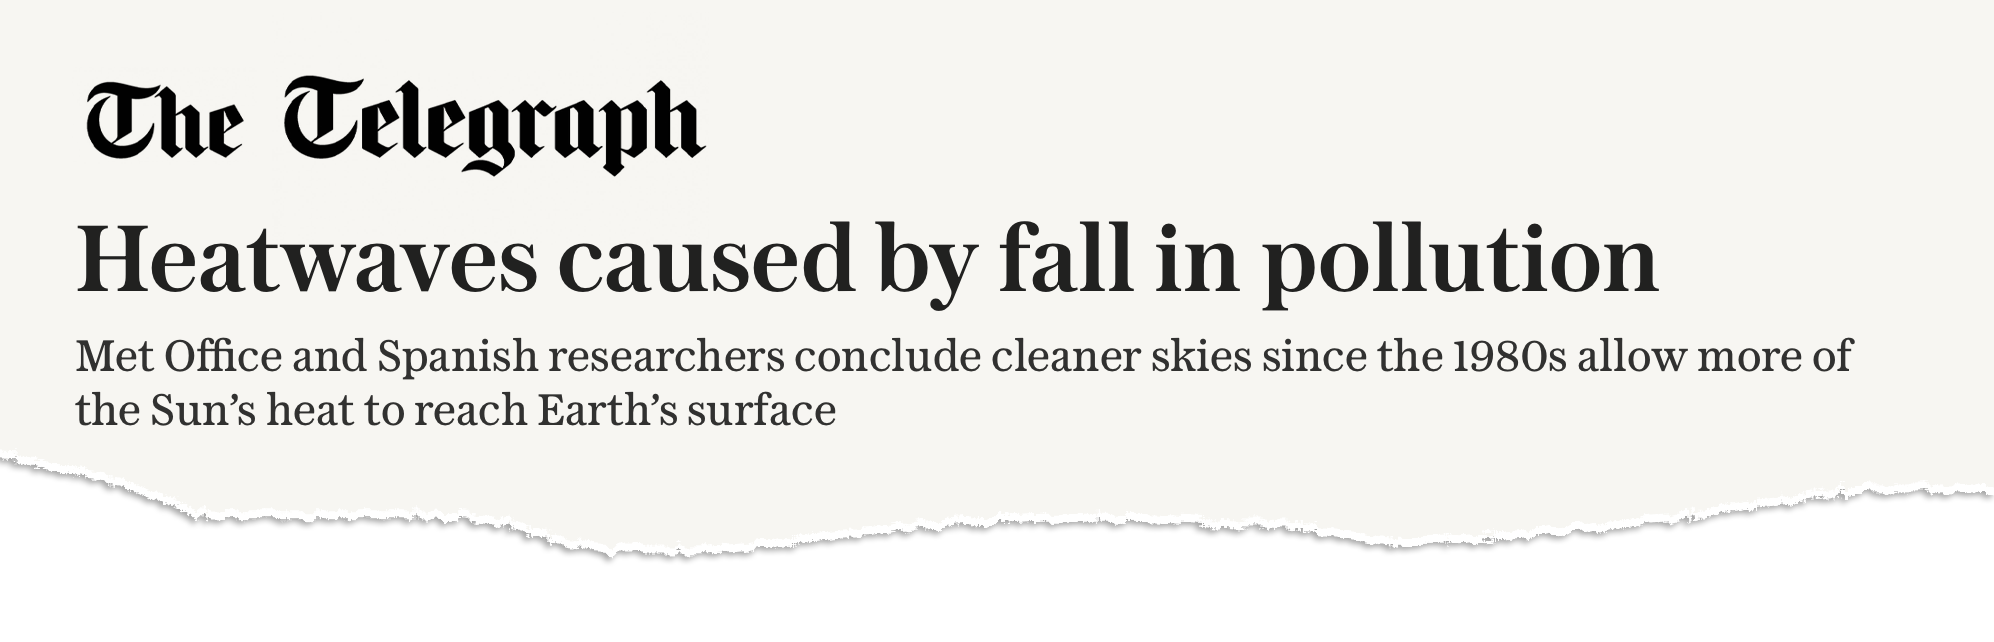
Amid widespread media coverage of the number of deaths and the influence of climate change, the UK’s Daily Telegraph reported on new research with the incorrect headline: “Heatwaves caused by fall in pollution.”
The article was shared on social media by Richard Tice – deputy leader of the hard-right, climate-sceptic Reform UK party – along with a number of prominent rightwing commentators.
Tice claimed that “net stupid zero is contributing to rising temperatures, not helping”, adding that “we have been gaslit and lied to”.
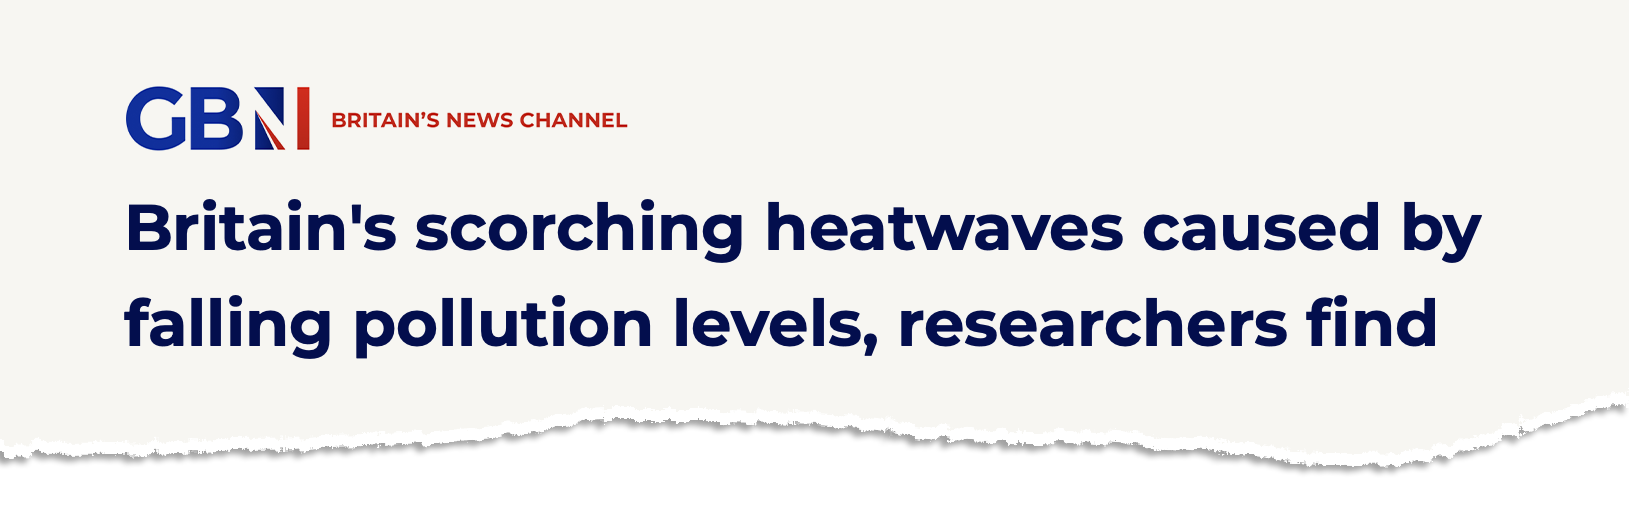
GB News followed up with its own article, incorrectly headlined: “Britain’s scorching heatwaves caused by falling pollution levels, researchers find.”
Scientists tell Carbon Brief that the framing of heatwaves being “caused” by declining air pollution is “wrong”.
While a drop in pollution has reduced the cooling impact it has had in the past, the scientists say, Europe’s summer heatwaves are primarily becoming more extreme “as a result of greenhouse-gas-induced warming”.
Another scientist adds that “any attempt” to link this research to net-zero policies is “simply wrong”.
Fast warming
The extensive reporting around Europe’s heatwaves in recent months has often mentioned that Europe is the world’s fastest-warming continent.
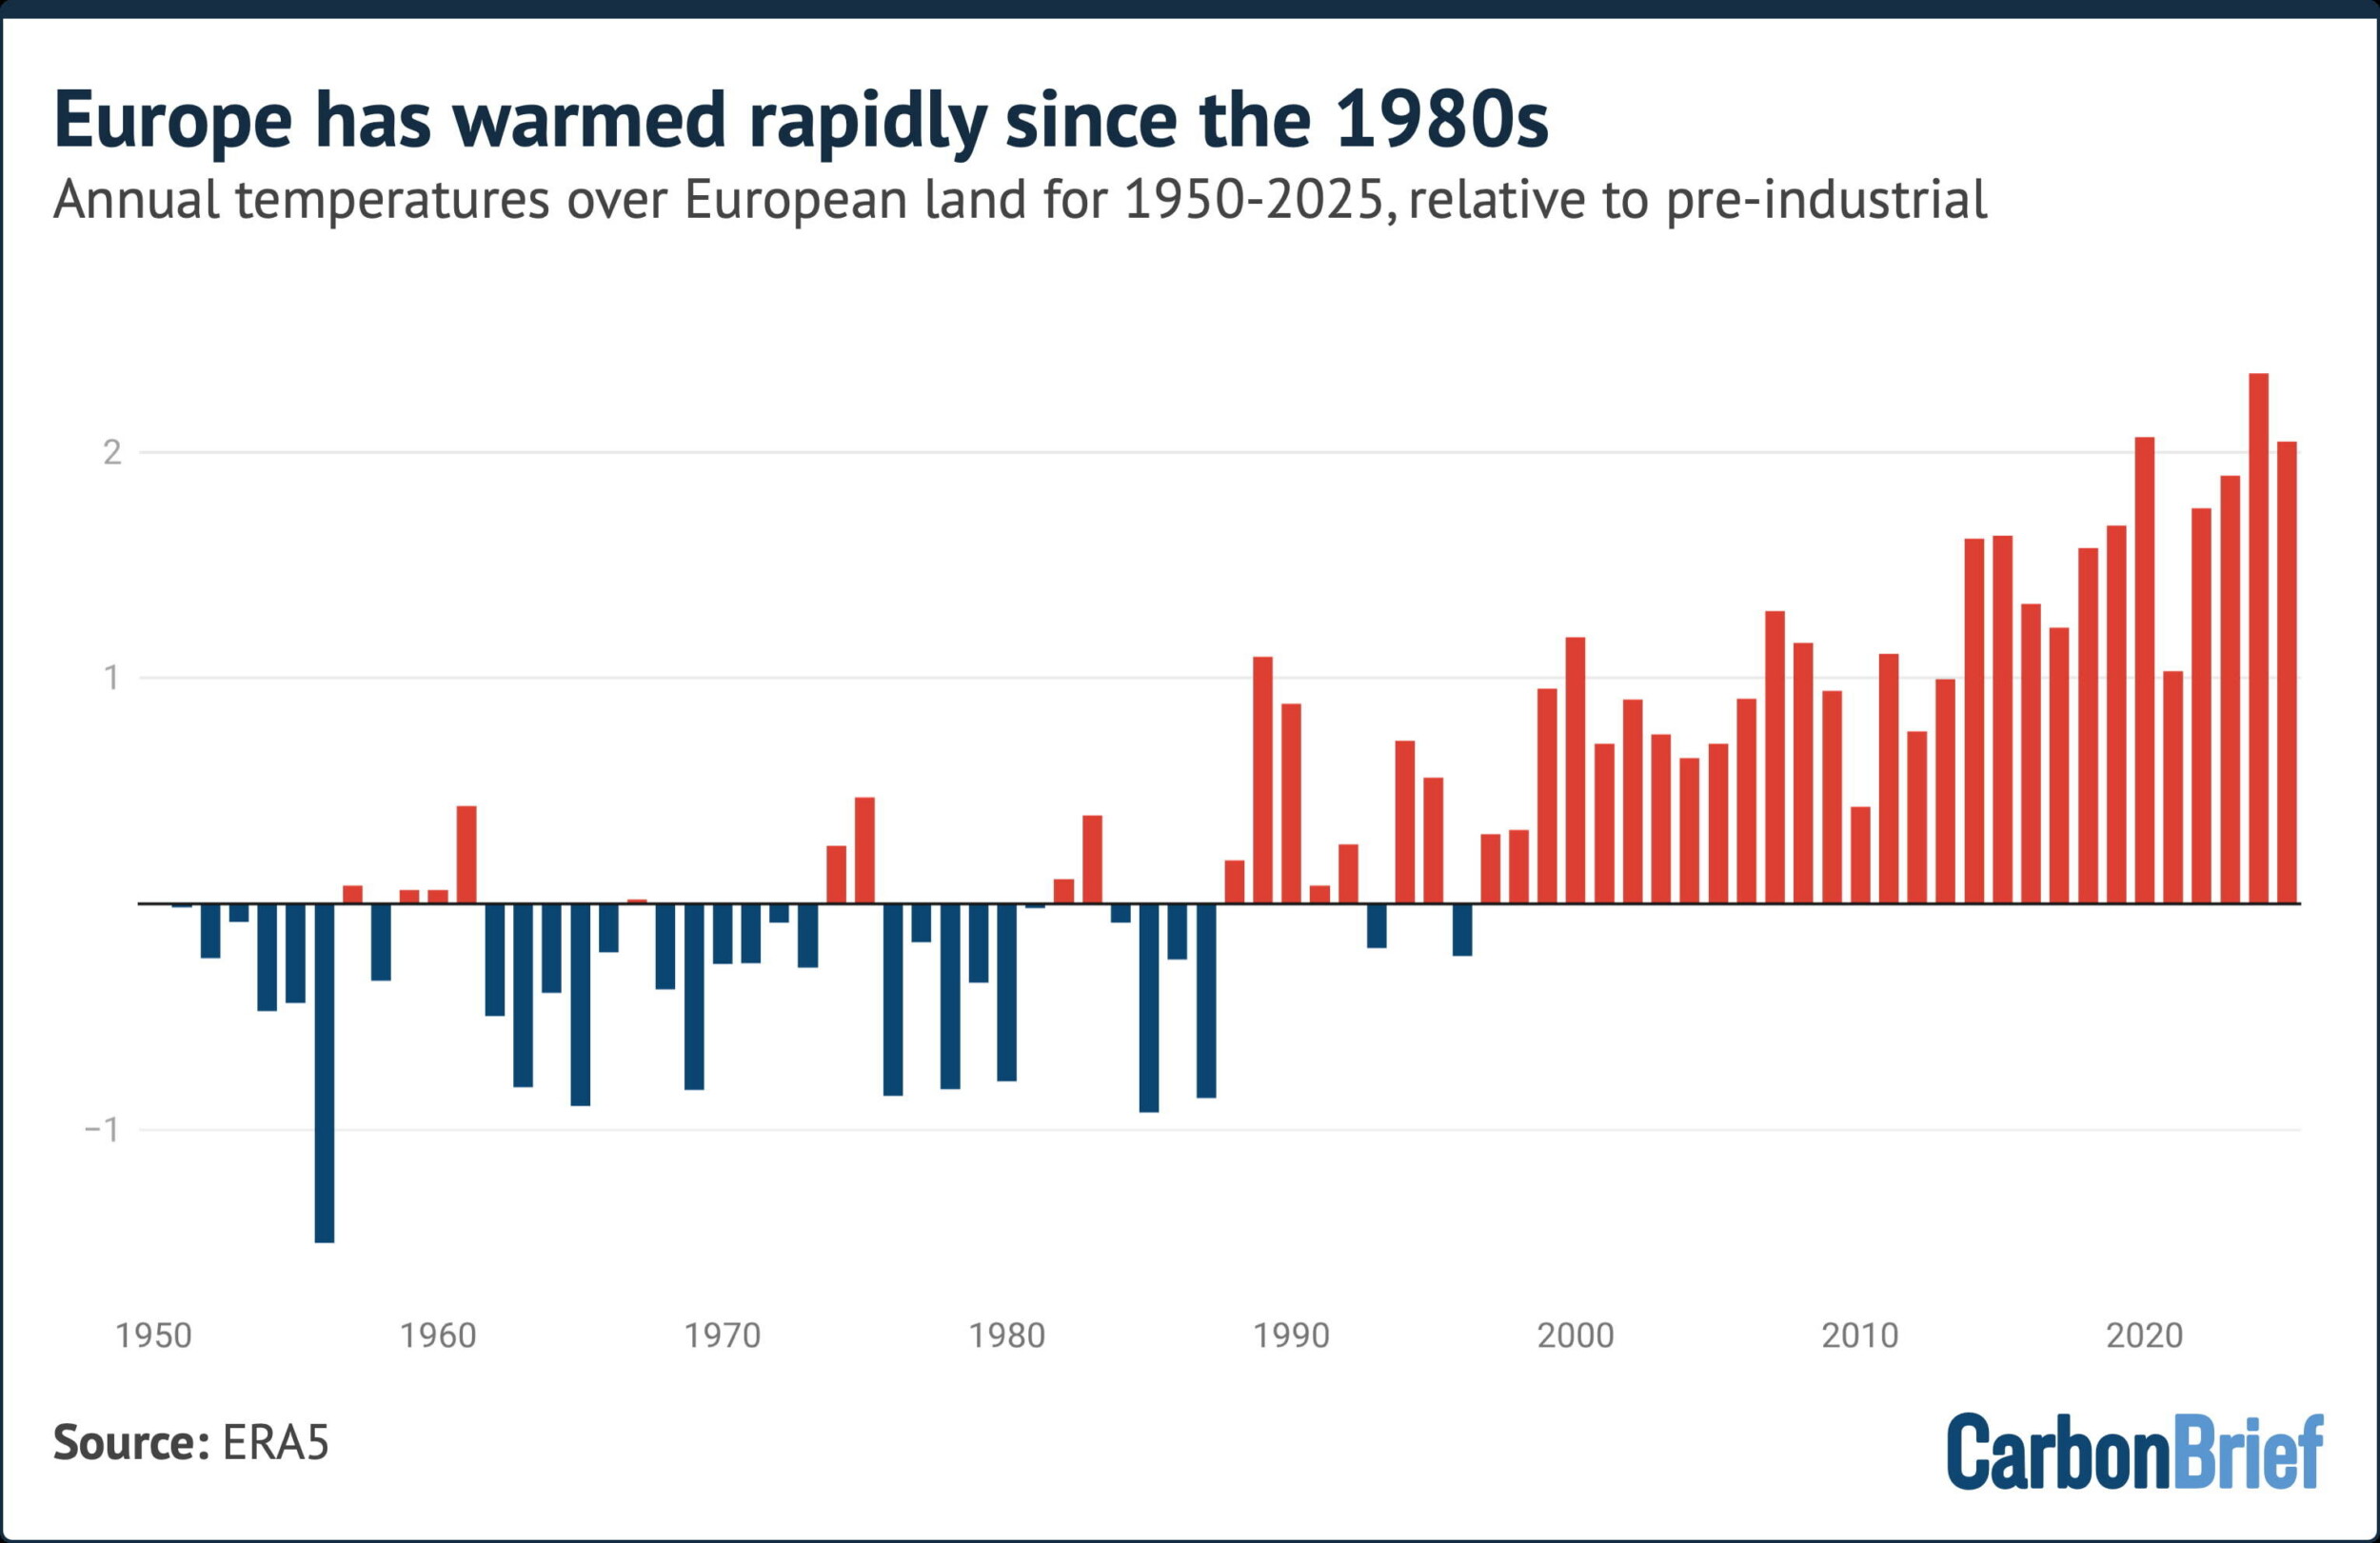
The new study in question aims to unpack why Europe’s summer temperatures are rising more quickly than other regions of the northern hemisphere’s mid and high latitudes.
The research – published in Geophysical Research Letters – explores the role of air pollution and, specifically, how it affects circulation patterns in the atmosphere.
(The study focuses on long-term trends in European summers and does not include the very recent heatwaves.)
Human-caused emissions of aerosols – tiny, light‑scattering particles produced mainly by burning fossil fuels – have long acted to “mask” global warming. This is largely because they absorb or reflect incoming sunlight and influence the formation and brightness of clouds.
To understand how the climate of Europe – or any region – is changing, scientists need to take into account a whole range of factors, says Prof Bjørn Samset, a research professor at Norway’s Center for International Climate Research (CICERO), who was not involved in the work.
This includes “greenhouse gases, aerosols, land-use change, natural variability and how they all interact”, he says, adding:
“The effects of air pollution on circulation, which is the topic here, has long been difficult to pin down.”
As European countries improved their air quality through the second half of the 20th century, the cooling effect of aerosols has gradually been removed.
This can boost heatwaves in two ways – directly, by letting more sunlight reach the land surface and, indirectly, by influencing the jet stream.
Using hundreds of simulations from nine climate models, the new study finds that a decline in aerosols is resulting in more frequent “quasi-stationary Rossby waves”.
Rossby waves are huge meanders in the jet stream. Occasionally, they become slow-moving – or “quasi-stationary” – which allows weather systems to get stuck over one region, leading to prolonged heatwaves.
These circulation changes have contributed to Europe’s rapidly warming summers.
However, while Europe’s heatwaves are being influenced by declining aerosols, it is “wrong” to say they are being “caused” by them, says Prof Erich Fischer, a climate scientist at ETH Zurich.
Fischer, who was not involved in the study, tells Carbon Brief:
“Heatwaves are caused by high-pressure systems and are now much more frequent and intense because they are happening in a climate that is much warmer than 100 years ago as a result of greenhouse-gas-induced warming.
“The paper shows that the greenhouse-gas-induced summer warming had been temporarily masked by air-polluting aerosols. The full extent for European summers only becomes visible now as the air-polluting aerosols have declined.”
Samset adds:
“Air pollution never causes or removes global warming, it only temporarily moderates it.”
Study lead author Dr Pedro Roldán‐Gómez, an associate researcher at the Barcelona Supercomputer Centre, is quoted in the Daily Telegraph saying that “most” of the “excess warming” in Europe, beyond that of comparable regions in the northern hemisphere, can be linked to declining aerosols.
But, earlier in the article, the newspaper interprets this as, simply, “most of the extra heat experienced in Britain and Europe” is down to air pollution.
GB News uses a similar phrasing, reporting that “much of the additional warming across Britain and western Europe since the 1980s is linked to the sharp decline in airborne particles known as aerosols”.
This is “misleading”, says Fischer, while Roldan-Gomez tells Carbon Brief that this is a “tricky point”, which “could lead to wrong interpretations if not properly explained”. He adds:
“The contribution of greenhouse gases is, in any case, the most important factor.”
Cleaner air
The Daily Telegraph’s article was seized upon by Reform’s Richard Tice to claim that “cleaner air” was causing higher temperatures, rather than CO2.
This continued his position – refuted by long-established climate science – that CO2 does not drive global warming.
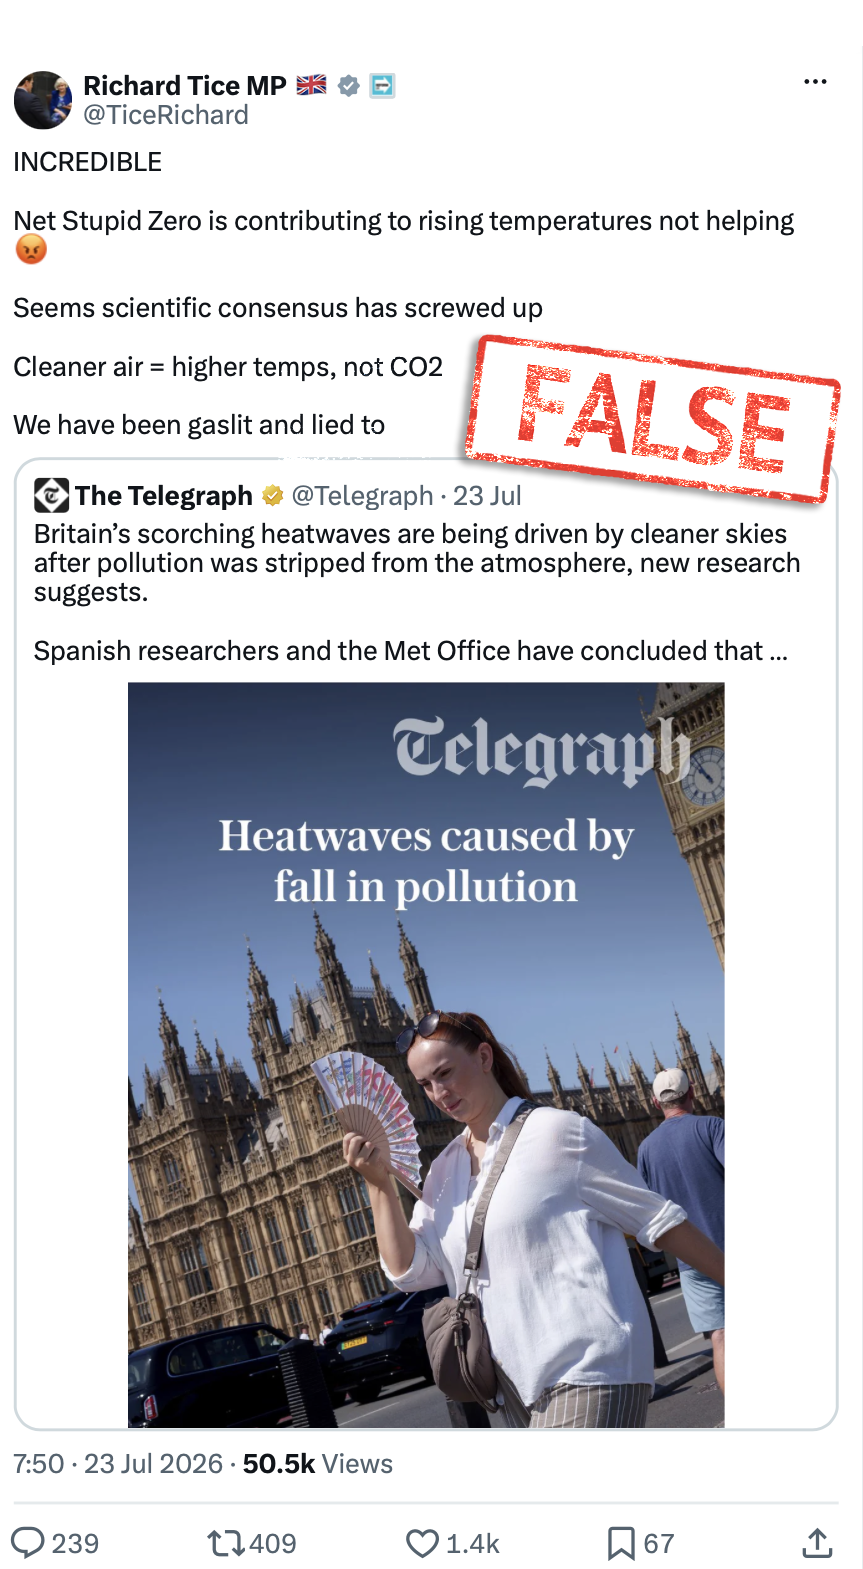
Tice also claimed in his post that net-zero policies are “contributing to rising temperatures”. Tice appears to be linking declining air pollution to a shift from fossil fuels to renewable energy.
Samset points out that net-zero became a goal “decades later” than the cumulative efforts to reduce air pollution since the 1980s and that it is “simply wrong” to link it to the study.
“The scientific community will keep working to understand how greenhouse gas warming and air pollution interact,” he says, but “nothing we do will change the fact that the consequences of global warming are due to human-induced CO2 emissions”.
Fischer adds:
“Let us not forget that cleaning up air-polluting aerosols is highly desirable. According to the World Health Organisation, 7 million people still die prematurely every year due to air pollution.”
Clean air legislation
Finally, the Daily Telegraph article and the study itself both attribute Europe’s declining air pollution from the 1980s onwards to the Montreal Protocol.
This is a “glaring error”, Samset says, and it is “surprising that it wasn’t picked up” in the peer-review process for the study. He explains:
“The Montreal Protocol did not deal with air pollution. It dealt with ozone-depleting gases and has been an extremely successful multi-national effort against environmental damage. “
Clean air legislation was already in place in many European countries by the time the Montreal Protocol was signed in 1987, says Samset.
In response, Roldán‐Gómez says that while the protocol did not target aerosols specifically, it “boosted the clean air policies”.

The post Factcheck: No, Europe’s heatwaves are not being ‘caused’ by declining air pollution appeared first on Carbon Brief.
Factcheck: No, Europe’s heatwaves are not being ‘caused’ by declining air pollution
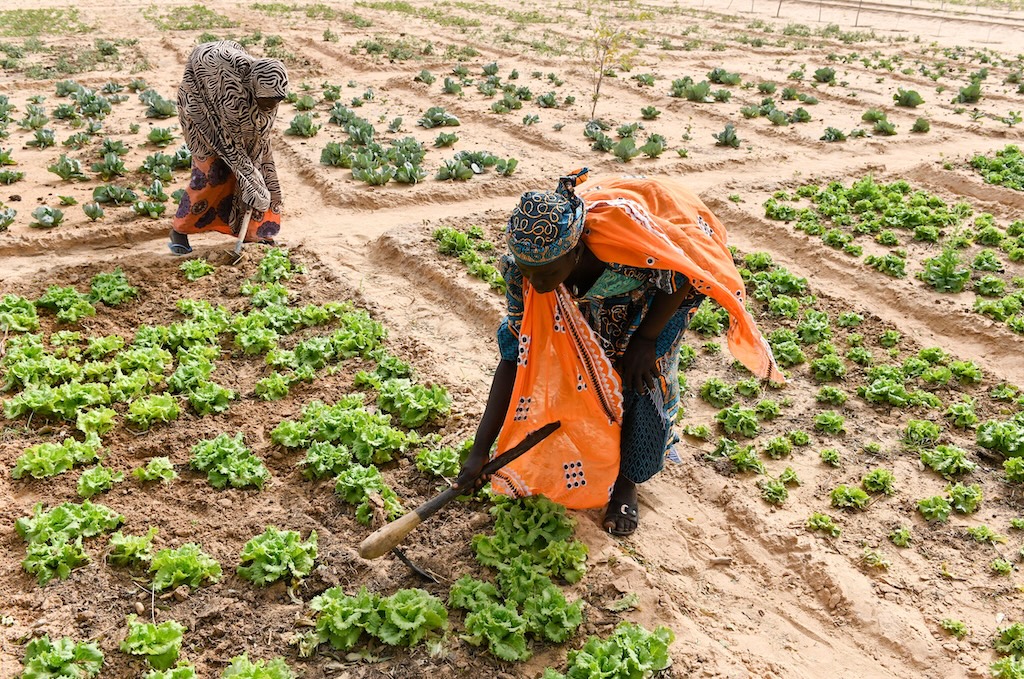
Empowering women through greater access to finance could “strengthen” households’ resilience to “climate shocks”, according to a new study.
Published in Climate Risk Management, it analyses the impact of financial access on “women-headed households” in sub-Saharan Africa.
The study finds that where women had formal financial access – such as through owning a bank account – households were more able to withstand short-term shocks.
It adds that “climate shocks”, such as extreme weather events and the impacts of climate change, can cause economic crises, which destabilise communities and households.
However, the authors say that in order to protect households from long-term climate vulnerabilities – including “droughts, floods and sea-level rise” – financial access would need to be paired with wider efforts to tackle gender inequality.
They add that the findings could have important implications for policy in sub-Saharan Africa, where many countries and households are vulnerable to climate disasters.
Financial inclusion
The study highlights that entrenched gender disparities mean many women still have unequal access to financial services in sub-Saharan Africa
For example, women are still less likely to have their own bank accounts and instead are often dependent on male relatives for access to finance.
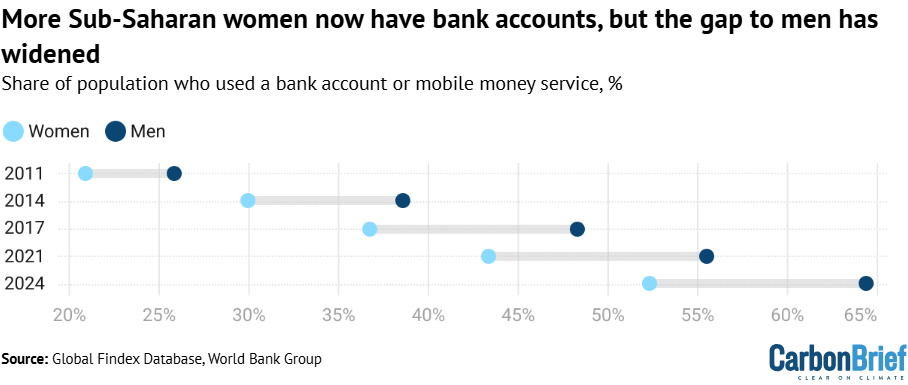
The number of women with access to an account in the region had risen to 52% as of 2024, according to data from World Bank Group.
However, as shown in the chart below, the gap between men and women has also increased, rising from just under 5 percentage points in 2011 to 12 in 2024.
Using survey data from Afrobarometer, the new study analyses 25,511 women-headed households across 37 sub-Saharan countries.
The authors use the Organisation for Economic Co-operation and Development’s (OECD) framework to measure “financial inclusion”. This looks at factors such as having a bank account, owning a mobile phone and having internet access.
Francis Anaisie, a co-author on the study, tells Carbon Brief the researchers were motivated by the UN’s sustainable development goals (SDGs). Anaisie, an economist at the University of Cape Coast, Ghana, says the study specifically looked at SDGs five and 13, on gender equality and addressing climate issues. He adds:
“Financial inclusion is one of the key policy tools for empowering women or for empowerment. But as to whether this actually translates into better climate outcomes for women is not known or is limited; this study seeks to address that gap.”
The study finds households with higher levels of financial access for women had higher levels of women’s empowerment, when this is defined as the ability to make choices and have control over economic and social outcomes.
This was checked by cross-comparing financial access against different measures of women’s empowerment, such as financial security, voting rights and connection to communities.
In particular, the study found that “financially included” women had greater political and economic empowerment, such as financial security and voting rights. On some measures of social empowerment, however, the link was weaker – financial access alone was not enough to erase cultural and social barriers to gender equality.
Women and climate change
It has been well documented that women are more vulnerable to the impacts of climate change than men.
Environmental shocks affect women disproportionately due to a range of factors. These include income disparities, higher rates of displacement and unequal access to land.
Financial inequality and barriers to economic resources, such as needing internet access to make digital payments, play a key role in climate vulnerability, says Tracy Kajumba. She is director for the Least Developed Countries initiative for Effective Adaptation and Resilience (LIFE-AR) interim secretariat at the International Institute for Environment and Development (IIED).
Kajumba, who was not involved in the study, explains to Carbon Brief:
“Women are on the front line doing farming, planting, harvesting and these things that are all impacted [by climate change]. If they don’t have the income to invest either in drought-resistant crops or water-saving technologies, it becomes difficult for households to adapt.”
Calculating climate resilience
The new study measures the impact of financial inclusion on women’s empowerment and, in turn, on climate resilience.
It evaluates a household’s ability to withstand and recover from “shocks and stressors” by using a UN Food and Agriculture Organization metric for “resilience index measurement and analysis” (RIMA).
For example, questionnaires are used to gather information about households in certain areas. The data is then used, together with key indicators, to quantify a household’s resilience to food insecurity, climate variability and economic crisis, amongst other risks.
The 25,511 households surveyed across sub-Saharan Africa were found to be relatively resilient overall and had a high capacity to bounce back from climate shocks. However, they had much lower ability to adapt, in order to build protective capacity in advance of extreme events.
In addition, the study finds that women’s financial empowerment had a positive impact on a household’s ability to “absorb” a climate shock, suggesting that financial access is critical for responding to climate change.
Increased empowerment through financial access enables women to make decisions about planting crops, to access credit in emergencies and to buy or sell food at a better price, the study notes.
For example, it says increased financial access and women’s empowerment help households to deal with the immediate consequences of an extreme weather event, such as a drought. This could be through building community mutual-support networks and by enabling access to savings, to keep the household running.
Anaisie says the study shows women’s empowerment has a significant impact on climate resilience. He tells Carbon Brief:
“If we include women in the financial system, in the case of any climate issue they can save, they can be independent, they can rely on investment to absorb these shocks. This empowerment will help them to be more resilient to climate shocks…We can make progress because SDG goals are all about inclusiveness. It’s all about inclusive growth.”
However, the study notes that financial access does not necessarily create long-term change, which would make the household less vulnerable to extreme weather in the first place.
The authors suggest that lasting structural and cultural change is important for bringing about long-term resilience. They say that policies to address gender inequalities would help bring this about.
They say such policies could include gender-sensitive agricultural credit schemes, subsidised climate insurance for women farmers in drought-prone regions, joint land-titling programmes and quotas for women in local climate-adaptation committees.
Such policies would have helped women impacted by recent severe floods in Ghana to protect their savings, Anaisie explains. He tells Carbon Brief:
“Women are engaged in economic activities, especially informal activities. They have resources and money, but when the flood came in, many women lost that. If they had access to insurance, this flood wouldn’t have cost them that much.
“So, if the government comes out with financial initiatives, training, civic education and gender-focused initiatives, leadership training, women will be empowered and this will translate into their resilience with regards to climate change.”
Addressing climate vulnerability in sub-Saharan Africa
The study could have policy implications for sub-Saharan Africa, a region particularly vulnerable to the effects of climate change. The region faces increasingly extreme weather, heatwaves, droughts, wildfires and floods, as well as food scarcity and threats to crops.
The study suggests that policies to address structural and cultural barriers to women’s financial autonomy could be a key way to build climate resilience across the region.
However, it recognises that even where financial access is expanded, gender norms and cultural constraints continue to shape women’s social empowerment. This, in turn, affects their ability to adapt to climate change in the long term.
Ultimately, addressing structural inequalities is needed to minimise climate vulnerability, says Kajumba. She adds that supporting adaptation with financial access can allow households to absorb shocks without falling into poverty – and to rebuild after climate impacts.
Kajumba says that supporting adaptation with women’s financial access can allow households to absorb shocks without falling into poverty – and to rebuild after climate impacts. She adds:
“When they are supported [with] microloans, savings and all that, you will see change in income, change in households, change in health and education for the children as well.”
However, Kajumba notes that structural inequalities still “amplify” women’s vulnerability to climate impacts and make it harder for them to exercise agency and leadership. She adds:
“The tools that are being used are not always favourable for women…When we look at women in leadership and participation, you cannot lead or you cannot participate unless you have some level of income.”
The post Access to finance ‘strengthens climate resilience’ among sub-Saharan women appeared first on Carbon Brief.
Access to finance ‘strengthens climate resilience’ among sub-Saharan women


-
Greenhouse Gases12 months ago
Guest post: Why China is still building new coal – and when it might stop
-
Climate Change12 months ago
Guest post: Why China is still building new coal – and when it might stop
-

 Greenhouse Gases2 years ago
嘉宾来稿:满足中国增长的用电需求 光伏加储能“比新建煤电更实惠”
-

 Climate Change2 years ago
嘉宾来稿:满足中国增长的用电需求 光伏加储能“比新建煤电更实惠”
-
Climate Change2 years ago
Bill Discounting Climate Change in Florida’s Energy Policy Awaits DeSantis’ Approval
-

 Renewable Energy9 months ago
Sending Progressive Philanthropist George Soros to Prison?
-

 Carbon Footprint2 years ago
US SEC’s Climate Disclosure Rules Spur Renewed Interest in Carbon Credits
-
Greenhouse Gases1 year ago
嘉宾来稿:探究火山喷发如何影响气候预测