Connect with us

Published

on

Cities around the world are facing more frequent and intense bouts of extreme heat, leading to an increasing focus on the use of air conditioning to keep urban areas cool.

With the UK having experienced its hottest summer on record in 2025, for example, there was a wave of media attention on air conditioning use.

Yet less than 5% of UK homes have air conditioning and those most vulnerable – older adults, low-income households or people with pre-existing health conditions – often cannot afford to install or operate it.

While air conditioning may be appropriate in certain contexts, such as hospitals, community spaces or care homes, it is not the only solution.

Our research as part of the IMAGINE Adaptation project shows that a universal focus on technical solutions risks deepening inequality and has the potential to overlook social, economic and environmental realities.

Instead, to adapt to record temperatures, our research suggests a keener focus on community and equity is needed.

Contextualising urban heat vulnerability

In the UK, heatwaves are becoming more frequent and severe. Moreover, the evidence points to significant disparities in exposure and vulnerability. By 2080, average summer temperatures could rise by up to 6.7C, according to the Met Office.

During the summer of 2023, around 2,295 heat-related deaths occurred across the UK, with 240 in the South West region. Older adults, particularly those over 65, were the most affected, government figures show.

A recent UN Environment Programme report highlights that there is an “urgent” need for adaptation strategies to deal with rising summer heat.

However, our research shows that framing air conditioning as the default solution risks worsening urban heat by increasing emissions and energy bills, as well as missing the opportunity to design more inclusive, human-centred responses to rising temperatures.

Addressing both gradual and extreme heat involves understanding who is most affected, how people move through cities and the role of social networks.

In recognition of this, cities around the world are already developing potential cooling strategies that combine low-emission interventions with community-based care.

Expanding the concept of ‘cool spaces’

In the UK, Bristol City Council is working on a “cool space” initiative with support from the European Research Council-funded project IMAGINE Adaptation.

The initiative aims to identify a network of public spaces that can offer respite during periods of extreme heat. These spaces can potentially include parks, libraries, community centres or even urban farms.

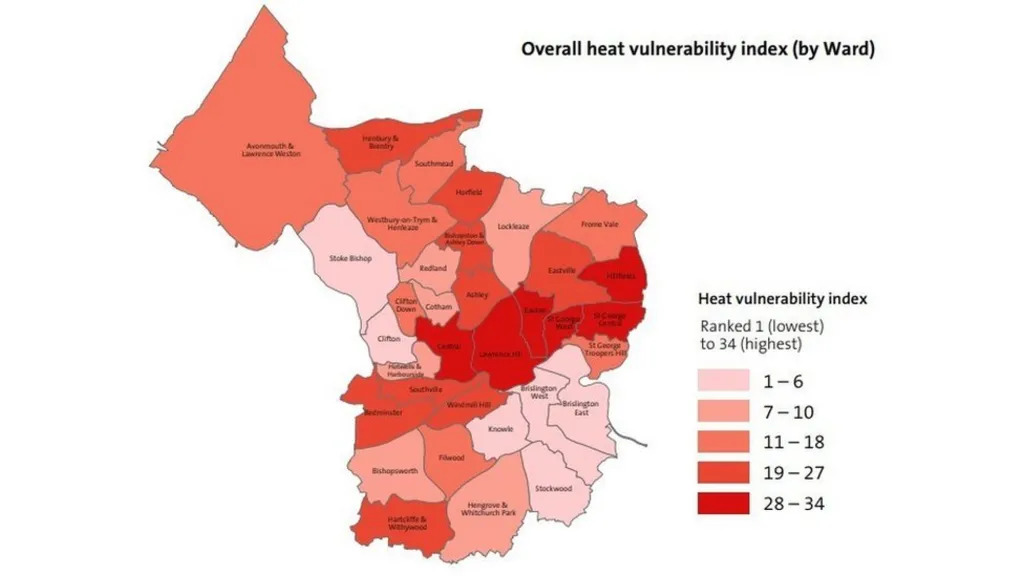
The map below shows how heat vulnerability varies across the city of Bristol, identifying neighbourhoods most at risk from current and future heatwaves.

Overall heat vulnerability index (by ward), Bristol
Map of heat vulnerability in Bristol from the “Keep Bristol Cool” mapping tool. Source: Bristol City Council.

But what makes a space “cool”? We used surveys, interviews and workshops to collectively come to an understanding of what a cool space means for Bristol communities.

What emerged from our work is that “cool” is about far more than temperature.

Shade, natural ventilation, seating, access to water and toilets all contribute to comfort, but they do not capture the full picture.

Social and cultural factors, such as whether people feel welcome, whether spaces are free to use or whether children can safely reach them, are equally important. For example, we found that while many community spaces are open to the public, people are often unsure whether they can spend time there without having to buy something.

Our research shows that the presence of a café, even unintentionally, can signal that time and space come at a cost. Clear signage, free entry, drinking water and toilets can help people feel that they are welcome to stay.

Additionally, our research highlights that it is important to recognise that public space is not experienced equally by everyone. Some city centre parks, for instance, may be seen as unwelcoming by people who do not drink alcohol or who feel uncomfortable around noise and large groups.

Creating cool spaces that serve the whole community involves understanding these dynamics and exploring more inclusive alternatives.

Connecting adaptation efforts

The importance of understanding the dynamics of adaptation efforts is especially relevant when considering children, as they are often more vulnerable to increasing temperatures.

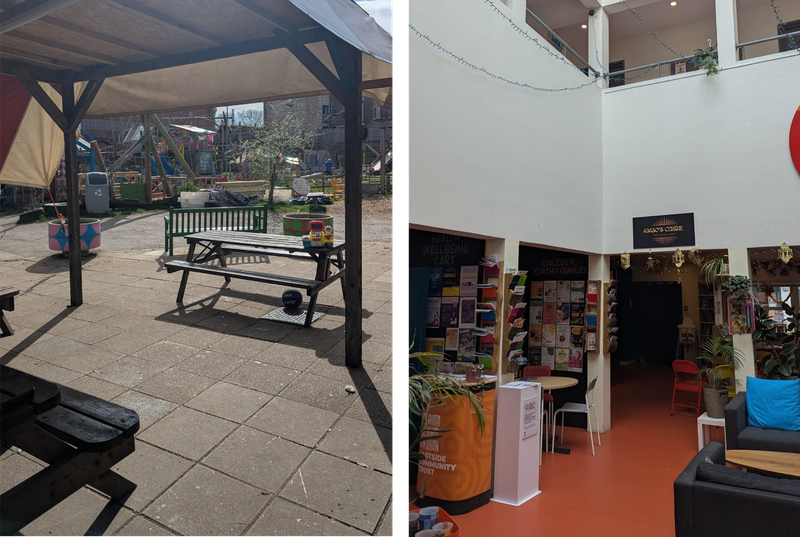
At Felix Road adventure playground – one of the early pilot sites in Bristol – staff introduced shaded areas, drinking water and ice lollies to support children during hot weather.

However, adaptation does not just happen at individual sites, but between them, as connectivity to the playground by foot or public transport exposes children to the heat and traffic.

This highlights that adaptation to heat is a city-wide concern, as the effectiveness of individual cooling interventions can depend on both the space itself and how it can be accessed and used by vulnerable populations.

Buses and trains can become uncomfortably hot, making travel difficult for those most at risk. Our research suggests that for some, staying home might seem safer, but many lack cooling options.

Early discussions in the cool space trial show this is especially true for older adults, who also seek social contact alongside thermal comfort in community centres. Advice to stay home during heatwaves, without adequate cooling or guidance, therefore risks both physical harm and increased social isolation.

Felix Road adventure playground (left) and Eastside Community Trust (right), both potential “cool spaces” participating in the trial. Source: IMAGINE adaptation. Photo by William Lewis.

Relational approaches to adaptation

Viewing cooling as a social issue transforms how we approach urban adaptation and, more importantly, climate action.

Air conditioning reduces temperature, but it does not help foster trust or strengthen community ties. Our research shows that a well-designed community space, by contrast, integrates physical comfort with social support.

For example, they offer places where a parent can supervise children safely in water play, where an older adult might be offered a cold drink or a fan, or where people can simply rest without judgment. These small interactions, while often overlooked, can contribute to reducing heat stress, dehydration or social isolation during heatwaves, creating public spaces that are safer and more supportive for heat-vulnerable residents.

Cool spaces can also serve multiple roles. A library may host children’s activities or provide food support, while a community centre might offer advice on home cooling.

These spaces show that strong community relationships are key to real climate action, offering comfort, connection and practical help all in one place.

Our research shows that by embedding care into design, cities can build approaches to adaptation that go beyond temperature control, recognising the diverse needs of their communities.

However, to continue serving this role effectively, community spaces require ongoing support, including adequate funding, staffing and resources. Without such support, their ability to provide safe, welcoming and inclusive cooling environments for the most vulnerable can be limited.

Challenges and trade-offs

Our research finds that imagining “cool” adaptation is not without challenges.

Our reflections from the ongoing work in Bristol highlight the importance of context-sensitive, adaptive strategies that consider how people live and their needs and expectations, without neglecting the urgent demands of climate action and health protection.

What works in one neighbourhood may be unsuitable in another – and success cannot be defined solely by temperature reduction or visitor numbers.

Listening to communities, observing patterns of use and being willing to reconsider early designs through experimentation and learning are arguably essential for interventions that are socially, culturally and environmentally appropriate.

Climate change is already reshaping how cities function and how communities think and behave. Heatwaves are no longer rare events; they are increasingly intense and dangerous.

In this context, air conditioning may have a role in specific settings and for specific reasons, but it is not the sole answer. Our research shows it cannot replace locally grounded, inclusive and relational approaches to adaptation.

Bristol’s “cool spaces” initiative demonstrates that interventions are most likely to be effective when they are accessible, welcoming and build community, providing more than just shade or technical relief.
This requires investment, coordination and time, but also a shift in perspective: cooling is not just a technical challenge, but about how we look after one another and how we collectively imagine our public spaces in a changing climate.

The post Guest post: Why cities need more than just air conditioning for extreme heat appeared first on Carbon Brief.

Guest post: Why cities need more than just air conditioning for extreme heat

Continue Reading

Climate Change

Guest post: How the Greenland ice sheet fared in 2025

Published

on

Greenland is closing in on three decades of continuous annual ice loss, with 1995-96 being the last year in which the giant ice sheet grew in size.

With another melt season over, Greenland lost 105bn tonnes of ice in 2024-25.

The past year has seen some notable events, including ongoing ice melt into the month of September – well beyond the end of August when Greenland’s short summer typically draws to a close.

In a hypothetical world not impacted by human-caused climate change, ice melt in Greenland would rarely occur in September – and, if it did, it would generally be confined to the south.

In this article, we explore how Greenland’s ice sheets fared over the 12 months to August 2025, including the evidence that the territory’s summer melting season is lengthening.

(For our previous analyses of Greenland’s ice cover, see coverage in 2024, 2023, 2022, 2021, 2020, 2019, 2018, 2017, 2016 and 2015.)

Surface mass balance

The seasons in Greenland are overwhelmingly dominated by winter.

The bitterly cold, dark winter lasts up to ten months, depending on where you are. In contrast, the summer period is generally rather short, starting in late May in southern Greenland and in June in the north, before ending in late August.

Greenland’s annual ice cycle is typically measured from 1 September through to the end of August.

This is because the ice sheet largely gains snow on the surface from September, accumulating ice through autumn, winter and into spring.

Then, as temperatures increase, the ice sheet begins to lose more ice through surface melt than it gains from snowfall, generally from mid-June. The melt season usually continues until the middle or end of August.

Over this 12-month period, scientists track the “surface mass balance” (SMB) of the ice sheet. This is the balance between ice gains and losses at the surface.

To calculate ice gain and losses, scientists use data collected by high-resolution regional climate models and Sentinel satellites.

The SMB does not consider all ice losses from Greenland – we will come to that later – but instead provides a gauge of changes at the surface of the ice sheet.

According to our calculations, Greenland ended the year 2024-25 with an overall SMB of about 404bn tonnes. This is the 15th highest SMB in a dataset that goes back 45 years, exceeding the 1981-2010 average by roughly 70bn tonnes.

This year’s SMB is illustrated in the maps and charts below, based on data from the Polar Portal.

The blue line in the upper chart shows the day-to-day SMB. Large snowfall events become visible as “spikes”. The blue line in the lower chart depicts the accumulated SMB since 1 September 2024. In grey, the long-term average and its variability are shown. For comparison, the red line shows the record-low year of 2011-12.

The map shows the geographic spread of SMB gains (blue) and losses (red) for 2024-25, compared to the long-term average.

It illustrates that southern and north-western Greenland had a relatively wet year compared to the long-term average, while there was mass loss along large sections of the coast, in particular in the south-west. The spikes of snow and melt are clearly visible in the graphs on the right.

Left: Map showing the difference between the annual SMB in 2024-25 and the 1981-2010 period in mm of ice melt. Blue shows ice gain compared to average and red shows ice loss with respect to average. Right: Daily (upper chart) and cumulative (lower chart) SMB of the Greenland ice sheet, in Gt/day and Gt, respectively. (1Gt is equal to 1 cubic kilometre.) Blue lines show the 2024-25 SMB year; the grey lines and areas show the 1981-2010 average and variability; and the red line in the lower chart shows the record low SMB year of 2011-12. Credit: Polar Portal.

Lengthening summer

Scientists have traditionally pinned the start of the “mass balance year” in Greenland to 1 September, given that this is when the ice sheet typically starts to gain mass.

However, evidence has started to emerge of a lengthening of the summer season in Greenland – as predicted some time ago by climate models.

The start of the 2024-25 mass balance year in Greenland saw ice melt continuing into September. This included a particularly unusual spike in ice melt in the northern part of the territory in September as well as all down the west coast.

In a world without human-caused climate change, ice melt in September would be very rare – and generally confined to the south.

Greenland also saw an early start to the summer melt season in 2025. The onset of the melting season, defined as the first of at least three days in a row with melting over more than 5% of the ice sheet, was on 14 May. This is 12 days earlier than the 1981-2025 average.

The maps below show the extent of melt (red shading) across the ice sheet on 24 September 2024 (left) and 20 May 2025 (right). The blue lines in charts beneath show the percentage melt in 2024 (left) and 2025 (right), up to these dates, compared to the 1981-2010 average (grey).

The melt season began with a significant spike of melting across the southern part of the ice sheet. This happened in combination with sea ice breaking up particularly early in north-west Greenland, allowing the traditional narwhal hunt to start much earlier than usual.

Top: Map showing areas of Greenland undergoing surface melt on 24 September 2024 and 20 May 2025 (shaded red). Bottom: Percentage of ice sheet area seeing surface melt on each day of 2024 and 2025 (blue line), ending on 24 September and 20 May, respectively. The grey line shows the 1981-2010 average. Credit: Polar Portal.

Surface melt

The ablation season, which covers the period in the year when Greenland is losing ice, started a little late. The onset of the season – defined as the first of at least three days in a row with an SMB below -1bn tonnes – began on 15 June, which is two days later than the 1981-2010 average.

Overall, during the 2025 summer, a remarkably large percentage of the ice sheet was melting at once. This area was larger than the 1981-2010 average for three and a half months (mid-June to end of September).

In mid-July, melting occurred over a record area. For three days in a row, melting was present over more than 80% of the area of the ice sheet – peaking at 81.2%. This is the highest value in our dataset, which started in 1981.

The red shading in the maps below shows the extent of melting across Greenland on 19 July (left) and 30 September (right) 2025. The charts beneath show the daily extent of melting through 2025 (blue line), up to these dates, compared to the 1981-2010 average.

Top: Map showing areas of Greenland undergoing surface melt (shaded red) on 19 July (left) and 30 September (right) 2025. Bottom: Percentage of ice sheet area seeing surface melt on each day of 2025 (blue line), ending on 19 July and 30 September, respectively. The grey line shows the 1981-2010 average. Credit: Polar Portal.

Snowfall

However, the SMB is not just about ice melt.

There was a lack of snowfall in the early winter months (September to January), particularly in south-east Greenland, which is typically the wettest part of the territory. The months that followed then saw abundant snow, which brought snowfall totals up closer to average by the start of summer.

A cold period at the end of May and in June protected the ice sheet from excessive ice loss. Melt then continued rather weakly until mid-July.

This was followed by strong melting rates in the second half of July and again in mid-August.

Overall, with both ice melt and snowfall exceeding their historical averages for the year as a whole, the SMB of the Greenland ice sheet ended above the 1981-2010 average.

These increases in snowfall and melt are in line with what scientists expect in a warming climate. This is because air holds more water vapour as it warms – leading to more snowfall and rain. Warmer temperatures also lead to more ice melt.

Total mass balance

The surface mass balance is just one component of the “total” mass balance (TMB) of the Greenland ice sheet.

The total mass balance of Greenland is the sum of the SMB, the marine mass balance (MMB) and basal mass balance (BMB). In other words, it brings together calculations from the surface, sides and base of the ice sheet.

The MMB measures the impact of the breaking off – or “calving” – of icebergs, as well as the melting of the front of glaciers where they meet the warm sea water. The MMB is always negative and has increased towards more negative values over the last decades.

BMB refers to ice losses from the base of the ice sheet. This makes a small negative contribution to the TMB.

(The only way for the ice sheet to gain mass is through snowfall.)

The continued mass loss observed in Greenland is primarily due to a weakening of the SMB – caused by rising melt combined with insufficient compensation of lost ice through snowfall.

The figure below shows how much ice the Greenland ice sheet has lost (red) going back to 1987, which includes the SMB (dark blue), MMB (mid blue) and BMB (light blue). The analysis, which uses data from three models, is based on 2021 research published in Earth System Science.

Despite a relatively high SMB, high calving rates meant that Greenland lost 105bn tonnes of ice over the 12-month period.

This means that 2024-25 was the 29th year in a row with a Greenland ice sheet overall mass loss. As the chart shows, Greenland last saw an annual net gain of ice in 1996.

Chart showing that 2024-25 was the 29th year in a row where Greenland's ice sheet lost mass overall
Chart showing the surface (blue), marine (green), basal (yellow) and total (red) mass balance for the “mass balance years” 1987 to 2025. Figures are in Gt per year. Mass balance year 1987 is from 1 September 1986 to 31 August 1987; similar for other years. Credit: Carbon Brief, based on updates to Mankoff et al. (2021).

Satellite data

The mass balance of the Greenland ice sheet can also be measured by looking at the Earth’s gravitational field, using data captured by the Grace and Grace-FO satellite missions – a joint initiative from NASA and the German Aerospace Center.

The Grace satellites are twin satellites that follow each other closely at a distance of about 220km, which is why they are nicknamed “Tom and Jerry”. The distance between the two depends on gravity – which is, in turn, related to changes in mass on Earth, including ice loss.

Therefore, the distance between the two satellites, which can be measured very precisely, can be used to calculate loss of mass from the Greenland ice sheet.

Overall, the satellite data reveals that Greenland’s ice sheet lost around 55bn tonnes of ice over the 2024-25 season.

There is reasonably good agreement between the Grace satellite data and the model data, which, as noted above, finds that 105bn tonnes of ice was lost in Greenland over the same period.

However, the alignment of the two datasets – which are fully independent of each other – becomes more clear once a longer time period is considered.

In the 22-year period between April 2002 and May 2024, the Grace data shows that Greenland lost 4,911bn tonnes of ice. The modelling approach, on the other hand, calculates that 4,766bn tonnes of ice was lost.

The figure below shows gain and loss in the total mass of ice of the Greenland ice sheet, calculated using Grace satellite measurements. It reveals that, over the past 23 years, there has been mass loss in the order of several metres along the coasts of Greenland, with the most significant losses seen on the western coast. Over the central parts of the ice sheet, there has been a small mass gain.

The lower figure shows the contribution of Greenland mass change to sea level rise over the last 23 years, according to the satellite data. It illustrates that more than 5,000bn tonnes of ice have been lost over the time period – contributing to roughly 1.5cm of sea level rise.

Gain and loss in the total mass of ice of the Greenland ice sheet based on the GRACE and GRACE-FO satellites, updated until July 2025. Shown is the month-by-month mass change in billions of tonnes (Gt) = cubic kilometres (km3). Credit: Polar Portal.
Greenland mass change’s contribution to sea level rise, where 100bn tonnes is equivalent to 0.28mm of global sea level rise. All changes are given relative to April 2002. Credit: Polar Portal.

Warm over Europe and North America, cool over Greenland

As always, the weather systems across the northern hemisphere play a key role in the melt and snowfall that Greenland sees each year.

As in previous years, multiple heatwaves were observed in southern Europe and North America over the summer of 2025.

And, just like in 2024, there was only modest heat in northern Europe – with the notable exception of Arctic Scandinavia – with a comparably cool and rainy July followed by a warmer and sunnier August.

The high-pressure weather systems that bring heatwaves have a wide-ranging impact on weather extremes across the northern hemisphere.

Strong blocking patterns over North America and Europe were repeatedly present in the course of the summer of 2025. In such a blocked flow, the jet stream – fast-moving winds that blow from west to east high in the atmosphere – is shaped like the Greek capital letter Omega (Ω).

The jet stream bulged up to the north over Canada and northern Europe. West and east of these ridges, low pressure troughs were found at both “feet” of the Omega. One of these troughs was located over Greenland (top left panel in next figure).

This resulted in widespread heat near the cores of these high-pressure systems, fuelling fires in several countries, including large wildfires in Canada. Smoke from these wildfires reached Greenland and Europe in late May.

Unlike in previous years, no heavy precipitation events were observed near the “feet” of the Omega.

If the Omega pattern is displaced by half a wavelength, the opposite – warm over Greenland, with cool continents – is also possible.

This circulation pattern occurred in August 2025 and is shown in the top right panel of the figure below. The bottom panel depicts the large temperature variability in May 2025.

Top panel: Left: Map showing cool summer weather in Greenland (in centre of map) and very mild conditions over northern North America and northern Europe as well as Asia in December 2024. Right: Warm weather over Greenland with cool continents in August 2025. Shading indicates temperatures that are warmer (red) or cooler (blue) than the long-term average for the time of year. The arrows show the circulation patterns in the atmosphere. Bottom panel: large temperature variability in May 2025. Credit: Polar Portal.

The post Guest post: How the Greenland ice sheet fared in 2025 appeared first on Carbon Brief.

Guest post: How the Greenland ice sheet fared in 2025

Continue Reading

Climate Change

The ocean, our planet’s forgotten hero, deserves a formal place in UN climate talks

Published

on

Tiago Pitta e Cunha is chief executive of the Oceano Azul Foundation.

The recent COP30 in Belém, Brazil, brought nations together to confront the escalating climate crisis. But amid their discussions, there was a paradox: while a growing number of countries see the ocean as essential to climate action, there is still no institutional mechanism to integrate this critical ally into global climate deliberations.

One way of doing that could be to establish a dedicated ocean agenda item within the official COP agenda, upgrading the existing informal ocean climate dialogue created in COP26 in Glasgow and in doing so, opening a door to unlock the ocean’s potential for climate change mitigation and adaptation.

The ocean is the forgotten hero of the climate system. It absorbs more than 90% of excess heat generated by global warming, regulates temperatures across all continents and stores 25% of the greenhouse gases emitted annually into the atmosphere.

It is also the ultimate destination of more than 90% of the accumulated stock of all man-made carbon since the beginning of the industrial revolution, making it Earth’s most vital carbon sink.

Ocean-based solutions

But despite this indispensable role, the ocean has historically been almost absent in climate strategies and finance. For years, ocean action received less than 1% of global climate finance.

There has been some progress, however. Initiatives such as the “Blue NDC Challenge”, which calls on countries to insert the ocean into their national climate action plans (NDCs), co-led by France and Brazil and supported by nations including Belgium, Cambodia, Canada, Indonesia, Portugal and Singapore, demonstrate a growing political will.

    As more countries incorporate ocean-based measures into their national climate plans, there’s clear momentum. Research suggests that fully deploying ocean-based solutions – from decarbonising shipping to expanding marine protected areas – could deliver up to 35% of the emissions reductions needed to stay on a 1.5C pathway by 2050.

    Yet, this recognition has not translated into formal institutionalisation within the process of the United Nations Framework Convention on Climate Change (UNFCCC). For its first 25 years, the ocean was largely absent from COP discussions. While recent efforts have integrated some ocean references into important climate texts, ocean consideration remains informal and scattered – almost a footnote.

    The recently revealed breach of the seventh planetary boundary for ocean acidification – and rebukes from the International Court of Justice and the International Tribunal for the Law of the Sea – underscore the dire need for formal integration.

    Ocean agenda item at future COPs

    A dedicated ocean agenda item at future COPs, starting with COP31, is not merely desirable; it is a necessity. This would elevate the ocean’s status, provide the meaningful integration of the ocean into the climate regime, and bring transparency to discussions on the key ocean-climate related issues.

    It would also empower the UNFCCC secretariat to take more meaningful ocean-climate action. Countries are starting to become convinced of this imperative, with Fiji leading the charge in Belém by calling for a dedicated ocean agenda item.

    Peter Thomson, the UN Secretary-General’s special envoy for the ocean, similarly emphasised that without a dedicated agenda item, the ocean will remain invisible in the very negotiations that depend on it.

    The reef surrounding Namotu Island, Fiji, has experienced serious coral bleaching caused by increasing ocean temperatures. (Photo: Beau Pilgrim / Climate Visuals)

    The reef surrounding Namotu Island, Fiji, has experienced serious coral bleaching caused by increasing ocean temperatures. (Photo: Beau Pilgrim / Climate Visuals)

    Additionally, the global target of 30×30 encompassing the protection of 30% of the ocean by 2030, must be formally acknowledged as essential in the fight against climate change.

    Marine Protected Areas (MPAs) offer a prime example of the ocean’s untapped power. These designated zones safeguard critical marine ecosystems, increase biomass, expand fish stocks and enhance biodiversity.

    Crucially, MPAs significantly boost the ocean’s natural capacity for carbon sequestration, particularly in blue carbon ecosystems such as mangroves, salt marsh lands and seagrass beds, and by enhancing the biological carbon pump in the high seas.

    As the Paris Agreement turns 10, what has it achieved?

    Furthermore, with the High Seas Treaty entering into force in January 2026, creating MPAs in areas beyond national jurisdiction becomes a reality, offering an opportunity to integrate ocean and climate solutions on a global scale. MPAs offer thus a strong and often overlooked pathway for countries to meet their climate targets and accelerate their journey towards net zero.

    The urgency of securing results from the ocean-climate nexus demands a fundamental re-evaluation of its position within the UNFCCC process. The cross-cutting nature of ocean issues means that without a formal agenda item, discussions will remain fragmented and ineffective. The momentum generated by the Blue NDC Challenge and the growing number of nations championing ocean solutions must be formalised before COP31.

    We have run out of time and can no longer afford to treat our ocean as an optional extra. The moment for the ocean to secure a permanent, central position in global climate action is now.

    The post The ocean, our planet’s forgotten hero, deserves a formal place in UN climate talks appeared first on Climate Home News.

    The ocean, our planet’s forgotten hero, deserves a formal place in UN climate talks

    Continue Reading

    Climate Change

    UN adopts first-ever resolution on AI and environment, but omits lifecycle

    Published

    on

    The UN Environment Assembly on Friday approved its first-ever resolution to address the environmental aspects of Artificial Intelligence (AI), but it did not include a provision to monitor AI systems across their lifecycle. Experts say this approach is essential to understand AI’s water, power and critical minerals consumption.

    The resolution proposed by Kenya aims to harness “the opportunities and benefits of artificial intelligence systems in support of the environment and by minimizing its environmental impacts”.

    It also requests the UN Environment Programme (UNEP) to produce a report on the “environmental benefits, risks and impacts of artificial intelligence”.

    As negotiations progressed over the week in Nairobi, the draft resolution on AI had called for UNEP’s executive director to explore environmental benefits, risks and impacts of artificial intelligence “systems across their lifecycle”.

    However, while governments including Kenya, Norway, Colombia and the European Union supported such wording, annotated draft texts showed that Saudi Arabia, Russia and the United Arab Emirates wanted it to be deleted.

    When the final resolution was gavelled on Friday, all trace of the AI lifecycle had been removed from the text. References to AI’s water and energy consumption – which featured in previous draft texts – were also removed.

      “We cannot talk about sustainable AI without addressing the full lifecycle, from the traceability of critical minerals, to the water used in data centres, to how much renewable energy is being redirected from developing countries to power AI systems in wealthier regions,” said Faith Munyalo, Kenya’s contact point on AI.

      Munyalo said that while the adoption of the resolution is an important first step, UNEA must now move forward in future negotiations to address the “blind spots” and deliver stronger language and clearer commitments on lifecycle accountability.

      “Sustainability must be built into AI from extraction to disposal, otherwise we risk repeating the same patterns of inequity seen in earlier technological transitions,” she told Climate Home News.

      No direct finance expected

      As the negotiations reached mid-way point on Wednesday, the AI resolution was on the brink of collapse, essentially over finance, which Saudi Arabia and Iran insisted should primarily flow from developed to developing countries while the UK and the EU argued funding should come from all sources.

      Finally, countries landed on a compromise that avoids any obligation for wealthy nations to directly finance AI capacity in the Global South. All countries instead are encouraged to “enhance partnerships” that can mobilise funding, alongside “increased investment, including from the private sector and philanthropy” in AI that supports sustainable development.

      AI is finding greater uses in environmental circles, and in developing countries it is already being deployed, boosting funding needs. For example, Sierra Leone in its new NDC climate plan needs almost $7 million, including from donor countries, to build an AI-based climate and weather forecasting system to improve resilience. Also, in Kenya, AI is helping conservationists monitor forest degradation, launch reforestation and predict carbon storage capacity in new forest areas.

      Kenya’s Munyalo said most data centres are concentrated in developed countries while Africa lacks the expertise and finance to develop its own AI data systems. A lack of direct funding promises puts the burden back on developing countries and could undermine environmental projects like these, she added.

      The closing plenary at the UN Environment Assembly in Nairobi on 12 December, 2025.
      The closing plenary at the UN Environment Assembly in Nairobi on 12 December, 2025. (Photo: UNEP)

      AI good or bad for energy transition?

      Somya Joshi, research director at the Stockholm Environment Institute (SEI), said AI has critical impacts both for climate and biodiversity and needs to be designed in ways that don’t “replicate the same mistakes we made before with extractive technology transitions”.

      The debate going forward will need to be informed by science and the environmental impacts along the entire AI value chain, she said, including for water, electricity, critical minerals and rare earths to make semi-conductor chips, as well as pollution and what happens to AI systems at the end of their life.

      Joshi said there is a need to prevent growing power demand from AI to reinforce dependency on fossil fuels, which would undermine the clean energy transition.

      UN Secretary-General António Guterres earlier this year made a call for Big Tech to power all data centres with 100% renewables by 2030.

      Data centres accounted for about 1.5% of the world’s electricity consumption in 2024. But this figure is set to more than double by 2030 as tech giants continue to build out the infrastructure needed to support their power-hungry AI technologies.

      While renewable energy sources – combined with batteries – are expected to supply half of the additional electricity, increased demand from data centres will be a “significant” driver of growth for fossil gas and coal-fired generation until the end of this decade, according to the International Energy Agency (IEA).

      As the Paris Agreement turns 10, what has it achieved?

      Geopolitics limit Nairobi results

      The resolution on AI was largely seen by observers as a win for the UNEA, which played out in a tense political environment that limited steps forward on a range of key environmental issues.

      The US rejected the outcomes, decrying what it called “climate change theatre”, in line with the denial of climate science by the administration of President Donald Trump and his efforts to thwart climate action.

      Behind the scenes, oil-rich Saudi Arabia and Türkiye – host of the COP31 climate talks next year – pushed to water down wording on climate change including the science of melting glaciers.

      This rejection of well-established evidence elicited strong criticism from small island nations Fiji and Barbados, as well as the European Union and Australia, in the final session of the conference. Speaking at the closing plenary, the EU delegate said the bloc had arrived at UNEA-7 with high hopes for the environment and multilateralism but have to come to terms with the fact that the Assembly could only achieve good results in some resolutions “and less in others”.

      There was also disappointment over a weak resolution on mining and transition minerals, which agreed only on further talks around international co-operation instead of setting up an expert group to identify new instruments to make supply chains greener and more transparent as proposed by Colombia and Oman.

      However, fears that some member states would use UNEA as an opportunity to reopen the mandate to negotiate a global treaty on plastic pollution did not come to pass, according to Andrés del Castillo, Senior Attortney at the Center for International Environmental Law (CIEL).

      Talks on a new pact were suspended in August as they were unable to reach agreement with fossil fuel-producing countries blocking proposed caps on plastic production – a major market for petrochemicals. They will resume in February with the election of a new chair.

      Del Castillo pointed to the ministerial declaration adopted in Nairobi on Friday, which reaffirms countries’ “shared commitment to engaging constructively and actively, with a sense of urgency and solidarity, to conclude the [plastics] negotiations”.

      The post UN adopts first-ever resolution on AI and environment, but omits lifecycle appeared first on Climate Home News.

      UN adopts first-ever resolution on AI and environment, but omits lifecycle

      Continue Reading

      Trending

      Copyright © 2022 BreakingClimateChange.com