
Recent years have seen a rapid succession of climate-related records broken.
To name just a few, the world has witnessed record warmth in the Atlantic, unprecedented glacier melt, all-time low Antarctic sea ice extent, the Amazon’s worst drought since observations began and UK temperatures soaring past 40C for the first time.
In a review article, published in Nature Reviews Earth & Environment, my coauthors and I look at how the frequency of weather records is changing as the planet warms.
We find that the number of hot temperature records observed around the world since 1950 far exceed what would be expected in a million years in a world without human-caused climate change.
Specifically, we show that “all-time” daily hot records on land were more than four times higher in 2016-24 than they would have been in a world without climate change.
Meanwhile, daily maximum rainfall records were up 40% over the same time period and record cold events were twice as rare.
A key finding of our research is that it is the pace of global warming that controls the occurrence of records.
We show that, if the pace of warming were to slow down, the frequency of record-breaking hot events would start to decline – even if global temperatures continue to rise.
Counting records
By definition, records are supposed to be rare events, at least in a system that is not changing.
Statistics of record occurrence are remarkably simple. They are expected to become rarer the longer a measurement series gets.
The chance of observing a new record after 20 years of measurement is one in 20, or 5%. And after 100 years of observations, the chances of a new record drops to 1%.
For example, this is why it becomes increasingly difficult to break records in athletics as time goes by, unless training methods or sports equipment improve.
Record-breaking weather events – for example, the highest windspeed, most intense rainfall or hot and cold temperatures – also face these odds in a climate that is “stationary”.
However, today’s climate is not stationary, but warming at a very high pace. This has significant implications for the record count.
The plot below shows how the frequency of all-time hot records (dashed red line) and record cold events (dashed blue line) has changed since the 1960s. This is compared to the probability that would be expected under a stationary climate (black line).
(The plot uses ERA5, a reanalysis dataset, which combines observations and models from the European Centre for Medium-Range Weather Forecasts (ECMWF).)
It illustrates how the frequency of hot events declined more slowly than would be expected in a stationary climate since 1950, before increasing in the last 15 years. Meanwhile, the frequency of record cold events is declining more quickly than expected.

The record ratio
Tracking the ratio between the measured number of records and the one theoretically expected in a stationary climate – the “record ratio” – reveals the fingerprint of climate change.
Analysis of ERA5 data and Berkeley Earth surface temperature observations finds that the record ratio over the last decade for hot records over global land regions is more than four. For cold records, it is between 0.2 and 0.5, showing that record-breaking cold has declined
In other words, there were more than four times as many hot record events and less than half as many cold record events than would be expected without global warming.
In 2023 and 2024, the record ratio for hot events reached 5.5 and 6.2, respectively.
Record ratios tend to be higher over global oceans than on land. They are also higher for monthly or seasonal record temperatures than all-time daily records.
This is because natural variability in the climate tends to be smaller over oceans and for longer averaging periods, such as months and seasons.
Record counts directly relate to the relationship between rates of warming and natural fluctuations in the climate. This is sometimes referred to as the “signal-to-noise ratio”. (The “signal” being the long-term trend of climate change and “noise” referring to short-term fluctuations of natural variability.)
As a result, event types and regions with a higher signal-to-noise ratio tend to see a greater number of records.
Another way of illustrating the signal of climate change is by counting the total number of records in a measurement series.
In a stationary climate, there should be about five records in 100 years of temperature measurements, 7.5 in 1,000 years and less than 10 in 10,000 years.
However, our analysis of records in two measurement series shows how the number of record-breaking events has become significantly higher as the climate has changed.
For example, as the figure on the left below illustrates, a new annual record for average global temperature has been set 25 times over the past 175 years.
Meanwhile, the figure on the right shows how, in the Pacific north-west, a new five-day average heat record has been set 14 times within the last 75 years. The spike in temperature in 2021 reflects the brutal heatwave that killed hundreds of people and brought devastating wildfires that almost entirely destroyed the Canadian village of Lytton.
(In both figures, the warm records are marked by pink circles.)
According to fundamental laws of statistics, 14 new records would not be expected in more than a million years in a climate that is not warming.

It is worth noting that some climate variables, including ocean heat content, sea level rise and minimum glacier or ice sheet volumes, are changing so relentlessly that new record levels are currently set every year.
Record-shattering events
Record-shattering events are a subset of record-breaking events whose magnitude exceeds the previous event by a large margin.
In our research, we define this as more than one standard deviation, which is a measure of how spread out data is from the average.
(The exact value of standard deviation varies for different parts of the world. For example, when it comes to year-to-year average temperatures, one standard deviation is typically 2-3C in the Arctic, but less than 0.5C over the ocean).
These events of unprecedented intensity are often very impactful as they strongly exceed the conditions that society or ecosystems have experienced in the past.
The 2021 heatwave in the Pacific north-west, mentioned above, is a forbidding example.
Our research finds that the large number of record-shattering events in the past three decades is the consequence of a very high warming rate.
Using a simple timeseries model, we illustrate why the pace of warming is the key factor explaining the occurrence of record-shattering events.
In the left-hand figure, we assume a 150-year period of no warming followed by some linear warming at three different rates, which is a very simplistic approximation of historical and future warming pathways.
The right-hand figure illustrates what happens to the probability of record-shattering events in the Pacific north-west region under these three simplified pathways. It shows that the probability of record-shattering events at first rapidly increases and then stabilises. And the level at which the probability stabilises is greater the higher the rate of warming.
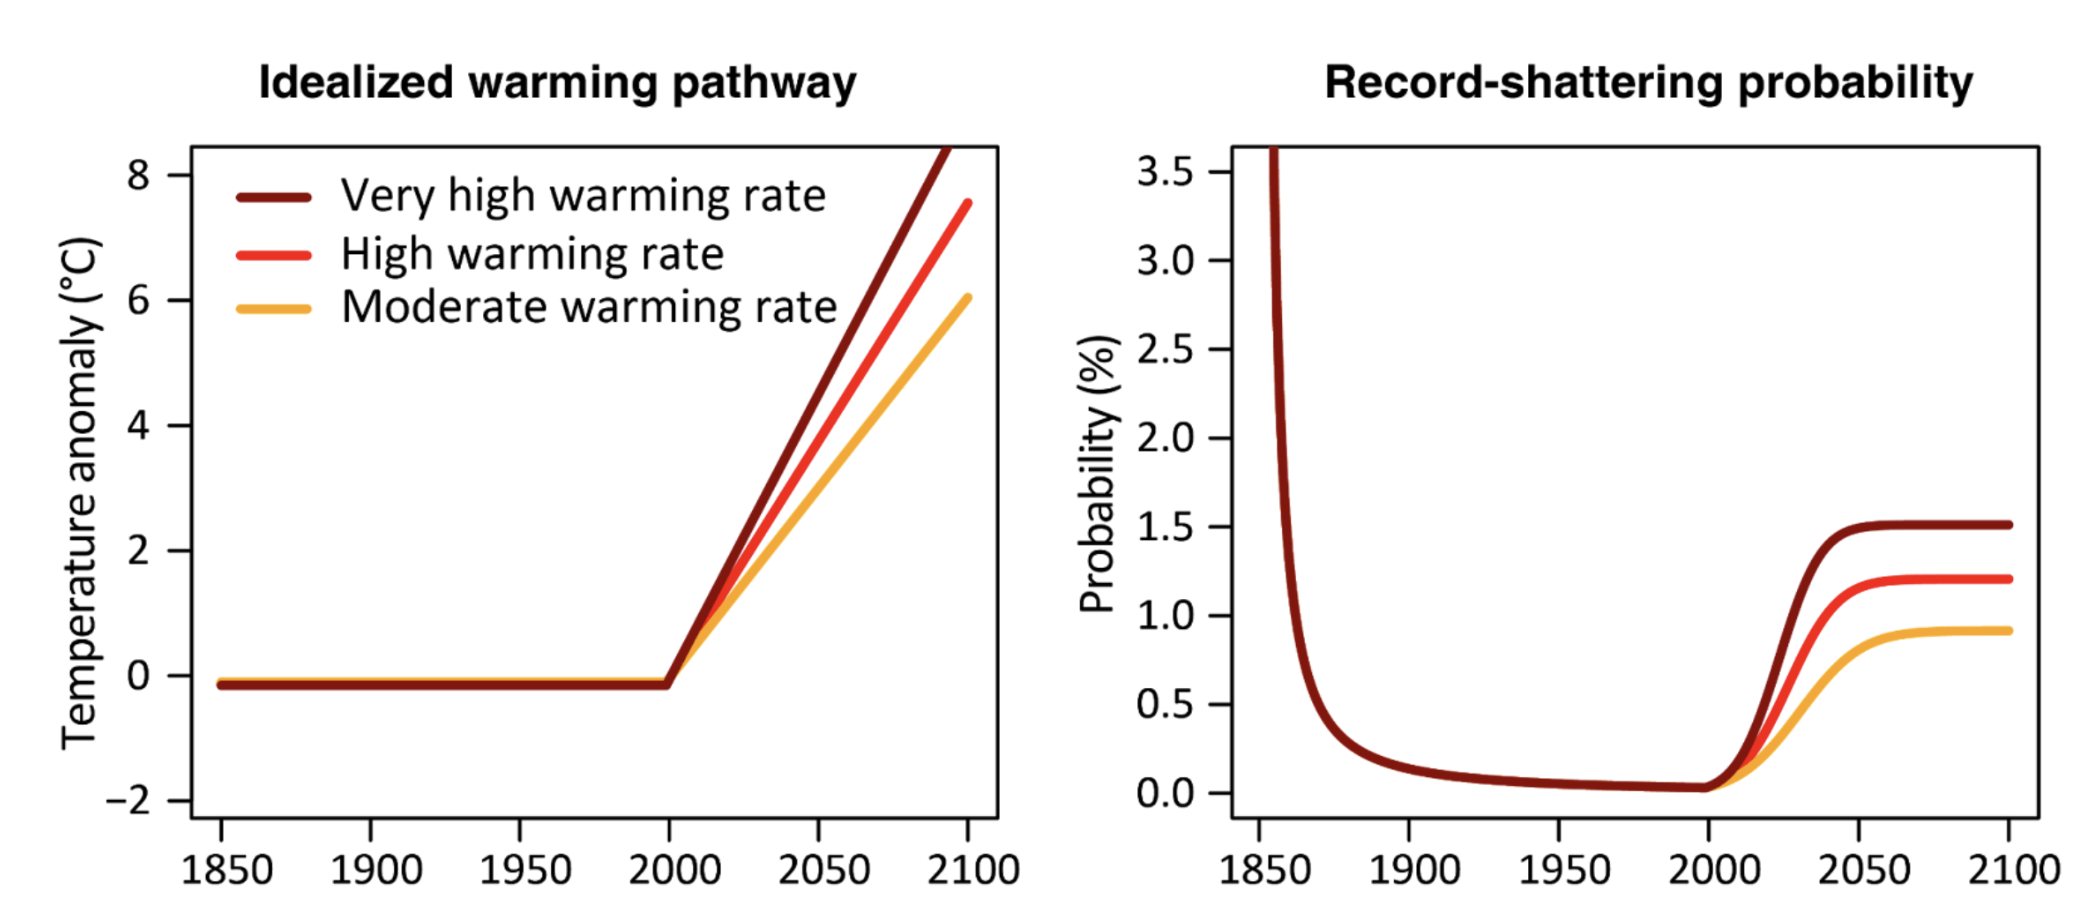
We therefore conclude that the high frequency of record-shattering hot extremes in recent years is controlled by the very high rate of warming caused by human-caused greenhouse gas emissions.
This tight coupling of record counts to the rate or speed of warming implies that there will be early benefits of slowing down global warming.
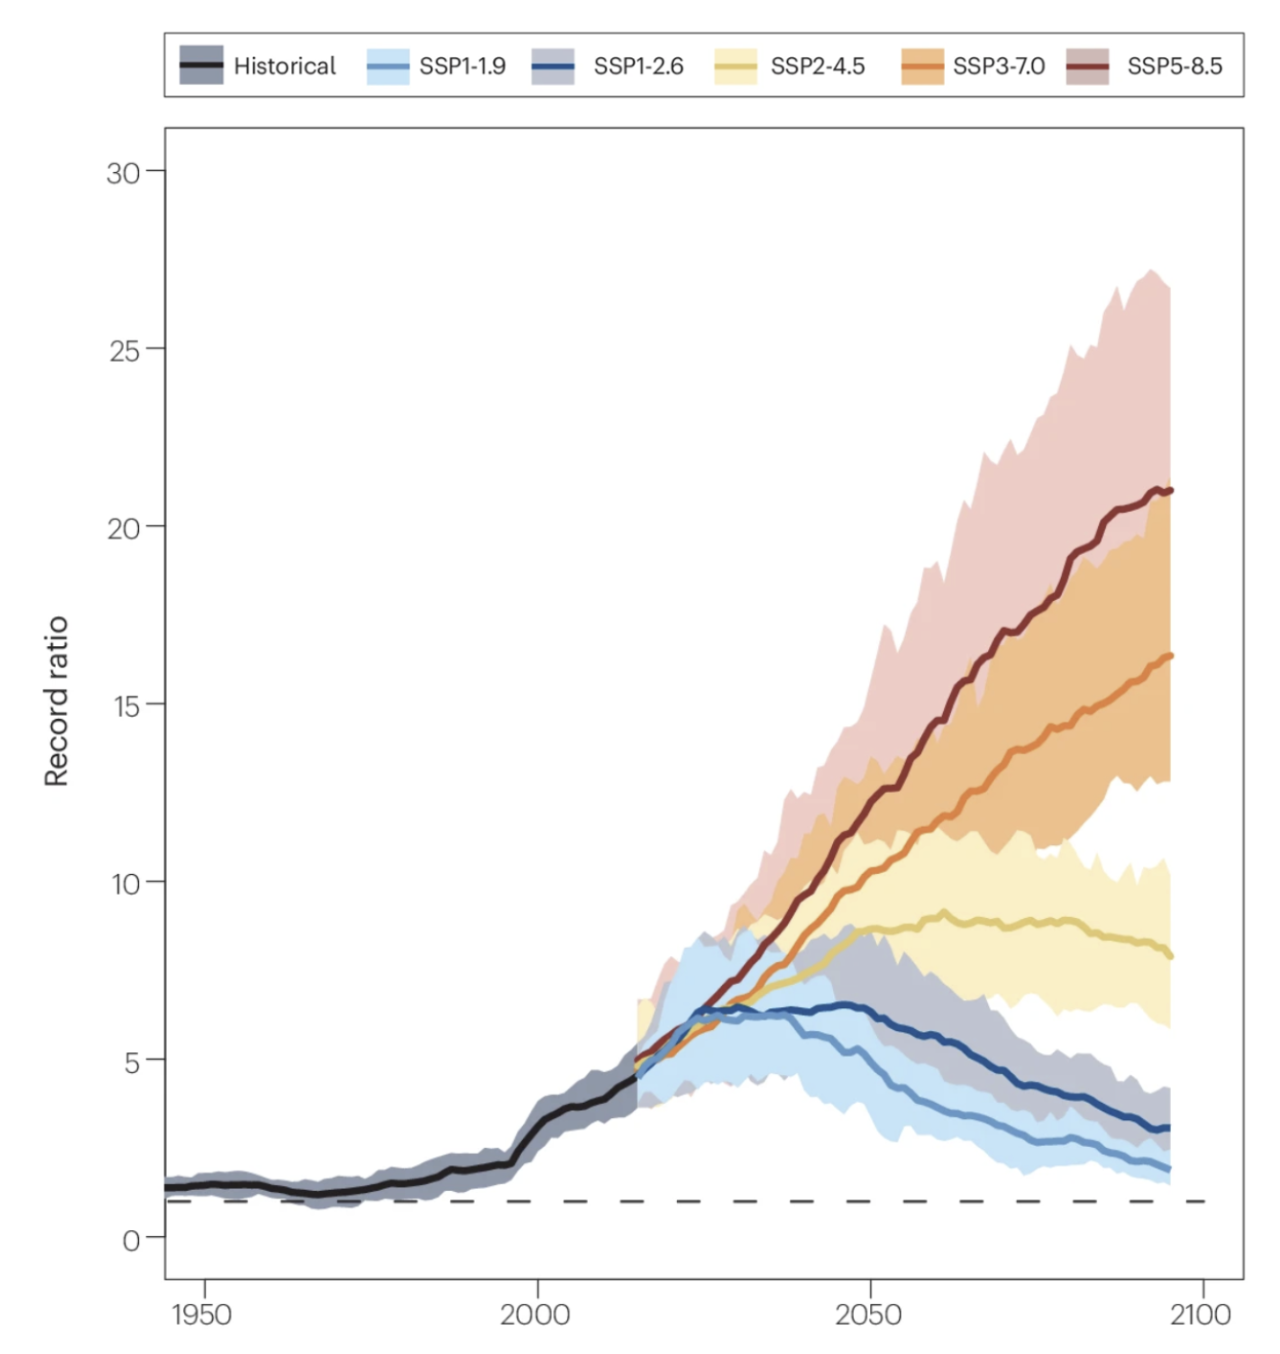
In our research, we look at how the probability of hot and cold records changes under different emissions reduction scenarios. To do this, we analysed the occurrence of record hot and cold events in climate model projections in the CMIP6 archive.
The figure below shows how stabilising temperatures by achieving net-zero carbon emissions (SSP1-1.9 and SSP1-2.6) will lead to a rapid decline of records, even if temperatures remain higher than in the historical period.
(It is worth noting that, while the number of records will decline under this lower-emissions scenario, the number of heatwaves would remain higher than today.)
Under intermediate (SSP2-4.5), high (SSP3-7.0) and very high emission (SSP5-8.5) scenarios, the number of records would continue to increase to levels much higher than today.
Rainfall records
We would also expect rainfall records to become progressively rarer in a stationary climate.
However, we find that record-breaking heavy precipitation occurred about 40% more often in 2015-24 than would be expected in a stationary climate. Many record-shattering heavy rainfall extremes occurred in the mid-latitudes and led to flooding which had large impacts.
(Calculating the frequency of records is more challenging for rainfall than for temperature, given small-scale variations and uncertainties in rainfall observations.)
The greater number of record-breaking rainfall events is due to an increase in precipitation intensity over most land regions as the atmosphere warms, as well as larger variations of rainfall intensity on a day-to-day, season-to-season and year-to-year basis .
We also find that the margin by which previous rainfall records are broken tends to become larger and larger in time. This is due to the “non-symmetric” distribution of rainfall – where there are many days with little precipitation, less with heavy precipitation and very few with very extreme precipitation.
It is therefore not surprising to see record-shattering precipitation events exceeding previous records by 20-50% in intensity, even if overall precipitation intensity increases by roughly 7% per degree of warming.
Preparing for the future
Efforts to adapt to climate change are typically informed by the worst events observed in recent generations.
This means that society is often underprepared for record-shattering events – which by their very definition are of unprecedented intensity.
Qualitative and quantitative storyline methods can offer insight into the many record-breaking events to come into the future – and, thus, help society prepare for escalating climate impacts.
These methods combine information from historical and paleoarchives, long measurement series, targeted climate model experiments, statistical and machine learning methods and weather forecasting systems.
Ultimately, these methods can improve society’s preparedness to climate change, so that the next record-shattering extreme does not come as a surprise.


The post Guest post: How climate change is fuelling record-breaking extreme weather appeared first on Carbon Brief.
Guest post: How climate change is fuelling record-breaking extreme weather
Climate Change
As Storms Pummel Hawaii, the Western U.S. Continues to Bake Amid Record-Breaking Heat Wave
Unusually high March temperatures are shattering records out West—and the heat wave isn’t over yet.
Communities across the Western United States are in for another week of unusually high temperatures amid an ongoing and historic early-season heat wave. It has broken March temperature records in nearly 180 cities, including Phoenix, which hit 105 degrees Fahrenheit last Thursday.
As Storms Pummel Hawaii, the Western U.S. Continues to Bake Amid Record-Breaking Heat Wave
At CERAWeek, Energy Secretary Chris Wright urges a patriotic surge in oil production, but industry titans warn that the U.S.-Iran war has fractured the global energy map beyond the reach of a quick fix.
Energy Secretary Chris Wright, a long-time apostle of fossil fuel expansion, issued a blunt directive to the world’s largest oil and gas producers on Monday: Produce more, and do it now.
White House’s ‘Drill Baby Drill’ Wartime Mandate Meets Volatile Market Reality
In recent years, the monsoon season in Pakistan has taken a new and dangerous turn.
July and August typically bring high levels of rainfall across the country, and while flooding isn’t uncommon, the extent and severity could be readily predicted.
These patterns have now changed. In 2022, extreme rainfall swept Pakistan and huge swathes of the country were under water. Sindh province experienced levels of rain 508% above average for the time of year.
Extreme weather in Pakistan is becoming the norm. The past 15 years have brought widespread flooding, loss of life and billions in financial costs. A post-disaster report, produced by the Pakistan Government, stated that the 2022 floods were “a wake-up call for systemic changes to address the underlying vulnerabilities to natural hazards”, citing the country’s lack of climate-resilient infrastructure.
But heavy rainfall is only one of the water-related issues that Pakistan faces. In a country with huge geographical diversity, from sweltering deserts to freezing mountain tops, the water stresses are equally as varied. In many regions the key concern is a lack of reliable, clean water that can be used to grow crops and feed families.
We must invest in early warning systems to tackle crises like Kenya’s drought
The risks of the Indus
The Indus River plays a critical role in Pakistan. This major artery travels almost the entire length of the country, an estimated 2,000 km, from the Himalayas to the Arabian Sea. It is a crucial economic lever, supporting nearly 90% of Pakistan’s food production and 25% of its overall GDP. What happens to this river – both human and natural impacts – has huge consequences for the rest of the country.
The government and civil society agree that urgent action is required to protect Pakistan’s fragile water resources. A new adaptation project – SAFER Pakistan – is seeking to address these concerns with solutions that can be used to solve similar climate-related issues elsewhere.
The US$ 10 million project is led by ICIMOD, an intergovernmental research centre, alongside UNICEF, and financed by the Adaptation Fund. The intention is to tackle six key issues that people face in the Indus Basin: cryosphere risks, drying springs, groundwater, pollution, unsustainable water use, and community resilience.
In practice this means exploring different solutions that put communities in control of their own adaptive capacity. One solution under development is the use of community early warning systems.
Pakistan’s ‘monster disaster’ brings climate compensation into focus
A warning sign
According to researchers, early warning systems “aim to empower affected communities against hazards and help them to sufficiently prepare before disasters strike.”
The northern provinces of Pakistan – Gilgit-Baltistan and Khyber Pakhtunkhwa – are the main focus for testing these systems. In this mountainous region the Indus is fed by thousands of glaciers which sustain water flow during the dry season. At the same time, increased temperatures and unpredictable weather patterns are changing how these glaciers behave, leading to avalanches, increased snowmelt, and landslides.
As glaciers start to melt due to climate change, they can form large lakes high up on the mountain that can pose a serious threat to the communities living below. When these natural dams fail, huge quantities of water come careening down the mountain, a phenomenon called glacial lake outburst flood.
The SAFER project is exploring how to use local knowledge and observations of the mountain to ensure people know how and when to evacuate when these outbursts occur. This human intelligence will be combined with data from remote sensors to save lives and livelihoods. In total, over 435,000 people will be impacted by the project.
“Early warning systems often serve as the backbone of a multi-faceted response to reduce climate disaster risk,” commented Mikko Ollikainen, head of the Adaptation Fund. “But local information is often just as valuable as the real-time data you receive from sensors or satellites,” he added.
Climate disasters challenge right to safe and adequate housing
Shaping an effective response
Community early warning systems – together with other preventive adaptation measures – are proving a popular solution to extreme weather events.
A separate adaptation project in the mountains of Central Asia is grappling with the same problem of glacial flooding. In this case, with US$6.5 million in funding from the Adaptation Fund, UNESCO has been implementing early warning systems across Kazakhstan, Kyrgyzstan, Tajikistan and Uzbekistan for the past five years, with considerable success.
Diana Aripkhanova, a project officer at UNESCO, and based in Kazakhstan, told Climate Home that glacier lake outburst floods “represent an increasing climate-related hazard across the high mountain regions of Central Asia”.
“These events can trigger destructive floods and debris flows that affect downstream communities, infrastructure, and livelihoods,” she added.
The project utilises real-time data drawn from weather monitoring stations with community preparedness to shape a fast and effective response to life-threatening flooding. This includes training people on evacuation routes, safe locations and simulation drills. In addition, the project has tried preventative measures such as planting hundreds of trees in valleys prone to landslides to provide greater stabilisation.
In total, four early warning systems have been installed across the four countries involved in the project covering seven high-risk areas. As a result, UNESCO estimates these systems are protecting over 100,000 people.
“Early warning systems are a key risk reduction measure, allowing communities to evacuate in time and reduce potential loss of life and damage to assets,” added Aripkhanova.
Community participation
The active role of each community is built into these interventions. Ensuring local people are core contributors is seen as crucial to building long-term climate resilience.
These communities are witnessing the threats from climate change materialise on a yearly basis, and researchers are now tapping into that understanding when implementing adaptation projects.
After the 2022 floods, Pakistan’s development minister, Ahsan Iqbal, wrote that “there is an opportunity to do things differently” and that “enhancing Pakistan’s resilience to shocks and stresses amidst climate change, especially for the poorest…is essential for the country’s future.”
The climate shocks remain as strong as ever, but using the right tools and simple solutions can soften the blow when they occur.
Adam Wentworth is a freelancer writer based in Brighton, UK
The post Early warning systems are saving lives in Central Asia appeared first on Climate Home News.


-
Climate Change7 months ago
Guest post: Why China is still building new coal – and when it might stop
-
Greenhouse Gases7 months ago
Guest post: Why China is still building new coal – and when it might stop
-

 Greenhouse Gases2 years ago
嘉宾来稿:满足中国增长的用电需求 光伏加储能“比新建煤电更实惠”
-
Climate Change2 years ago
Bill Discounting Climate Change in Florida’s Energy Policy Awaits DeSantis’ Approval
-

 Climate Change2 years ago
嘉宾来稿:满足中国增长的用电需求 光伏加储能“比新建煤电更实惠”
-
Climate Change Videos2 years ago
The toxic gas flares fuelling Nigeria’s climate change – BBC News
-

 Carbon Footprint2 years ago
US SEC’s Climate Disclosure Rules Spur Renewed Interest in Carbon Credits
-

 Renewable Energy5 months ago
Sending Progressive Philanthropist George Soros to Prison?