Connect with us

Published

on

Every six to seven years, climate modelling groups around the world run a coordinated set of simulations that explore how the climate could change in the future.

These simulations form a key line of evidence for future projections used in Intergovernmental Panel on Climate Change (IPCC) assessment reports.

They are built around a set of common scenarios – or “pathways” – of future greenhouse gas emissions.

A new set of scenarios has now been published for the seventh phase of the Coupled Model Intercomparison Project (CMIP7).

These replace the “shared socioeconomic pathways” (SSPs) that drove the previous generation of climate models and featured heavily in the IPCC’s sixth assessment report (AR6).

The new scenarios are quite different from their predecessors in a number of notable ways.

Rather than being named, somewhat enigmatically, according to their “radiative forcing levels”, the new scenarios are named simply by their emissions trajectories – ranging from “low-to-negative” to “high”.

They no longer consider “no-climate-policy” baseline worlds, but instead explore the implications of current policies continuing, being strengthened, or weakening.

These new scenarios also dramatically revise high-end future emissions downward, far below the highest scenarios in prior generations, in order to reflect a world where a 21st century dominated by coal use is no longer plausible.

At the same time, they revise the lowest emissions scenarios upwards relative to those featured in the AR6, with at least some “overshoot” of the Paris Agreement’s “aspirational” target to limit global warming to 1.5C now “unavoidable”.

While modelling groups are just getting started on the full Earth-system model simulations, the emissions scenarios give a clear picture of the range of futures that will inform the IPCC’s seventh assessment cycle (AR7).

Here, Carbon Brief unpacks how the new scenarios were designed and how they differ from the SSPs published almost a decade ago.

The article also compares CO2 emissions and warming outcomes between the new scenarios and their predecessors, explores the range of future warming outcomes and examines why the high end of the scenario range has shifted markedly downward.

Finally, Carbon Brief examines the scale of carbon dioxide removal (CDR) built into the scenarios and new extensions of scenarios to 2150 and beyond.

Key highlights from Carbon Brief’s analysis of the new scenarios include:

  • The seven new scenarios give a range of global warming in 2100 from 1.6C to 3.3C above pre-industrial levels – markedly narrower than the 1.5C to 4.7C range in their SSP predecessors.
  • The top of the scenario range has fallen for the first time in four generations of climate modelling. The highest scenarios used in the three previous IPCC assessment cycles all produced around 4.6-4.9C of global warming in 2100, whereas CMIP7’s high scenario only reaches 3.3C and has around half the cumulative CO2 emissions.
  • The new “medium” scenario that is analogous to policies in place today reaches 2.9C in 2100, crossing 2C around 2050 and 3C around 2110, with a one-in-four chance of exceeding 4C by 2150.
  • The lowest scenarios have shifted modestly upwards, as a future that avoids any overshoot of 1.5C is no longer considered plausible. The very-low scenario peaks at around 1.8C mid-century before falling back close to 1.5C by 2100.
  • The updated socioeconomic assumptions underpinning the new scenarios describe a more crowded and less wealthy planet than the original SSPs, with the global human population now peaking at 10.1bn people around 2080 in the medium pathway and income per person in 2100 between 10% and 25% lower.
  • Every scenario that limits warming leans heavily on carbon dioxide removal, with cumulative removals by 2150 ranging from 655GtCO2 in the very-low scenario to 2,360GtCO2 in low-to-negative scenario.

Article sections

Article Contents

A new generation of scenarios

To simulate how human activity could shape the climate of the future, climate modellers must estimate future levels of “radiative forcings” – the external drivers that cause global warming. These include atmospheric concentrations of greenhouse gases, air pollutants and land-use changes.

Given that no one knows how the future will unfold, modellers use a handful of scenarios that span a wide range of plausible outcomes.

The Scenario Model Intercomparison Project (ScenarioMIP) coordinates the development and running of emissions scenarios for climate models used in IPCC reports.

In April 2026, high-level details about the new set of scenarios for CMIP7 were published in the journal Geoscientific Model Development (GMD).

On 1 September, the underlying emissions data was released into the public domain by the ScenarioMIP team.

There are seven new CMIP7 scenarios designed to drive model simulations for AR7. The first model runs took place in spring 2026 and initial results are expected later this year.

The previous SSP scenarios were starting to show their age. Finalised in 2015-17 using historical data ending in 2015, several years projected by the SSP scenarios were already in the past by the time AR6 concluded in 2021. Meanwhile, the world had changed considerably.

(For a full guide to the SSPs, see Carbon Brief‘s 2018 explainer.)

Storylines and emissions levels

The most visible change in the new generation of scenarios is their names. Where the SSPs combined five socioeconomic “storylines” with radiative forcing targets (SSP1-2.6, SSP5-8.5, etc), the CMIP7 scenarios are named simply for the emissions trajectory that they follow.

The table below summarises the seven scenarios and the integrated assessment model (IAM) that produced each “marker” run – in other words, the specific IAM run used to generate the scenario that, in turn, will be used by CMIP7 climate models. IAMs run simulations of how the future energy system and emissions may evolve under different assumptions around socioeconomics, future technology costs and climate policy.

The table below also details how the scenario fares against a number of key metrics assessed by Carbon Brief, including CO2 emissions and warming outcomes.

(For more on Carbon Brief’s approach, see: Methodology.).

Scenario Marker IAM Underlying SSP Emissions pathway Net CO2 in 2100 (GtCO2/yr) Cumulative CO2, 2024-2100 (GtCO2) Warming in 2100 (C vs 1850-1900)
High (H) GCAM 8s SSP3 Emissions as high as plausible with policy rollback 55 3,820 3.3 (2.6-4.4)
High-to-low (HL) WITCH 6.0 SSP5 High to mid-century, then net-zero CO2 by 2100 -1 2,566 2.8 (2.1-4.0)
Medium (M) IMAGE 3.4 SSP2 Current policies frozen at 2025 levels 34 2,814 2.9 (2.2-3.9)
Medium-low (ML) COFFEE 1.6 SSP2 Medium until 2040, then decline to net-zero CO2 by 2100 -9 1,757 2.3 (1.7-3.3)
Low (L) MESSAGEix-GLOBIOM 2.1 SSP2 Aims to keep warming likely below 2C -9 673 1.8 (1.3-2.7)
Very-low (VL) REMIND-MAgPIE 3.5-4.11 SSP1 1.5C with as little overshoot as plausible -6 310 1.6 (1.1-2.5)
Low-to-negative (LN) AIM 3.0 SSP2 1.5C with higher overshoot, then net-negative greenhouse gases -25 384 1.7 (1.2-2.5)

Warming values are medians (with the 5-95% range) from the 841-member FaIR ensemble used in this article (see: Methodology); the marker model assignments come from the ScenarioMIP database. Note that scenario names in the database differ from the official CMIP7 names (for example, the high-to-low scenario appears as “SSP5 – Medium-Low Emissions_a”).

Each of the new scenarios is built on a set of updated SSP storylines similar to those used in the original SSP scenarios. These include assumptions about future population, technological and economic growth, as well as potential for international cooperation that shape the resulting emissions pathways. The socioeconomic assumptions underlying these revised SSPs were updated in 2024 with new population and economic projections.

Most of the new emissions scenarios are now based on the “middle-of-the-road” SSP2 that assumes current socioeconomic trends broadly continue, with only one scenario using each of SSP1 (“sustainability”), SSP3 (“regional rivalry”) and SSP5 (“fossil-fuelled development”). None of the new scenarios uses SSP4 (“inequality”).

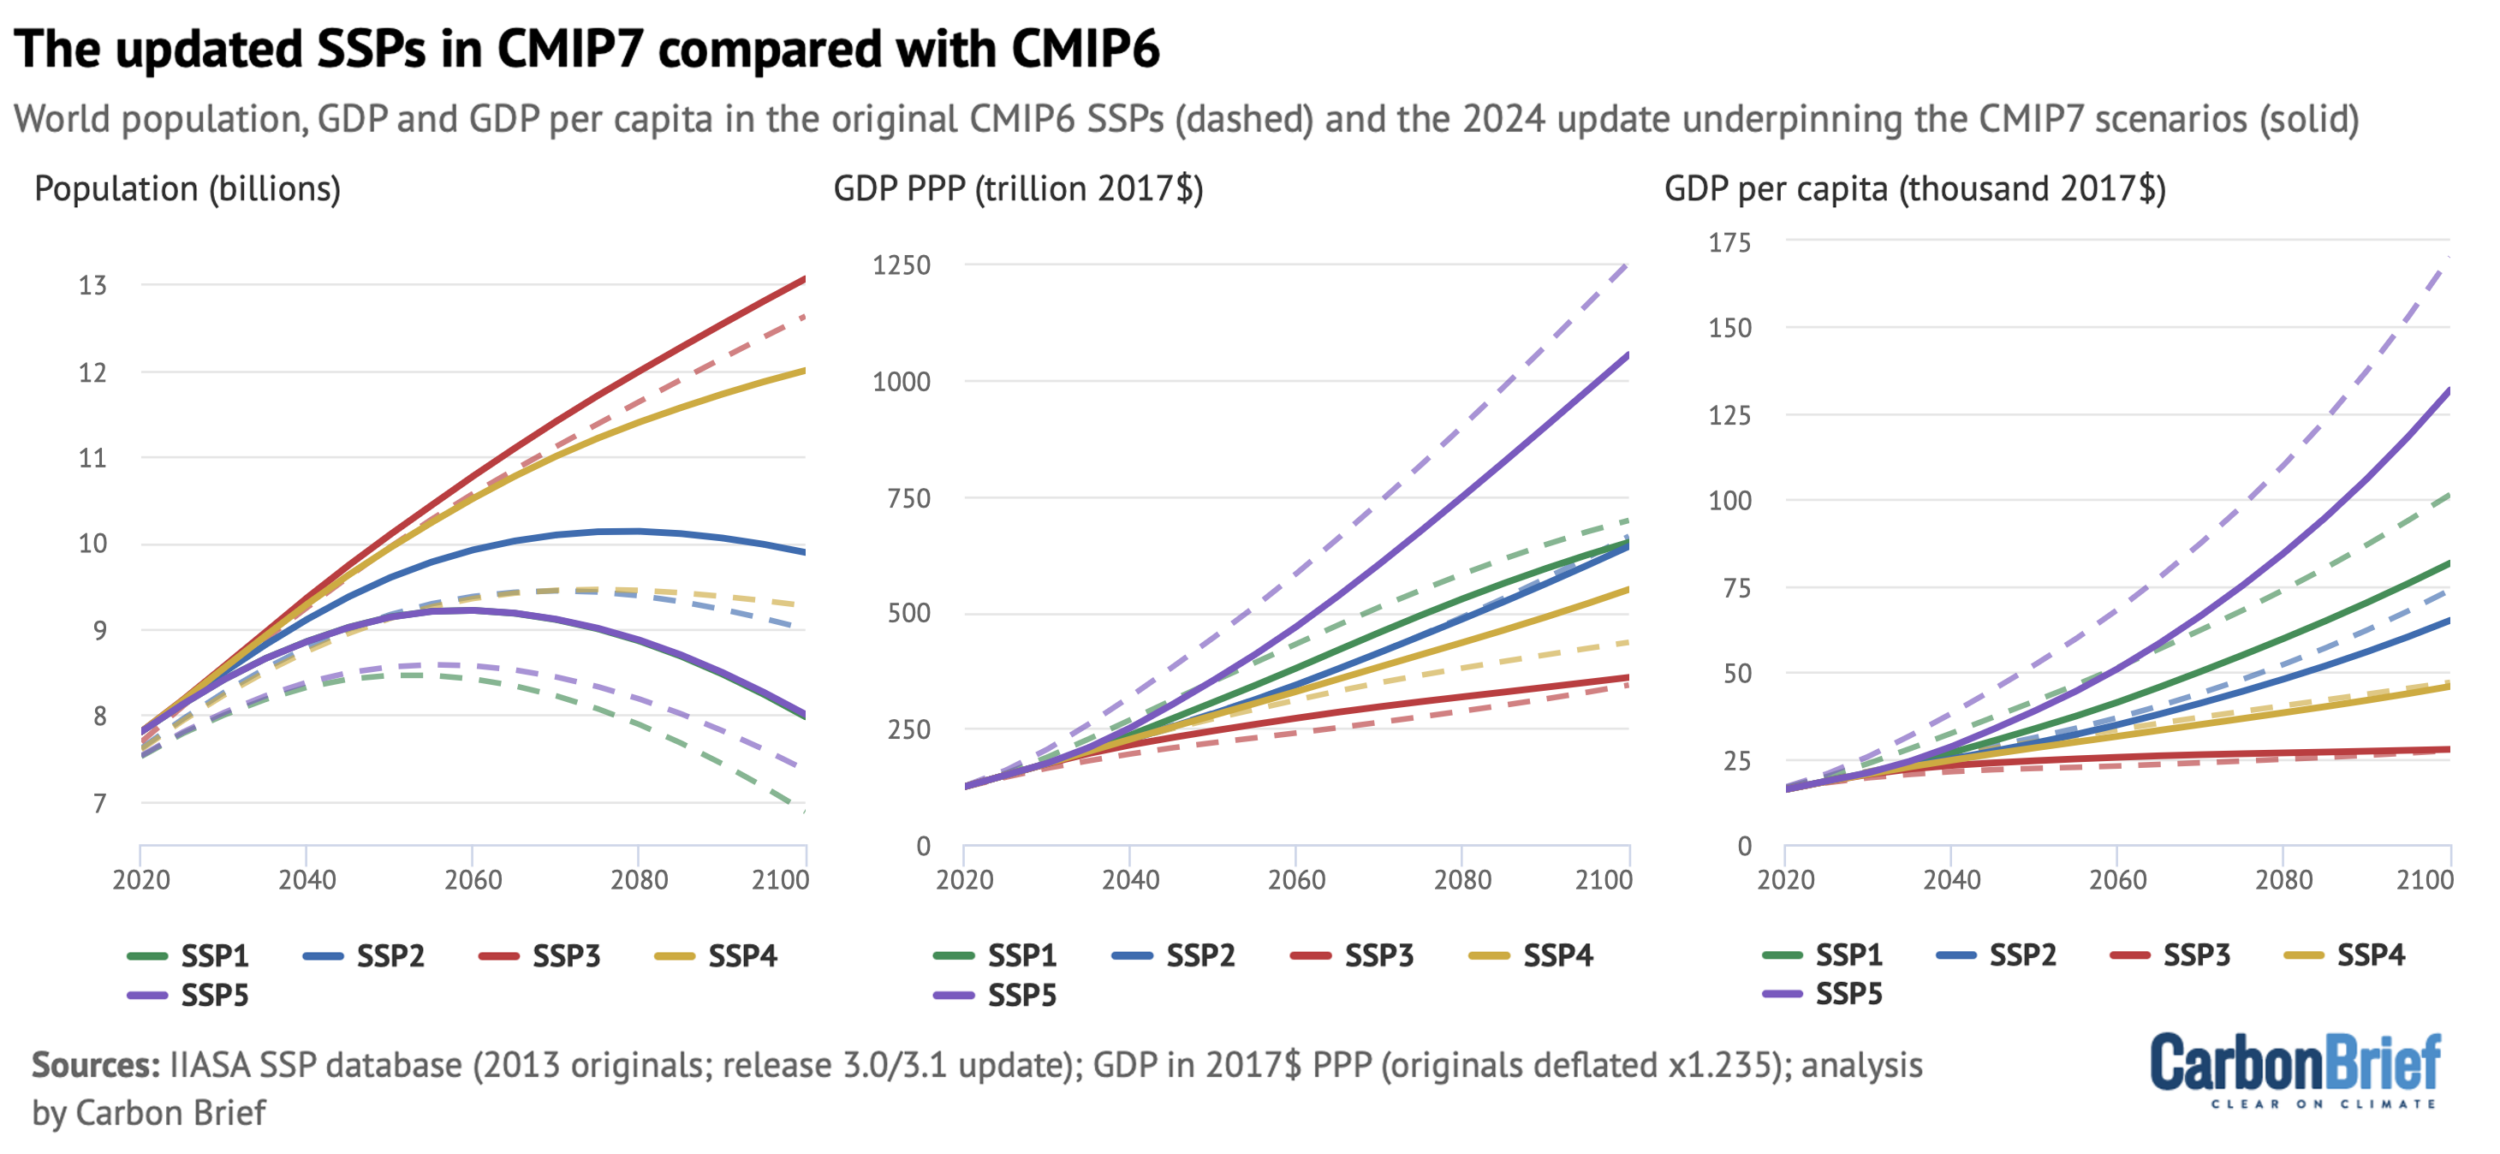
The solid lines in the figure below show updated global human population, GDP and GDP per capita values in CMIP7 (solid lines), compared to the original SSPs from CMIP’s sixth phase (CMIP6), shown by the dashed lines.

The updated SSPs in CMIP7 compared with CMIP6. Chart shows the world population, GDP and GDP per capita in the original CMIP6 SSPs and the 2024 update underpinning the CMIP7 scenarios.
World population (left), GDP (centre) and GDP per capita (right) for SSPs 1-5 in the original 2013-era SSP database (dashed) and the 2024 update (solid). Note that the updated SSP1 and SSP5 population curves effectively overlap. GDP is shown in 2017 US dollars PPP, with the original converted from 2005 US dollars using the US GDP deflator (x1.235). Data from the IIASA SSP database; chart by Carbon Brief.

The change in socioeconomic assumptions is substantial. Global population was revised upward in nearly every scenario, with the updated SSP2 projecting there will be 9.9 billion people in 2100 – an increase of 1 billion people compared to the 2013-era SSP.

GDP was revised downward in the high-end growth scenarios (SSP1 and SSP5), slightly upward in SSP3 and SSP4 and was largely unchanged in SS2.

The combination of these changes means that income per person in 2100 is around 10-25% lower in most scenarios, with only SSP3 and SSP4 seeing mostly unchanged income per capita.

In short, the socioeconomic world underlying the new scenarios is somewhat more crowded and less wealthy per person than the one the SSPs originally imagined.

Another notable change is the shift in the SSP that underlies the highest future emissions scenario.

In the original SSPs, the “very high” SSP5-8.5 scenario was based on SSP5, while the new “high” scenario in CMIP7 is based on SSP3.

The GMD study explains that this is because IAM teams that developed the scenarios found that SSP3 and SSP5 variants produced similar emissions. They judged that the “fragmented” SSP3 world – which is characterised by large challenges to adaptation – to be more relevant for exploring high-end risks.

No more ‘baseline’ scenarios and other changes

In another important change, the authors of the CMIP7 scenarios decided to eliminate “baseline” scenarios that assumed a world without any climate policy. These scenarios were previously used as a counterfactual against which to compare climate-changed worlds.

Instead, the range of future emissions scenarios starts with current policies and explores ways that they could be strengthened, weakened, or kept the same. The high scenario explores a plausible “rollback of current mitigation policies“.

The medium scenario, by contrast, extends climate policies officially implemented as of 2025, without assuming countries achieve their Paris Agreement pledges – known as nationally determined contributions (NDCs) – or net-zero targets that are not yet backed by legislation.

In their GMD paper, the authors of the CMIP7 scenarios emphasise that the medium scenario “should not be considered as a ‘most likely’ scenario”, but that it can provide a benchmark against which the effect of future policy strengthening or weakening can be measured. It is roughly analogous in its emissions levels to the old SSP2-4.5 scenario.

The new low scenario explores a world where climate policy is rapidly strengthened and warming by 2100 is limited to below 2C. This makes it analogous to the old SSP1-2.6 scenario.

The very-low scenario limits global warming to around 1.5C by 2100, similar to the old SSP1-1.9 scenario. However, it involves a greater degree of overshoot mid-century, reflecting the fact that global emissions did not begin to rapidly decline in 2020 as envisioned by SSP1-1.9. As the authors of the GMD ScenarioMIP paper point out: “At this point of time, some overshoot of the 1.5C seems unavoidable.”

In addition, there are a number of scenarios that start on one path before undertaking rapid mitigation. These high-to-low, medium-to-low and low-to-negative scenarios are intended to explore futures where mitigation is further delayed, followed by a rapid turn-around later in the century.

The scenario developers noted that there is no specific likelihood or probabilities assigned to any scenario, but rather only a judgement that all are within the realm of plausibility given where the world is today. They also said that “there might be potential futures outside the ScenarioMIP scenario range”.

Timescales and other changes

In addition to the shift away from baseline scenarios, there are three other notable design changes made in CMIP7.

First, CMIP7 models will be driven by emissions of CO2 and other greenhouse gases, rather than set atmospheric concentrations.

In every previous generation of models, the ScenarioMIP experiments required that modelling groups simulate future climate using the same set of CO2 concentrations. For CMIP7, models with an interactive carbon cycle are asked to run in “emissions-driven” mode for CO2, calculating atmospheric concentrations themselves based on emissions.

This is a significant improvement. It means that the substantial uncertainty in carbon-cycle feedbacks will now show up directly in the range of projected warming, rather than being overlooked. (The change applies to CO2 only; methane, nitrous oxide and halocarbons remain prescribed as concentrations.)

Second, emissions match observations up to 2023. IAM modellers were asked to stay close to observed trends up to 2025 to avoid emissions diverging from reality before models were run. Scenario differences only open up after 2026, avoiding an earlier problem of scenarios diverging from reality years before the models were even run.

Finally, the period over which models are being run has been extended from 2100 to 2150. This is important as the world is already more than a quarter of the way through the 21st century.

The extended model runs out to 2150 will provide a more thorough exploration of the warming that people born in the coming decades may experience within their lifetimes.

In addition, all scenarios have extensions to 2500 where temperatures are eventually stabilised. These allow scientists to explore changes to long-term Earth-system processes, such as ice sheets and sea level, as well as whether warming is reversible.

A narrower range of future CO2 emissions

Overall, the new scenarios provide a notably more narrow range of future CO2 emissions than the SSP scenarios used in CMIP6.

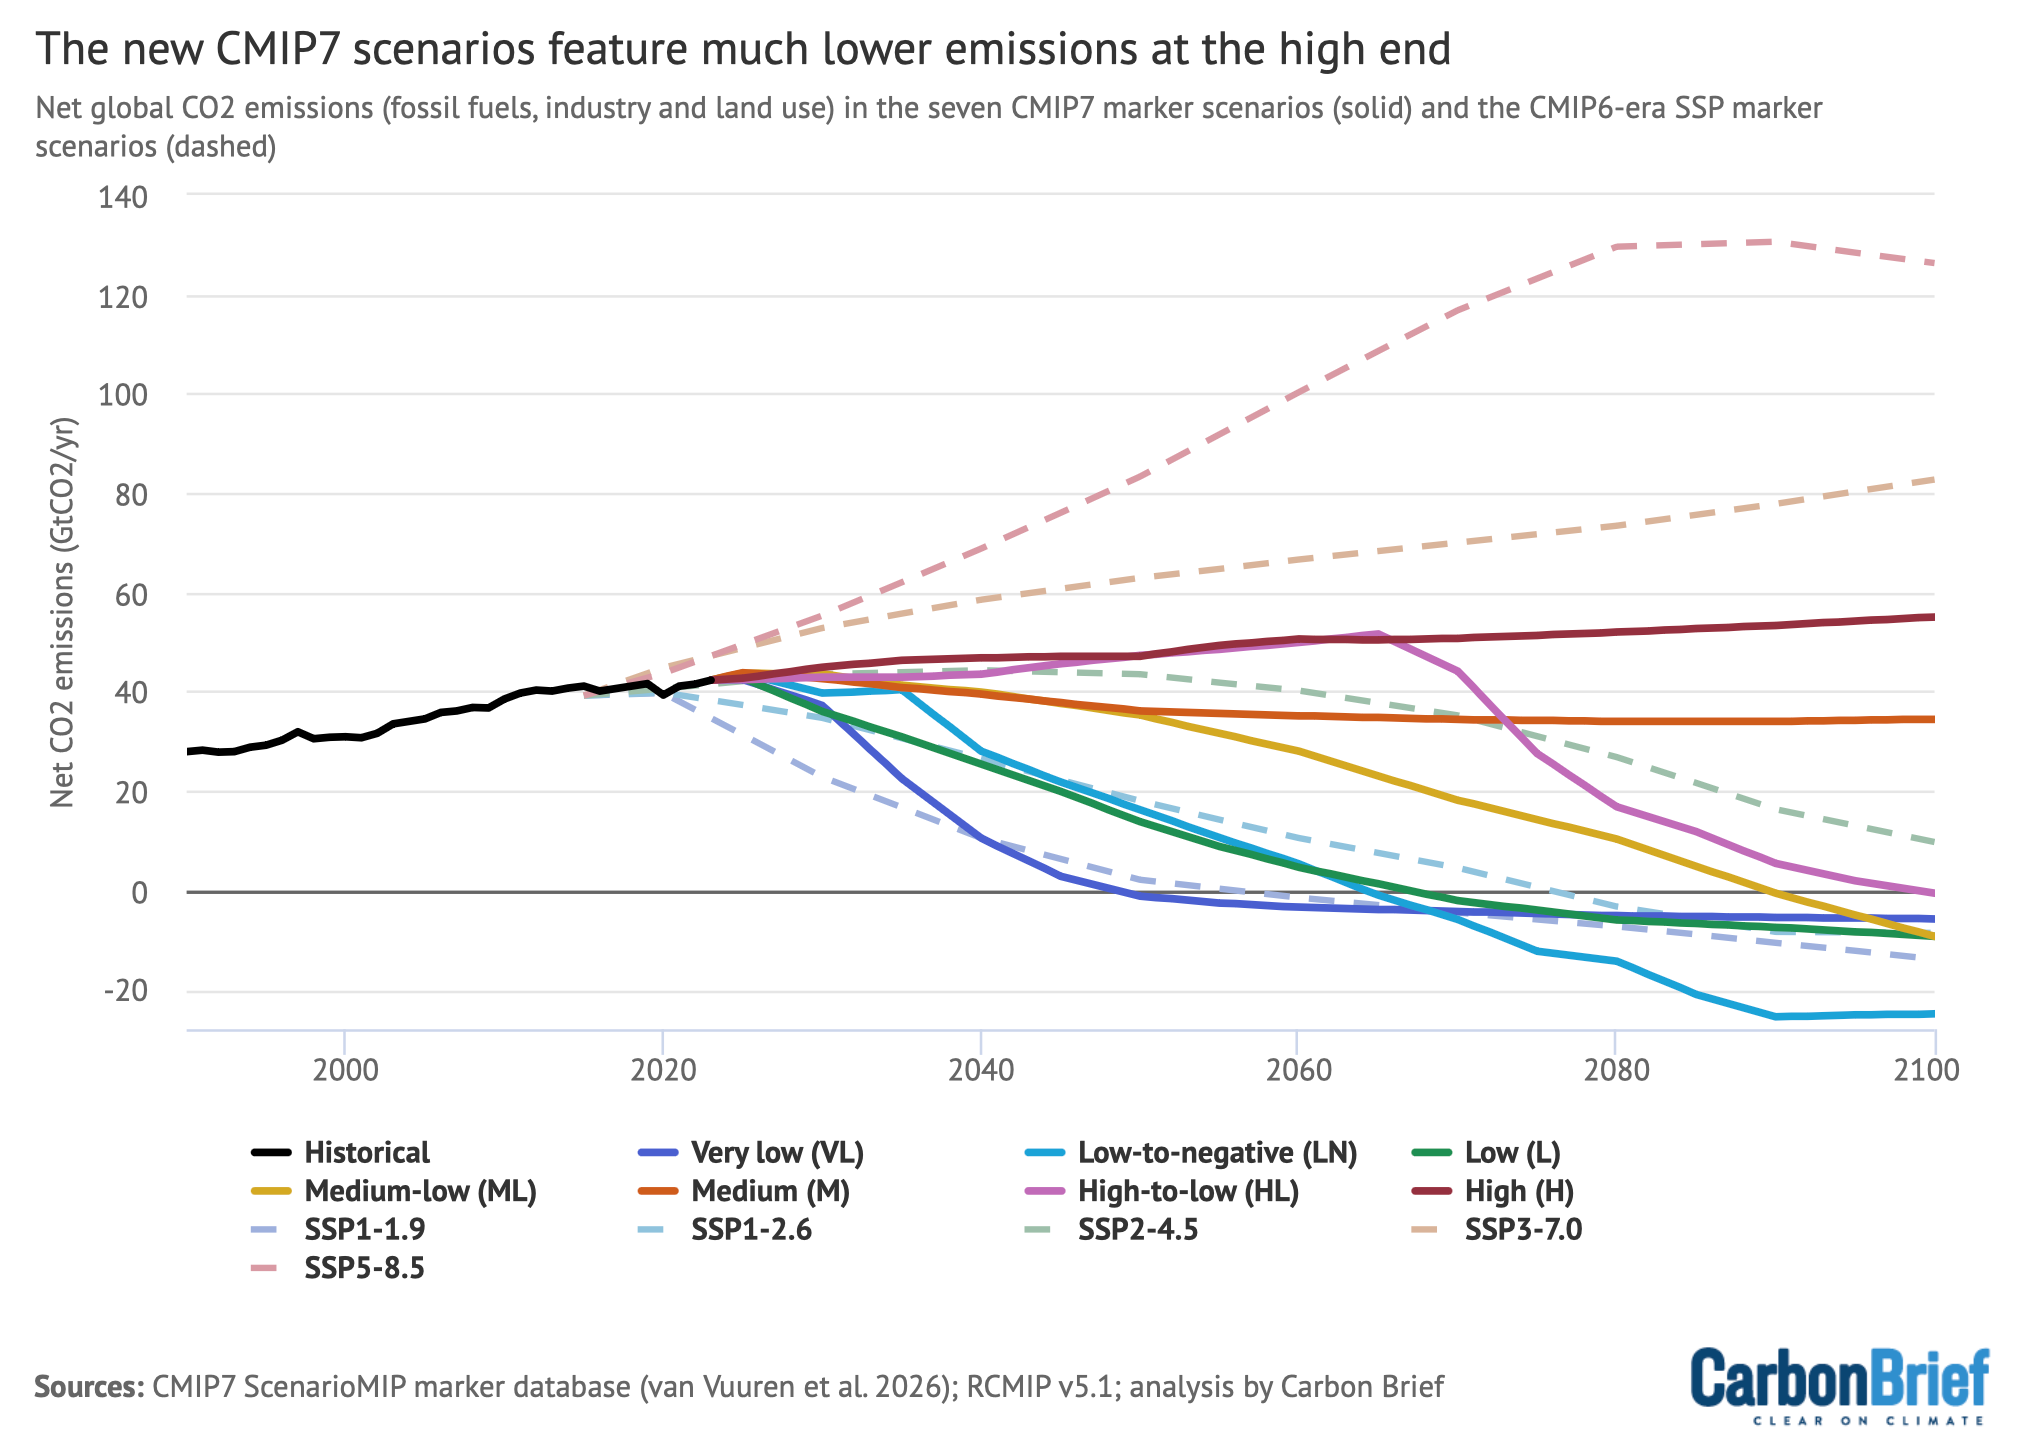
The figure below shows net global CO2 emissions (combining fossil-fuel and land-use emissions) for the seven new scenarios, alongside the five SSP scenarios used for climate model runs in CMIP6 (e.g. SSP1-1.9, SSP1-2.6, SSP2-4.5, SSP3-7.0 and SSP5-8.5).

The new CMIP7 scenarios feature much lower emissions at the high end. Chart shows net global CO2 emissions (fossil fuels, industry and land use) in the seven CMIP7 marker scenarios and the CMIP6-era SSP marker scenarios.
Net global CO2 emissions (GtCO2/yr) in the seven CMIP7 scenarios (solid lines, coloured) and the CMIP6-era SSP scenarios (dashed) for the period from 1990 to 2100. CMIP7 scenarios are harmonised to 2023, while SSP scenarios (from RCMIP) were harmonised to 2015. Data from the ScenarioMIP database and RCMIP; chart by Carbon Brief.

At the bottom of the range, the new scenarios closely track their predecessors: the very-low scenario reaches net-zero CO2 around mid-century much like SSP1-1.9, while the low scenario lands close to SSP1-2.6.

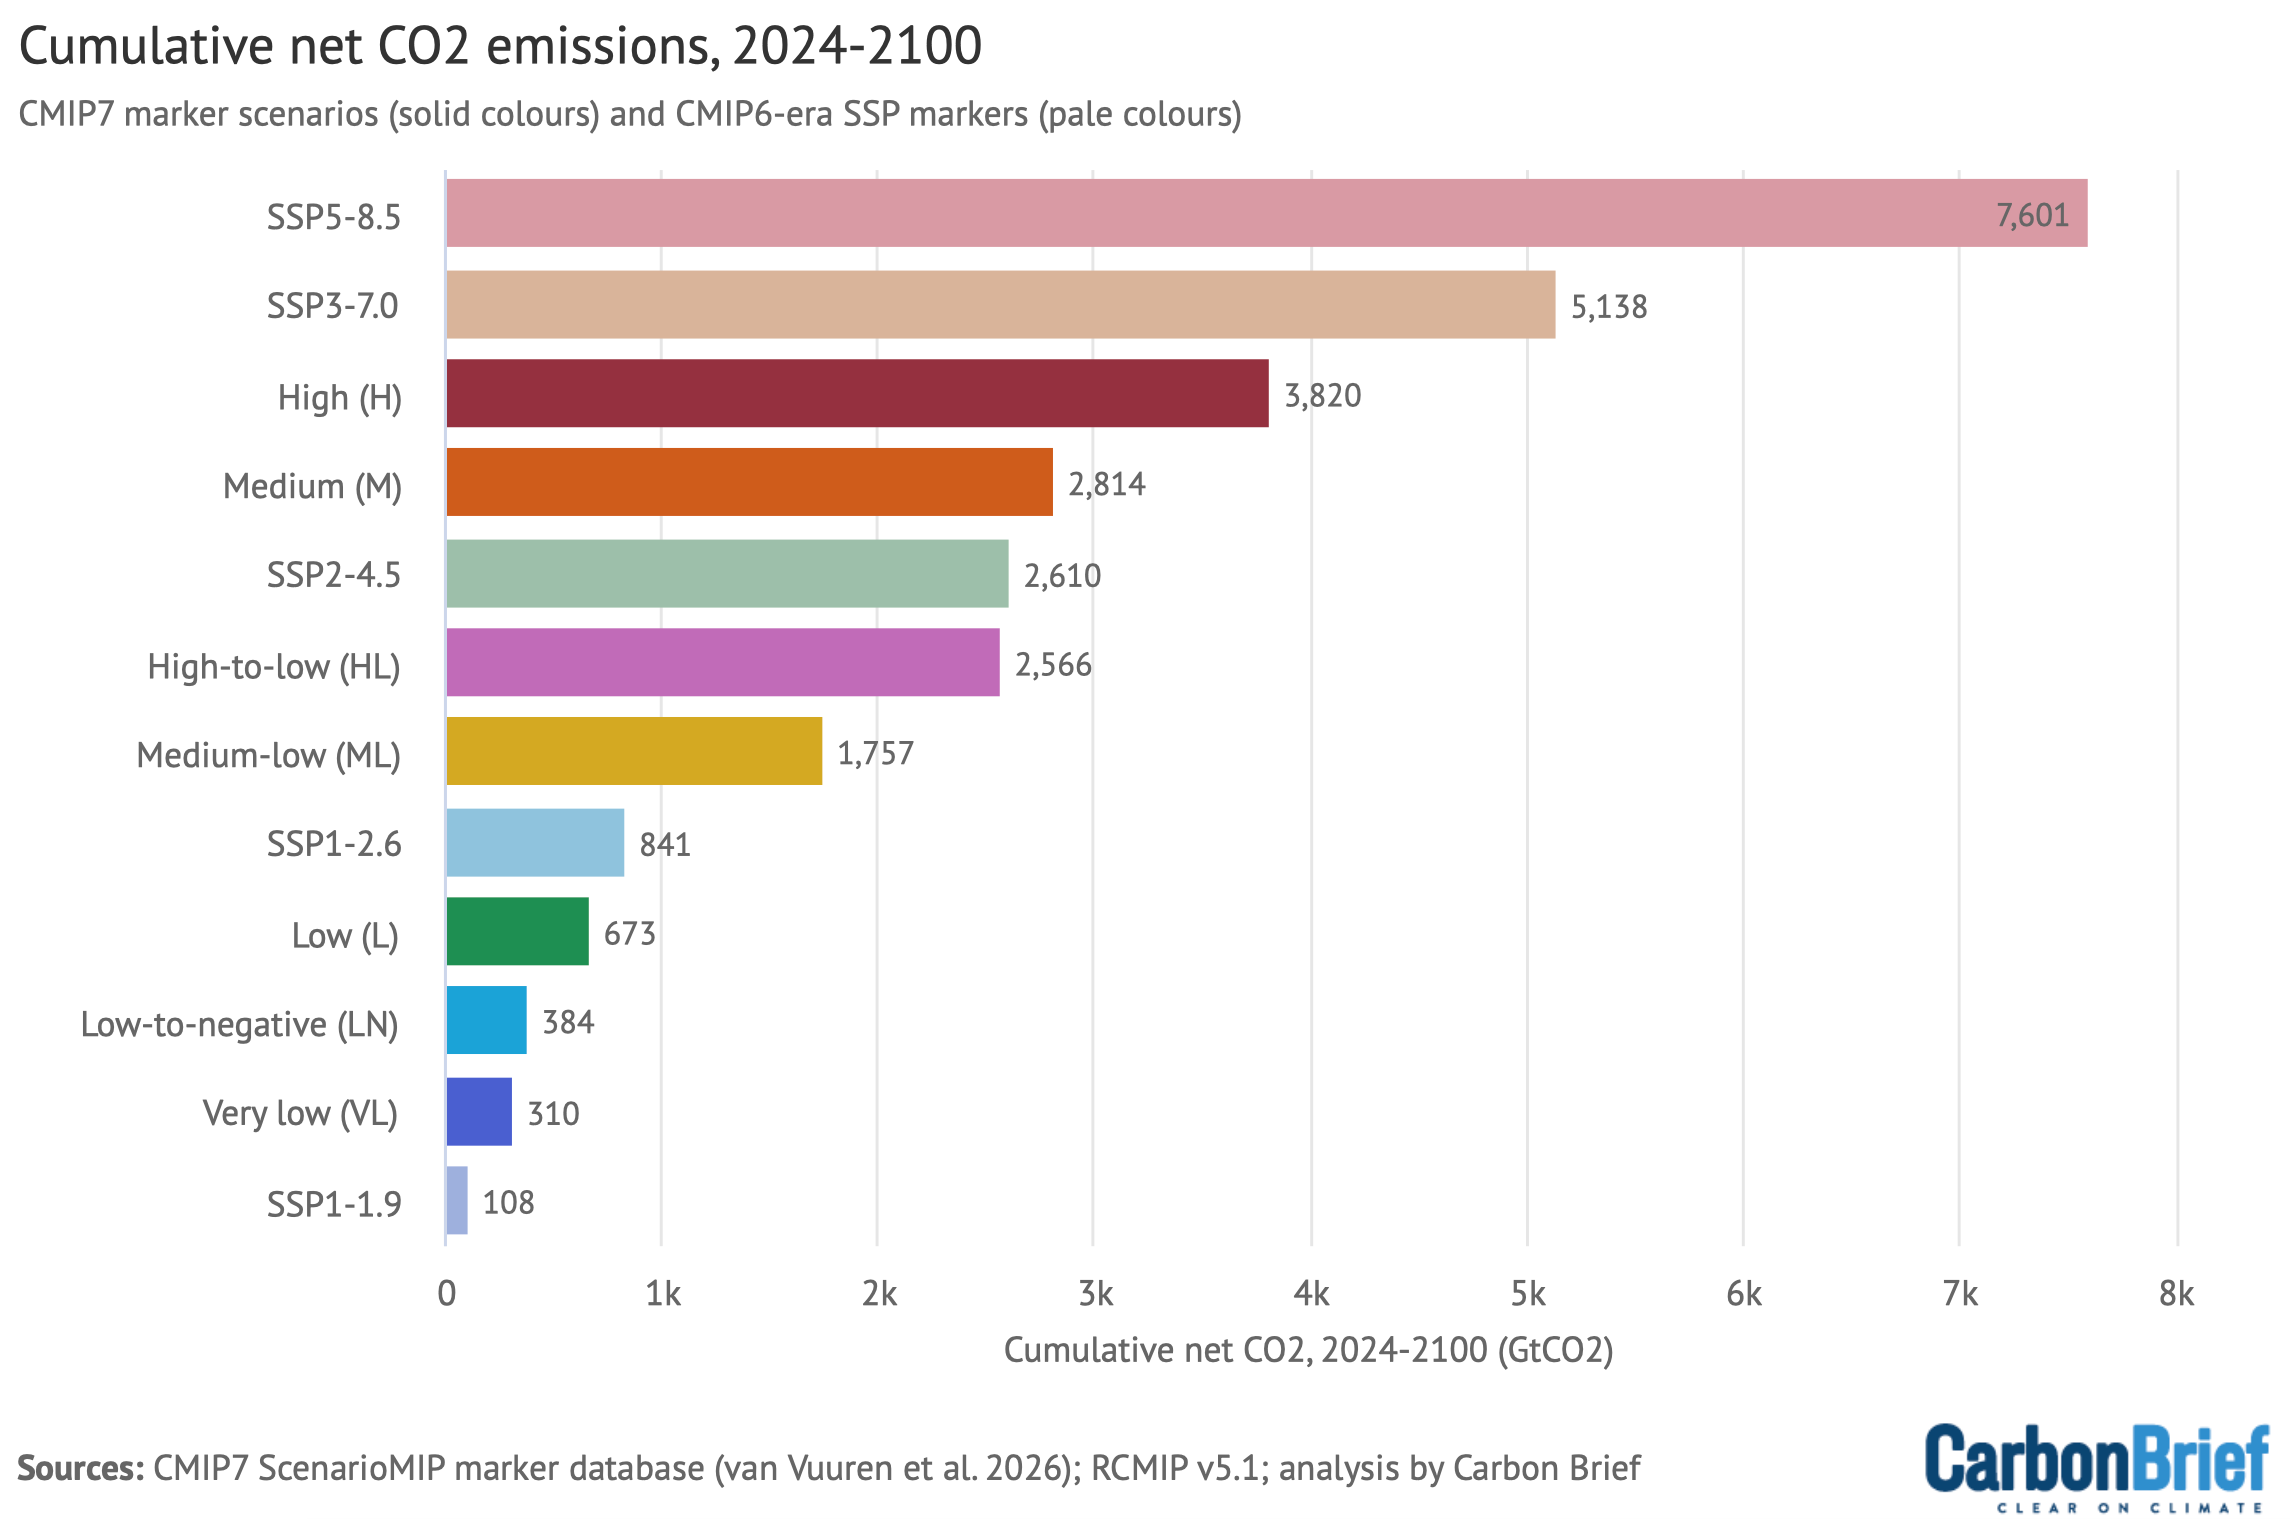
The chart below shows total emissions for the same scenarios for the period 2024-2100.

Cumulative net CO2 emissions, 2024-2100. Chart shows CMIP7 marker scenarios and CMIP6-era SSP markers.
Cumulative global CO2 emissions (GtCO2) between 2024 and 2100 in the seven CMIP7 scenarios (solid colours) and the CMIP6-era SSPs (light colours). Data from the ScenarioMIP database and RCMIP; chart by Carbon Brief.

The lowest emissions scenarios now have somewhat higher total emissions, reflecting the failure of the world to rapidly reduce emissions after 2020 that occurred in the lower SSP emissions scenarios, such as SSP1-1.9 and SSP1-2.6. The very-low scenario results in 310bn tonnes of CO2 (GtCO2) cumulative emissions between 2024 and 2100, compared to around 110GtCO2 in SSP1-1.9.

At the top end, the change is particularly dramatic. The high scenario in CMIP7 reaches 55GtCO2 per year in 2100. The previous high scenario, SSP5-8.5, by contrast, reached around 126GtCO2 per year in 2100.

In cumulative terms – which is what matters most for global warming – high reaches around 3,820GtCO2 over 2024-2100, half the roughly 7,600GtCO2 of SSP5-8.5 and about three-quarters of the 5,140GtCO2 of SSP3-7.0.

To put it another way: the top of the new scenario range sits between SSP2-4.5 and SSP3-7.0 in cumulative emissions terms, which is territory that CMIP6 treated as its middle ground.

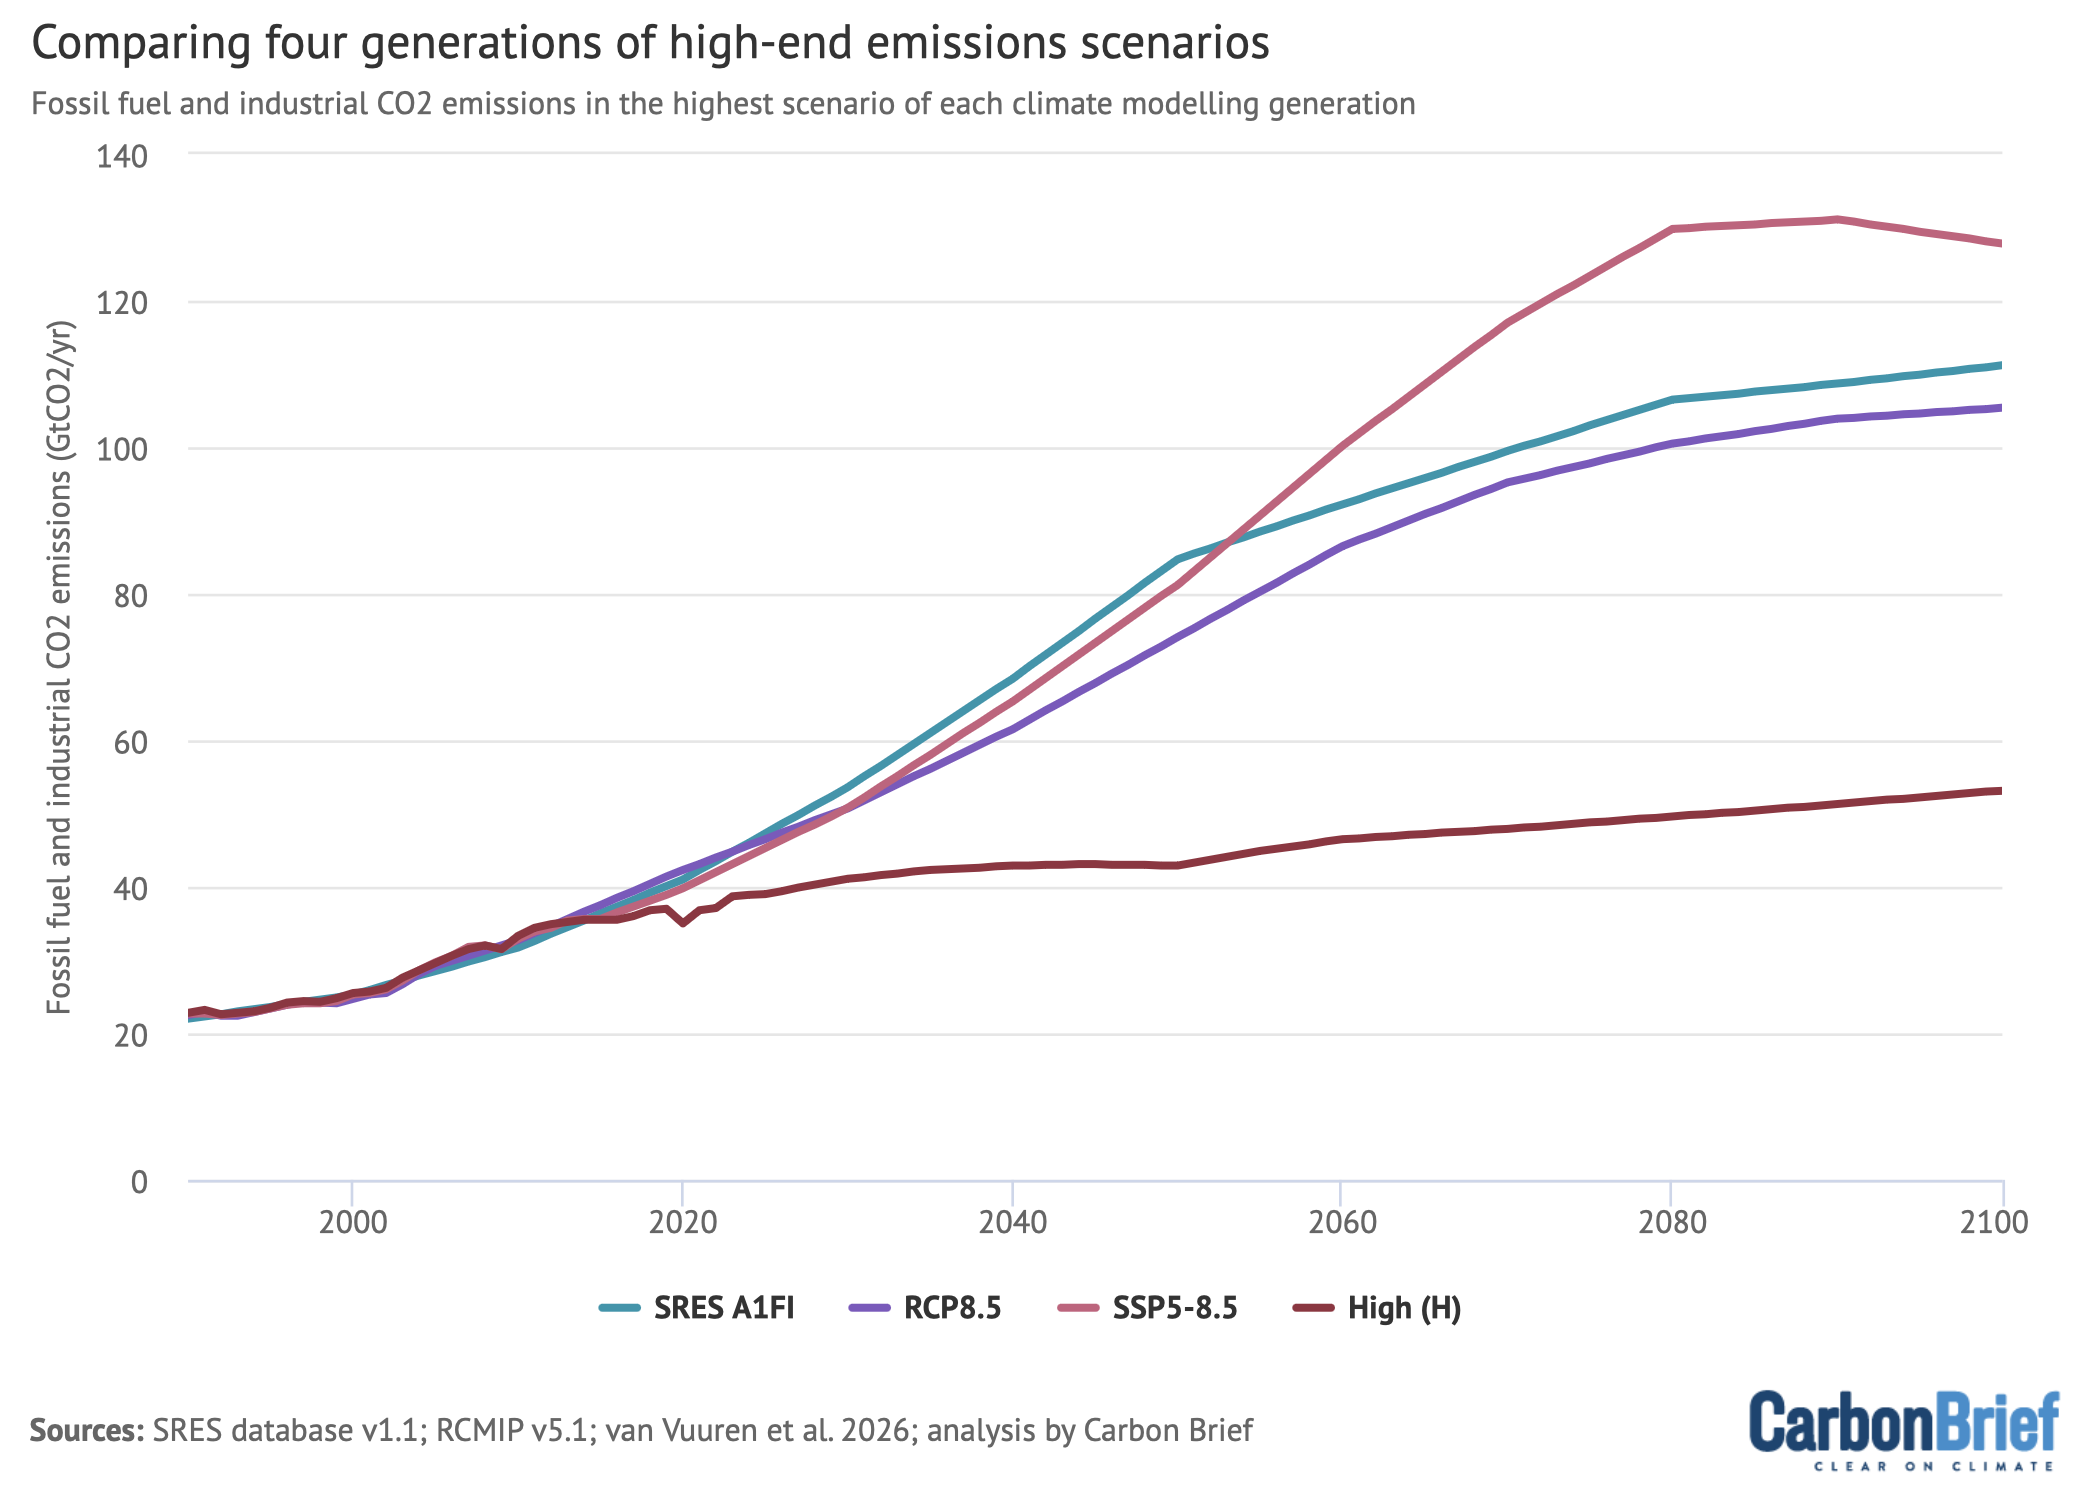
To make the scale of this shift clear, Carbon Brief analysed the CO2 emissions trajectories in each of the prior generations of high-end emissions scenarios, using the same simple climate model – FaIR – to calculate future warming.

Comparing four generations of high-end emissions scenarios. Chart shows fossil fuel and industrial CO2 emissions in the highest scenario of each climate modelling generation.
Fossil CO2 emissions relative to 1850-1900 for the highest scenario of each climate modelling generation: SRES A1FI (CMIP3, used in AR4), RCP8.5 (CMIP5, AR5), SSP5-8.5 (CMIP6, AR6) and CMIP7’s high, all run through AR6-calibrated FaIR ensemble. Data: SRES database v1.1, RCMIP v5.1, ScenarioMIP database; chart by Carbon Brief.

Below, four different generations of emissions scenarios are examined. The SRES scenarios were originally published in 2000 and used in the IPCC’s third (2001) and fourth (2007) assessment reports (and the corresponding CMIP3 model runs). The RCPs were developed in the early 2010s and used in the IPCC fifth assessment report (AR5; 2013) and CMIP5, while the SSPs were developed in the late 2010s and used in the IPCC AR6 report and CMIP6.

Over the past two decades, the highest emissions scenarios all resulted in comparable amounts of warming in 2100: SRES A1FI (the highest SRES scenario) reached 4.6C in 2100 (5-95% range; 3.5-6.1C), RCP8.5 reached 4.9C (3.7-6.5C) and SSP5-8.5 reached 4.6C (3.5-6.2C).

(RCP8.5 edges out its successor despite lower CO2 emissions because it assumed considerably more methane and nitrous oxide.)

Warming in 2100 in each model generation's highest scenario. Bar chart shows that the median and 5-95% range run through the same IPCC AR6-calibrated FaIR ensemble
Global mean surface temperature change in 2100 relative to 1850-1900 (medians and 5-95% ranges) for the highest scenario of each climate modelling generation: SRES A1FI (CMIP3, used in AR4), RCP8.5 (CMIP5, AR5), SSP5-8.5 (CMIP6, AR6) and CMIP7’s high, all run through AR6-calibrated FaIR ensemble. Data: SRES database v1.1, RCMIP v5.1, ScenarioMIP database; chart by Carbon Brief.

CMIP7’s high scenario comes in remarkably lower, at 3.3C (2.6-4.4C).

The downward revision of future emissions in CMIP7 reflects two key changes since RCP8.5 was published back in 2011. First, the plausible baseline of a repeal of current policy has fallen. Cheap solar, wind and batteries, a global plateau in coal use and more than $2tr per year in clean-energy investment mean that a rollback in climate policy would not result in coal deployment levels assumed in the RCP8.5 scenario.

The GMD study states that CMIP6’s high-emission levels “have become implausible, based on trends in the costs of renewables, the emergence of climate policy and recent emission trends”.

(For more, see Carbon Brief’s recent factcheck of false claims around the retirement of the SSP5-8.5 emissions scenario. Also see Carbon Brief’s recent interview with Prof Detlef van Vuuren, a key architect of both the old SSPs and new scenarios.)

Second, part of the apparent decline reflects a correction of how scenarios are communicated – rather than real-world progress. The old high-end scenarios always represented an estimate of worst-case scenarios at the time, rather than likely outcomes.

Genuine progress in reducing emissions probably accounts for around 0.7C of the roughly 1.7C gap between SSP5-8.5 and today’s current-policy trajectory, with the remainder reflecting that the baseline was never particularly likely.

What the new scenarios mean for future warming

To compare warming outcomes across scenario generations on a like-for-like basis, Carbon Brief ran both the seven CMIP7 scenarios and the CMIP6 SSP emission scenarios through the same simple climate model.

(This is FaIR v2.2, using the 841-member ensemble calibrated and constrained to match the assessment of climate sensitivity in IPCC AR6, historical warming and ocean heat uptake).

These values may differ from the ultimate results that are found by CMIP7 climate models, but give a sneak peak of what those results may look like when they become available.

Where the new scenarios take global temperatures. Chart shows median warming relative to 1850-1900 for the seven CMIP7 marker scenarios.
Median warming relative to 1850-1900 for the seven CMIP7 scenarios, with observations to 2025 (black) and the 5-95% ensemble range shaded for the medium and low scenarios. Dashed lines show warming between 2100 and 2150. Chart by Carbon Brief.

The seven scenarios produce warming in 2100, relative to pre-industrial (1850-1900), that ranges from 1.6C (with a 5-95% range of 1.1-2.5C) in the very-low scenario to 3.3C (2.6-4.4C) in high, with the current-policy medium scenario reaching 2.9C (2.2-3.9C). Warming also continues after 2100 in both the medium and high scenarios.

The figure below shows the range of 2100 warming (5th to 95th percentile) relative to the preindustrial period expected in each of the old SSP scenarios and the new CMIP7 ones, along with a central estimate (white dots).

Warming in 2100 in the new CMIP7 and old CMIP6 scenarios. Chart shows that seven CMIP7 marker scenarios and the CMIP6-era SSPs all run through the same FaIR climate model ensemble.
Warming in 2100 for CMIP7 scenarios and CMIP6 SSPs run through the identical FaIR ensemble (medians and 5-95% ranges). Chart by Carbon Brief.

The largest changes are, unsurprisingly, at the top. CMIP7’s high scenario (3.3C in 2100) produces less warming than SSP3-7.0 (3.7C in the same ensemble) and far less than SSP5-8.5 (4.7C).

The entire CMIP6 “high” tier (e.g. SSP5-8.5 and SSP3-7.0) now sits above anything in the new scenario set, at least up to 2100. Extended beyond 2100, however, high keeps climbing towards levels the previous extreme scenarios reached earlier.

At the low end, the picture is more similar. The very-low scenario (1.6C in 2100) lands close to SSP1-1.9 (1.5C) and low (1.8C) is essentially indistinguishable from SSP1-2.6 (1.8C) in 2100.

However, the new low scenario involves more rapid late-century emissions reductions and greater amounts of carbon removal than its SSP analogue, while the very-low scenario involves greater overshoot of 1.5C mid-century.

Crossing warming thresholds

In addition to calculating 2100 and 2150 warming, Carbon Brief has calculated the likelihood of passing different global warming levels (2C, 2.5C, 3C, 4C and 5C) over time in the new CMIP7 scenarios.

The chart below uses the IPCC approach of calculating the crossing year based on a 20-year average, rather than when a single year exceeds the warming level.

How likely is the world to pass each warming level? Chart shows the share of an IPCC-calibrated climate model ensemble exceeding each level in a given year, with dots marking the year each level becomes more likely than not.
Share of the 841-member FaIR climate model runs that exceed each warming level by year under the medium (top) and high (bottom) scenarios. Marked years show the median IPCC-convention (20-year average) crossing; percentages show the chance of exceeding each level by 2150. Chart by Carbon Brief.

Under the medium scenario, which reflects a world where current policies are maintained, passing 1.5C is essentially locked in.

Most models cross the threshold by the late 2020s or early 2030s. The 2C limit is crossed around 2050 on average and 3C by around 2110. The chance of exceeding 4C is around one-in-four by 2150, but, ultimately, rises to roughly 50% if emissions continue after that point.

Under the high scenario, 2C arrives in the 2040s, 3C in the 2080s and the chance of exceeding 4C by 2150 is around 60% (and around 95% by 2300). Even 5C is reached by 2150 in roughly 20% of climate model simulations.

The lower scenarios tell a different story. In the very-low scenario, the chance that peak warming (which the IPCC determines using a 20-year average of warming) ever exceeds 1.5C is around 90%. This reflects the fact that passing 1.5C is almost unavoidable at this point.

However, the chance of surpassing 2C sits at around 30% and the scenario has warming falling after mid-century as more CO2 is removed from the atmosphere than is added.

Carbon dioxide removal

Every scenario that has global warming peaking and declining requires pulling CO2 back out of the atmosphere. Otherwise, warming from CO2 emissions will persist for millennia.

CO2 removal (CDR) remains one of the few levers available to reduce future temperatures – particularly given additional warming caused by cuts to aerosol pollution.

The chart below shows the total CDR deployment in each of the different scenarios by year, reflecting the sum of both land-based and engineered approaches (top), as well as the total CDR deployment between 2024 and 2150 (bottom).

How much CO2 the scenarios pull back out of the atmosphere. Chart shows the total CO2 removal from engineered and novel methods (BECCS, direct air capture, enhanced weathering, biochar) plus the net land sink and soil carbon in the CMIP7 marker scenarios and extensions.
Total carbon dioxide removal (CDR) in the CMIP7 scenarios (solid) and their extensions (dashed), including both “engineered” and “novel” methods (bioenergy and carbon capture and storage (BECCS), direct air capture (DAC), enhanced weathering, biochar) plus land-based removals (the net land-use sink plus soil carbon management), along with with cumulative CDR for 2024-2150. Chart by Carbon Brief.

Every scenario that deeply cuts global emissions in CMIP7 also involves a large amount of CDR.

The low-to-negative scenario pulls a cumulative 2,360GtCO2 out of the atmosphere by 2150, roughly 60 years of today’s emissions run in reverse.

The high-to-low scenario has around 1,480GtCO2 cumulative CDR, medium-low has 1,450GtCO2 and low has 1,360GtCO2.

Even the very-low scenario, which seeks to minimise CDR use, requires 655GtCO2 of removals between 2024 and 2150.

The degree to which scenarios rely on “engineered” removals – such as the use of biochar or direct air capture – or land-based removals – including afforestation and reforestation – ranges across models.

In the low scenario, roughly one-third of the removals is from the land “sink”, while low-to-negative relies almost entirely on engineered methods, with direct air capture alone reaching around 16GtCO2 per year by 2100.

The chart below shows the deployment of engineered removals by year (top), as well as the total engineered CDR used between 2024 and 2150 (bottom). The lower plot also includes a breakdown between the portion of CDR that requires geologic storage (e.g. DAC and BECCS) and the portion that does not (e.g. enhanced weathering and biochar) and compares the total to a recent “prudent” total CO2 storage limit published in the scientific literature.

(For more on limits to carbon storage capacity, see Carbon Brief’s 2025 guest post.)

Carbon removal in CMIP7 scenarios. Engineered and novel CO2 removal (BECCS, direct air capture, enhanced weathering, biochar) in the CMIP7 marker scenarios and extensions, cumulative BECCS + DAC compared against estimated geological storage limits.
Engineered and novel CO2 removal only, with the cumulative BECCS and direct air capture component – the technologies requiring geological storage – compared against the “prudent” 1,460GtCO2 (range 1,290-2,710GtCO2) geologic storage limit set out in Gidden et al. (2025). Chart by Carbon Brief.

The amount of CDR going toward geological storage is most highest in the low-to-negative scenario, which injects around 1,750GtCO2 of BECCS and direct-air-capture CO2 underground by 2150.

The high-to-low and low scenarios each commit around 800GtCO2 to storage by 2150. This is within the range of available geologic storage, but would require that the storage industry handles more CO2 than the mass of oil currently moved by the fossil-fuel industry.

That said, there are other potential CDR approaches – such as enhanced rock weathering, surficial mineralisation and ocean alkalinity enhancement – that do not require injection of CO2 into geologic formations. In-situ mineralisation approaches that inject CO2 into alkaline rock formations such as basalt or peridotite could also open up more potential CO2 storage.

It is worth noting that the amount of CDR deployed in these scenarios would require planetary-scale engineering at the cost of trillions of dollars, while many of the engineered CDR approaches are still relatively early-stage technologies.

No single climate future

The goal of scenarios is to span a range of possible futures. While it may be tempting to treat current climate and energy policies – and the medium scenario – as a forecast, there is no reason to expect that they will not change in the future.

It is likely that policies will continue to be strengthened, as has been the case over the past two decades. However, they may also be weakened if national priorities or politics change, as has happened in the US during the two terms of the Trump administration.

In the new CMIP7 scenarios there is no “business-as-usual” scenario, but rather a narrower range of futures than was available in CMIP6, reflecting greater clarity among scientists on where the world is heading in terms of future energy use and emissions.

The fact that the worst-case scenarios of the past have become increasingly implausible is good news. However, this is tempered by the fact that the very-low emission scenarios have, in turn, become harder to achieve given that global emissions have yet to decline.

There is also real uncertainty in the climate-system response to emissions. This is due to uncertainty around how sensitive the climate is to a build-up of CO2 in the atmosphere, as well as how the carbon cycle will respond to emissions.

The CMIP7 medium scenario – which has a central estimate of 2.9C of warming by 2100 – still has around a 3% chance of reaching 4C by that date. If emissions continue, those odds increase to 25% by 2150. This remains far outside anything resembling a safe outcome for the climate system.

The scenarios are now being run using the new CMIP7 models, whose emissions-driven runs will fold carbon-cycle uncertainty directly into projections. These projections will subsequently be analysed in the reports of AR7.

Ultimately, it will be decisions made by governments, businesses and individuals that decide which of these seven futures become closest to reality.

Methodology

Emissions scenarios shown in this article are the seven CMIP7 ScenarioMIP scenarios set out in van Vuuren et al. (2026), harmonised to observed 2023 emissions, with rule-based extensions to 2500 generated using the FLEX methodology. Emissions through 2100 match the ScenarioMIP database; extension trajectories are indicative and may differ from the final published extensions.

Temperature projections use FaIR v2.2 with the fair-calibrate v1.4.5 constrained ensemble (841 members set out in Smith et al. (2024), which matches the AR6 assessed climate sensitivity (ensemble ECS median 3C, 5-95% 2.0-5.1C), historical warming and ocean heat content.

Historical emissions (1750-2022) use the FaIR historical emissions dataset, with scenario emissions spliced in after 2023.

Solar and volcanic forcing are updated through 2025 from the Climate Indicator forcing timeseries; future volcanic forcing ramps to the 1850-2021 climatological background by 2035 (following the CMIP7 protocol) and solar forcing follows a SOLARIS-HEPPA-derived cycle projection to 2300.

All warming is expressed relative to 1850-1900.

SSP comparisons run the RCMIP-harmonised CMIP6 scenario emissions through the FaIR ensemble, which yields 2081-2100 warming 0.1-0.3C below the AR6-assessed values at the high end (e.g. SSP5-8.5: 4.2C vs 4.4C assessed), reflecting differences between the AR6 assessment and the FaIR configurations used here. Updating the volcanic dataset to use CMIP7 values (which revises the eruption-rich 1850-1900 baseline period) raises all reported anomalies by 0.03-0.05C.

For CDR, the scenario database reports the technology split (for example, BECCS, direct air capture, enhanced weathering, biochar, ocean-based, soil carbon management). Agriculture, forestry and other land-use (AFOLU) removals are available only as a net flux, so are shown as the net sink where negative. Soil-carbon management is grouped with land-based rather than engineered removal, and the geological storage comparison uses BECCS plus direct air capture only.

The figure showing high-end scenarios for the past four CMIP generations runs SRES A1FI through the same ensemble using the A1G MiniCAM model from the SRES database v1.1, spliced onto historical emissions at 2000, and covering CO2 (fossil and land use), methane, nitrous oxide and sulphur; SRES-era ozone-precursor projections (nitrous oxide, carbon monoxide and volatile organic compounds) lie outside the calibrated range of FaIR, so RCP8.5 values are used instead. RCP8.5 uses RCMIP v5.1 emissions, with 13 minor halogenated gases absent from the RCP database following SSP5-8.5.

The post Explainer: The CMIP7 emissions scenarios – and how they explore future climate change appeared first on Carbon Brief.

Explainer: The CMIP7 emissions scenarios – and how they explore future climate change

Continue Reading

Climate Change

UN chief urges countries to adopt fossil fuel transition plans with timelines

Published

on

The head of the United Nations has called on all countries to deliver plans for phasing out their production and consumption of fossil fuels, as rising oil prices and climate shocks threaten energy and human security.

In his farewell speech to the UN General Assembly (UNGA) in New York on Tuesday, outgoing UN Secretary-General António Guterres for the first time urged “every government to adopt a national plan to transition away from fossil fuels” aligned with limiting warming to 1.5C. The plans, he said, should include “clear timelines and protection for affected workers and communities”.

“We know fossil fuel interests won’t step aside on their own. For decades, Big Oil has treated the atmosphere as an open sewer – and cashed in on the consequences,” Guterres told diplomats in his speech opening the leaders’ segment of the assembly, also calling out the industry’s windfall profits after Russia’s invasion of Ukraine.

    At last year’s COP30 climate summit in Belém, a group of about 80 governments led a failed push to develop a global roadmap to transition away from fossil fuels. Brazil instead proposed to draft a voluntary report that will be presented this year ahead of COP31 after countries and organisations submitted their views to the process.

    Governments first agreed to transition away from fossil fuels in energy systems at COP28 in Dubai in 2023, but have since failed to agree at UN climate talks on how to move forward with that commitment, as efforts to do so have been effectively blocked by large fossil fuel-producing countries.

    France, Netherlands issue plans

    A few countries have moved forward with their own transition plans. France launched the first one at an international conference on the issue in April and the Netherlands followed suit this month. Not being major fossil fuel producers, both European nations aim to end their coal, oil and gas consumption by 2050, although the Dutch plan was criticised for not setting specific phase-out dates for the dirty fuels.

    Adão Soares Barbosa, climate ambassador from Timor-Leste and chair of the Least Developed Countries (LDC) group in the UN climate negotiations, told a press briefing on Tuesday that last year’s discussions on shifting away from fossil fuels need to continue at COP31, adding that developed countries should lead the way with transition plans and curb their use of fossil fuels.

    “We are expecting that we can make a request to major-emitting countries to limit emissions from this sector,” he said. “For LDCs, we’ll also try to reduce fossil fuel use, but it will depend on national circumstances.”

    Samoa’s lead negotiator Anna Rasmussen said small island states have outlined their energy transition plans in their nationally determined contributions (NDCs) – countries’ plans for meeting the Paris Agreement goals – but added “we’re still waiting” for climate finance to help implement those plans.

    Despite the global push to clean up the energy mix, countries leading climate talks are themselves also expanding fossil fuel production. COP31 co-presidents Australia and Türkiye have both recently given the green light to mine and drill more coal, oil and gas, and still depend on fossil fuels for 60% and 56% of their electricity production respectively.

    Fossil fuel expansion threatens COP31 hosts’ credibility, experts warn

    COP30 host nation Brazil has also persisted with its plans to explore potential new oil reserves near the mouth of the Amazon River – a region known as the Equatorial Margin.

    These are moving ahead despite President Luiz Inácio Lula da Silva announcing last year at the Belém climate summit that the country would develop its own fossil fuel phase-out plan. This is still under development with little information about its progress and may be hampered by elections next month.

    “We have achieved our self sufficiency in oil and will continue to explore the potential of new reserves, such as those in the Equatorial Margin,” Lula said in his speech to the UNGA on Tuesday. “But we will not abandon the environmental agenda,” he insisted. “We will move forward with the roadmap for the decarbonisation of the Brazilian economy.”

    Transition far cheaper than status quo

    Speaking at the main Climate Week NYC venue, Mads Christensen, executive director of Greenpeace International, said given the fast-shifting cost dynamics for both fossil fuels and renewables, countries should revise their existing energy plans because they are now out of date.

    Gas power generation now costs around 150 euros per megawatt compared with around 50 euros for solar with battery storage – making the latter two-thirds cheaper.

    “If these plans were updated, I think we would have a much faster transition because it simply makes good financial sense,” he said.

    A technician walks next to solar panels that partially provide electrical power to the Grand Mosque of Istiqlal in Jakarta, Indonesia (Photo: REUTERS/Willy Kurniawan)

    A technician walks next to solar panels that partially provide electrical power to the Grand Mosque of Istiqlal in Jakarta, Indonesia (Photo: REUTERS/Willy Kurniawan)

    Tzeporah Berman, founder and chair of the Fossil Fuel Treaty Initiative, told Climate Home News that the Santa Marta process for transitioning away from fossil fuels (TAFF), launched at April’s conference, could help countries discuss, design and develop their national roadmaps, as well as mobilise the international cooperation required to actually deliver them.

    “Many countries want not only national roadmaps but a global roadmap off the highway to hell,” she added. “A global plan is necessary to ensure the rules aren’t rigged against those who want to do the right thing and so all countries can make credible commitments.”

    The second TAFF conference will be held in the Pacific island nation of Tuvalu next spring, co-chaired by Ireland. In New York, Tuvalu’s climate minister Maina Vakafua Talia called for stepped-up efforts to tackle the fossil fuel use that is threatening his country’s “demise” by driving global warming.

    “The world is running out of time, and so I ask every government to come to… Tuvalu with solutions – real solutions, not false solutions – for us to ensure that we have a pathway and a way forward,” he urged.

    The post UN chief urges countries to adopt fossil fuel transition plans with timelines appeared first on Climate Home News.

    UN chief urges countries to adopt fossil fuel transition plans with timelines

    Continue Reading

    Climate Change

    COP31 electrification pledge leaves out clean power commitment

    Published

    on

    COP31’s flagship initiative to accelerate the electrification of the world’s economy has been criticised for failing to include a commitment to produce the power from clean energy.

    Governments that sign the voluntary pledge at this year’s UN climate summit will commit to increasing electricity’s share of total energy consumption to 35% globally by 2035 in line “with pathways consistent with keeping 1.5C alive”, the text unveiled by the Turkish presidency on Tuesday says.

    While the document says that the electrification goal is “complementary to efforts to expand renewable energy and improve energy efficiency”, governments are not explicitly asked to commit to producing the extra power with clean sources and driving down greenhouse gas emissions.

    The text instead says the “use of clean electricity” will vary according to national circumstances. Fossil fuels are not mentioned by name, although the pledge cites the COP28 Global Stocktake decision, which called for “transitioning away from fossil fuels” in energy systems.

      COP31 president Murat Kurum said earlier this month that the push to make electrification more “widespread” – through measures like the rollout of electric vehicles and heat pumps – will “automatically” lead to a reduction in the use of fossil fuels.

      But many campaigners disagree, criticising the proposed pledge for failing to give an explicit signal on the fossil fuel transition.

      Lack of clarity on energy sources

      “Let’s not let electrification become the Trojan horse of our times, used to hide new fossil fuel consumption rather than promote renewable energy,” Claire Smith from civil society umbrella group Beyond Fossil Fuels said in reaction to the pledge’s publication.

      She added that the commitment will only help address the climate crisis if electrification is powered by a flexible energy system where solar and wind are complemented by enhanced grids and storage.

      The pledge’s text says that the electricity goal should be supported by “diverse and sustainable energy sources”, but it stops short of explaining what these sources are.

      Alden Meyer, an international climate policy expert and senior associate at think-tank E3G, said the details of the pledge matter to how effective it will be in helping bring planet-heating emissions down.

      “It has to be clean, and we haven’t got enough clarity on a guarantee that it will be a decarbonisation move,” he told Climate Home News.

      China’s industrial engine starts to break its fossil fuel habit

      According to an annual electricity review from energy think-tank Ember, in 2025 renewables edged ahead of coal power for the first time in 100 years. Continued growth in solar and wind pushed the share of renewables above a third of global electricity generation to just under 34%, compared with coal at 33%, it said.

      Janet Milongo, energy Transition lead at CAN International, said success cannot be measured simply by how much of the world’s final energy consumption becomes electric.

      “We must ask what generates that electricity, who has access to it, who owns the infrastructure, and whether it is helping communities transition away from fossil fuels,” she added.

      Electrification alone can’t meet climate goals

      Analysis published by the IEA on Tuesday, alongside the pledge, found that it would already be cost-effective to raise electricity’s share of global energy use from 23% today to around 33% with existing technologies, putting the COP31 goal “within striking distance”. Based on current policies, however, the share reaches only about 30% by 2035.

      Hitting the 35% target would cut fossil fuel importers’ import bills by around $400 billion a year by 2035, the IEA said. At the higher prices caused by the conflict in the Middle East, that saving rises to more than $500 billion.

      Speaking at New York Climate Week on Tuesday, IEA executive director Fatih Birol said the agency’s figures show that in 2026, about 80% of all new power plants built will run on renewables, with a few percentage points coming from nuclear power and the rest from fossils fuels. “So therefore, electrification itself will lead reduction of the [greenhouse gas] emissions,” he added.

      IEA Executive Director Fatih Birol speaks at Climate Week NYC on September 22, 2026 (Photo: Megan Rowling / Climate Home News)

      IEA Executive Director Fatih Birol speaks at Climate Week NYC on September 22, 2026 (Photo: Megan Rowling / Climate Home News)

      However, the IEA warned in its new report that electrification “by itself is not enough” to meet the world’s climate targets. It noted that, if “low-emission” sources of power continue to simply grow in line with current policy scenarios, that would be only just enough to cover the extra demand from electrification, driving a modest decline in emissions.

      Matt Webb, associate director of global clean power diplomacy at E3G, said the pledge is a “welcome signal of leadership” and can help COP31 be a “critical moment” for countries to double down on the energy commitments made at COP28.

      But to secure the full benefits of electrification, he added, it is essential that we “urgently clean up” by speeding up the rollout of renewables and developing credible national plans to transition away from fossil fuels.

      The post COP31 electrification pledge leaves out clean power commitment appeared first on Climate Home News.

      COP31 electrification pledge leaves out clean power commitment

      Continue Reading

      Climate Change

      As loss and damage fund stalls, Nepal crowdfunds flood relief

      Published

      on

      People around the world have donated almost $90 million to a government-led campaign to help Nepal recover from its recent devastating Himalayan flood, according to a Nepali climate negotiator, even as the UN chief slammed the tiny amount of money in a new fund to deal with such disasters.

      Individuals and companies from Nepal and abroad have chipped in from $5 to “many millions” of dollars to the Prime Minister’s Disaster Relief Fund, Manjeet Dhakal, an advisor to the poorest countries at UN climate talks, told an event on Monday focused on early warning systems.

      The prompt and substantial response from the public contrasts with the slower, more limited support that is potentially on offer from the UN’s new Fund for Responding to Loss and Damage (FRLD), set up by governments to compensate developing countries for climate disasters.

      Comment: Human security relies on adapting to the world’s new climate reality

      Over three weeks have passed since Nepal’s finance and environment ministers asked the FRLD board to take an urgent decision to allocate funding to help Nepal protect people and restore essential services in the wake of the disaster, which caused around 1,450 deaths and left more than 5,000 people missing.

      “Time is of the essence,” the ministers wrote in an appeal to the FRLD on August 31, which was swiftly followed by a letter from a group of developing-country board members urging the FRLD board’s co-chairs to organise an extraordinary meeting to come up with a response.

      Loss and damage fund hesitates

      Yet, despite informal online meetings, the co-chairs have yet to convene a meeting with the power to allocate funds. The board’s next scheduled meeting begins on December 15.

      Dhakal said on Monday that the request has “received some positive response, but still there is some discussion ongoing about how to respond to that”.

      “If they can’t respond in a timely manner, then is [the fund] fit for purpose in terms of disasters that the world would be facing in the coming years? The scale and intensity of these disasters is increasing,” he said.

      With just $820 million pledged to it by rich countries and not all of that yet delivered, the FRLD has earmarked just $350 million to spend in its initial phase and without further contributions could run out of money next year.

      Because of these limited funds, and a huge number of requests for funding totalling nearly $3 billion, the FRLD has said it will only give out a maximum of $20 million to each project for now. It has yet to approve funding for any projects.

      Dhakal recently told The Nation magazine that this amount was just a “symbolic gesture”. Nepal’s government has estimated the costs of recovery and reconstruction at $4.8 billion, with homes, roads, bridges, hospitals and hydropower stations in the affected area needing to be repaired and rebuilt.

      “Ridiculously small” funding

      In a speech to the UN General Assembly on Tuesday, the body’s outgoing Secretary-General António Guterres criticised the “ridiculously small” level of funds made available by wealthy governments to the FRLD. Developed countries should “make the loss and damage fund work at scale”, he said.

      Secretary-General António Guterres speaks at UNGA (Photo: UN Photo/ Loey Felipe)

      The Portuguese diplomat told world leaders that when he travelled to Nepal three years ago, he had “sounded the alarm on accelerating glacier melt, warning that the rooftops of the world are caving in”.

      “Some dismissed it all as overstating dangers, but as tragic events have shown, impacts are arriving sooner, hitting harder, and spreading further than many anticipated,” he said.

      A recent study by scientists with the World Weather Attribution group found that climate change contributed to the rock-ice avalanche which sparked a huge flash flood along a river valley on the Nepal-Tibet border.

      Speaking at a separate event in New York on Monday, leading climate scientist Johan Rockström highlighted those findings on the role of global warming in the Himalayan disaster.

      “This will be potentially the first poster-child case of a loss and damage invoice, because here we have a proven case of a catastrophe which would not have occurred if it hadn’t been for human-caused climate change,” he said.

      The post As loss and damage fund stalls, Nepal crowdfunds flood relief appeared first on Climate Home News.

      As loss and damage fund stalls, Nepal crowdfunds flood relief

      Continue Reading

      Trending

      Copyright © 2022 BreakingClimateChange.com