Connect with us

Published

on

Global sea ice extent is at a record low for this time of year, due to rapid Antarctic sea ice melt and below-average Arctic coverage, new data reveals.

Antarctic sea ice extent has been tracking at record-low levels for almost the entire year, making headlines around the world.

It has now reached its annual maximum for the year, clocking in at 16.96m km2 on 10 September, according to provisional data from the National Snow and Ice Data Centre (NSIDC).

This is the smallest Antarctic sea ice maximum in the 45-year satellite record by “a wide margin”, the NSIDC says, and one of the earliest.

Antarctic conditions this year have been “truly exceptional” and “completely outside the bounds of normality”, one expert tells Carbon Brief.

Meanwhile, Arctic sea ice extent reached its minimum for the year at 4.23m square kilometres (km2) on 19 September.

This is the sixth-lowest minimum on record and 1.99m km2 below the average maximum recorded over 1981-2010.

Record low global sea ice

Arctic sea ice has been melting for months, driven by long sunny days and warm temperatures. But, as winter approaches, the melt season has now come to an end. Arctic sea ice reached its minimum for the year on 19 September and is now growing towards its winter peak.

At the Earth’s other pole, the opposite is happening. Antarctic sea ice – which has been growing since February – reached its winter peak on 10 September. Its melt season has now begun.

Using satellite data, scientists track the seasonal growth and melt of sea ice, allowing them to determine the size of the annual minima and maxima. Recording the sea ice extent at each pole – the area of ocean with at least 15% sea ice coverage – is a key way to monitor the “health” of Antarctic sea ice.

The plots below show Arctic (left) and Antarctic (right) sea ice extent over June-October. Sea ice extent in 2023 is shown in blue, the 1981-2010 average in grey and other years in other colours.

Arctic (left) and Antarctic (right) sea ice extent over June-October. Source: NSIDC

In the Antarctic, sea ice extent has been tracking at record-low levels for months. Dr Ella Gilbert – a regional climate modeller at the British Antarctic Survey – tells Carbon Brief that Antarctic conditions this year have been “truly exceptional” and “completely outside the bounds of normality”.

Global sea ice extent – the sum of sea ice extent in the Arctic and Antarctic – has also been tracking at a record low for months.

The plot below shows the combined sea ice extent for the Arctic and Antarctic. The red line indicates sea ice extent in 2023, yellow shows 2016 and other blue lines indicate other years dating back until 1979 when the satellite record began.

Global sea ice extent
Global sea ice extent. Source: Zachary Labe

‘Exceptional’ Antarctic melt

The Antarctic has attracted widespread media attention throughout this year. In February, Antarctic sea ice extent reached its summer minimum extent of 1.79m km2, setting the record for a second straight year.

Commenting on the new record low minimum – the third record to be set in seven years – one study warned that the Antarctic had entered a “new state”, in which the underlying processes controlling Antarctic sea ice coverage “may have altered”.

As the weather cooled in March, Antarctic sea ice “expanded at a fairly typical pace”, according to the NSIDC. Nonetheless, March 2023 average sea ice extent was the second lowest on record.

Antarctic sea ice extent remained “sharply below average throughout” April, clocking in with the second lowest daily extent on record by the end of the month.

Gilbert tells Carbon Brief that Antarctic sea ice “never really recovered” from its record-low February minimum, thanks to a “slow freeze-up”.

Antarctic sea ice grew only 2.87m km2 over May 2023 – considerably less than the average growth of 3.25m km2. Air temperatures were up to 4C above average over the Weddell sea during the month, but around 4C below average over the Amusden sea.

By 31 May, Antarctic sea ice extent was again at a record low extent, clocking in at around 700,000 km2 smaller than the previous daily record lows recorded in 1980, 2017 and 2019. Sea ice continued to track at “extreme record low levels” throughout June, according to the NSIDC.

The graphic below shows Antarctic daily sea ice extent in 2023 (red) compared to previous years over 1979-2023.

Antarctic daily sea ice extent.
Antarctic daily sea ice extent. Data source: NSIDC.

Dr Zachary Labe is a postdoctoral researcher working at NOAA Geophysical Fluid Dynamics Laboratory and the Atmospheric and Oceanic Sciences Program at Princeton University, and a Carbon Brief contributing editor.

He tells Carbon Brief that the record lows are linked to “both oceanic and atmospheric factors”, especially related to the strength of the Amundsen Sea Low – a low pressure trough named after the sea off West Antarctica that it typically sits above.

Exceptionally low” sea ice extent continued into July, with the NSIDC noting that Antarctic ice extent as of mid-July was “more than 2.6 km2 below the 1981-2010 average, an area nearly as large as Argentina”. Antarctic sea ice extent was particularly low in the northern Weddell Sea, western Ross Sea and southern Bellingshausen Sea.

World Meteorological Organization on X: Antarctic sea ice coverage was lowest on record for July, 1.5 million km2 less than July 2022

Antarctic sea ice continued to grow slowly as the season progressed. Average extent was at a record low in July, clocking in at 1.50m km2 below the previous record low set in 2022, the NSIDC noted. It added at the time:

“There is speculation that the Antarctic sea ice system has entered a new regime, in which ocean heat is now playing a stronger role in limiting autumn and winter ice growth and enhancing spring and summer melt.”

The graphic below shows Antarctic sea ice thickness in July 2023 (left) and the difference in sea ice thickness between July 2023 the 1981-2010 July average (right). In the right-hand map, the areas of deepest red show where sea ice thickness in July this year was below average.

Antarctic sea ice thickness in July 2023 (left) and the difference in sea ice thickness between July 2023 the 1981-2010 July average (right).
Antarctic sea ice thickness in July 2023 (left) and the difference in sea ice thickness between July 2023 the 1981-2010 July average (right). Source: Zachary Labe

By the beginning of August, Antarctic sea ice growth began to level off. On 15 August, Antarctic sea ice extent was 1.73m km2 below the previous record low for the date, which was set in 1986.

Antarctic sea ice growth then picked up as the month progressed. It continued to track at a record low, but increased more than average in the Bellingshausen and Amundsen Seas as well as in the Pacific Ocean.

On 10 September, Antarctic sea ice likely reached its annual maximum extent of 16.96m km2. This is the lowest sea ice maximum in the 45-year by “a wide margin”, the NSIDC says. The previous record-low Antarctic minimum extent was 17.99m km2.

It adds that this year’s winter peak is one of the earliest on record – 13 days earlier than the 1981-2010 average date of 23 September.

The plot below shows Antarctic sea ice extent on 10 September, with the median sea ice extent for 1981-2010 shown by the orange line.

Antarctic sea ice extent on 10 September. Median sea ice edge for 1981-2010 is shown in orange.
Antarctic sea ice extent on 10 September. Median sea ice edge for 1981-2010 is shown in orange. Source: NSIDC.

Gilbert notes that scientists have “no evidence of comparably low winter extent in the satellite record, nor in reconstructions of the last century or so”, adding:

“Given how variable sea ice is, it’s hard to say for certain whether this is the beginning of a longer-term shift towards a new regime in Antarctic sea ice. However, climate models predict that Antarctic sea ice will decline, and I think it’s only a matter of time until we see the signature of climate warming in Antarctic sea ice trends.”

The record low Antarctic sea ice levels have received widespread attention in the media in recent months, with BBC News, the Times and the Daily Telegraph calling the record-low sea ice levels “mind–blowing” and “dramatic”.

The impact on wildlife has also caused alarm. At the end of August, multiple outlets reported on a new study that found thousands of emperor penguin chicks in Antarctica had died because of record-low sea ice levels in 2022.

And new research warns that the Antarctic is also warming twice as fast as the global average. (It is already well established that the Arctic has warmed four times faster than the global average over the past four decades.)

Arctic minimum

At the Earth’s other pole, the season has been less eventful.

The Arctic reached its winter peak on 6 March 2023 with a sea ice extent of 14.62m km2 – the fifth smallest winter peak in the 45-year satellite record. This point marked the beginning of the melt season for the year.

Arctic sea ice extent declined in the week following the March peak, but cool weather nearly halted the ice melt during the second half of the month. Slow Arctic ice melt continued throughout April with “only” 20,600 km2 of ice lost per day on average, according to the NSIDC.

Slower-than-average sea ice melt persisted throughout much of May. Air temperatures over the Arctic ocean were around 1-4C below average throughout the month – except for over the Barents, Kara, and Beaufort Seas, where temperatures were 2-6C above average.

The map below shows the regional seas that make up the Arctic Ocean.

The regional seas that make up the Arctic Ocean.
The regional seas that make up the Arctic Ocean. Source: NSIDC.

Sea ice melt sped up as the season progressed, resulting in faster-than-average melting throughout June. By the end of that month, average Arctic sea ice extent was 10.96m km2 – the 13th lowest for the time of year in the satellite record.

Arctic sea ice extent declined at a near-average pace throughout July, clocking in at the 12th lowest in the satellite record for the time of year.

However, record-breaking heat swept across the world in August, causing Arctic sea ice melt to accelerate, the NSIDC noted at the time.

Temperatures in the first half of August were “below average north of Greenland, above average in the Chukchi and East Siberian Seas, and considerably above average in the Kara and Barents Seas,” the NSIDC said.

The maps below shows absolute air temperatures in the Arctic in August 2023 (left) and the difference in air temperature between August 2023 the 1981-2010 August average (right). In the right-hand map, the areas of deepest red show where August this year was substantially hotter than average.

Air temperatures in the Arctic over August.
Air temperatures in the Arctic over August. Source: Zachary Labe

By the middle of August, sea ice extent was near average on the Atlantic side of the Arctic, but “well below average” in most other regions other than a tongue of ice extending toward the coast in the East Siberian Sea, the NSIDC said:

“​​The Northwest Passage appears to be on the verge of becoming nearly ice free, particularly the southern route, known as Amundsen’s route.”

As is typical of August, the pace of sea ice loss slowed during the second half of the month as cooler conditions set in.

The left-hand map below shows Arctic sea ice concentration – a measure of the amount of sea ice in a given area, usually described as a percentage – during August 2023. The areas shaded white indicate a high concentration.

The right-hand map shows the difference between this August and the 1981-2010 average, where red indicates a lower sea ice concentration in 2023 than the baseline.

Arctic sea ice concentration during August 2023.
Arctic sea ice concentration during August 2023. Source: Zachary Labe

Labe tells Carbon Brief that there have been some “particularly large regional extremes” around the Arctic this season.

For example, he highlights the “massive amount of open water on the Pacific side of the Arctic, which stretches from the Beaufort Sea to the East Siberian Sea”. Sea ice extent in this region dropped to the second lowest in the satellite-era, beaten only in the year 2012, he says.

Zack Labe on X: Sea ice across the Pacific side of the #Arctic has now dropped to the 2nd lowest on record in at least the satellite-era. This is a lot of open water.

Labe adds that within the main Arctic ice pack, there are “many areas of open water” this year, indicating that the ice is not very compacted. By mid September, sea-ice area – a measure of how compacted the ice is – reached its fourth lowest for the time of year, he says.

He also notes that sea ice was “significantly thinner than average in the Beaufort sea region” in August.

Zack Labe on X: The changes in September #Arctic sea ice thickness by decade..

Arctic sea ice extent reached its minimum for the year at 4.23m square kilometres (km2), on 19 September, according to the NSIDC. This is the sixth lowest in a satellite record – 1.99m km2 smaller than the average minimum over 1981-2010 .

Days before the minimum was announced, the Marine Climate Change Impacts Partnership published a review paper on Arctic sea ice. It found that the September minimum Arctic sea ice extent has reduced by around 12% per decade compared to the 1981-2010 average.

It added:

“More than half the observed loss of Arctic sea ice can be directly attributed to warming caused by anthropogenic greenhouse gas emissions.”

Labe tells Carbon Brief that the Arctic today is “radically different” than it was only two or three decades ago. “This is due to human-caused climate change,” he says.
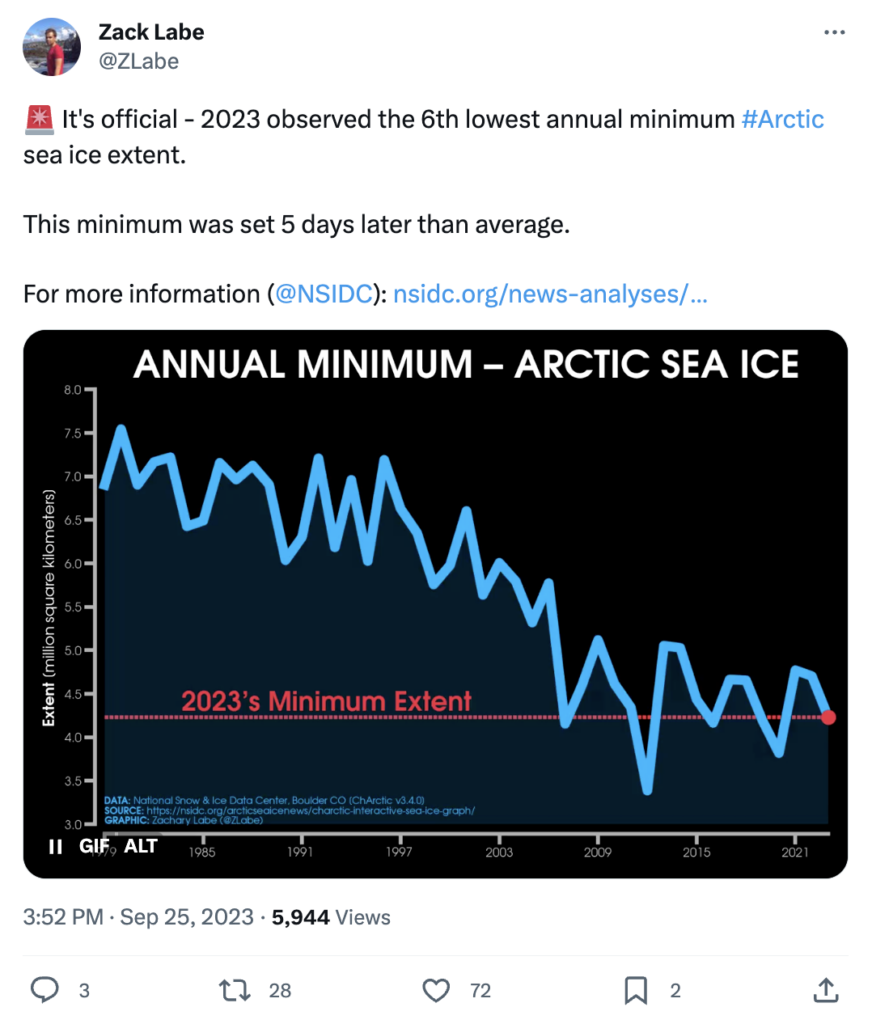
Zack Labe on X:  It's official - 2023 observed the 6th lowest annual minimum #Arctic sea ice extent.

This minimum was set 5 days later than average.

According to the NSIDC, the 17 lowest Arctic sea ice minima on record have occurred in the past 17 years.

The post ‘Exceptional’ Antarctic melt drives months of record-low global sea ice cover appeared first on Carbon Brief.

‘Exceptional’ Antarctic melt drives months of record-low global sea ice cover

Continue Reading

Climate Change

UN chief warns climate crisis “in overdrive” as El Niño threatens to fuel the fire

Published

on

The United Nations Secretary-General and foreign ministers from the UK, France and Spain have blamed the deadly wildfires engulfing Europe on climate change, using the disaster to renew calls for faster cuts to greenhouse gas emissions.

António Guterres told journalists on Friday that the “climate crisis is in overdrive”, adding that global heat seen so far is just a “warm up act” as a phenomenon known as El Niño intensifies “adding fuel to a planet already on fire”.

A new World Meteorological Organisation (WMO) report published on Friday predicts that the weather pattern will grow into a “strong event” between now and October, increasing the risk of higher than normal temperatures across much of the world and disrupted rainfalls.

“That risks shattering every seasonal record – and driving even more severe effects worldwide,” Guterres said.

El Niño builds on top of an already warming world, driven primarily by the burning of fossil fuels. A WMO scientist, who did not want to be named, told journalists that all the heatwaves and other climate impacts seen so far this year are “before the effects of El Niño are really kicking in at a global scale”.

Fossil fuellling the fires

Fires have broken out across much of Europe but are threatening the most people in the south-west of France near Bordeaux and in Central Spain near Madrid. Nearly a quarter of a million people have been evacuated in France with hundreds of homes destroyed while in Spain 80,000 people have had to leave their homes and at least 13 died in one village.

A scientific study published on Friday by the World Weather Attribution group found that man-made climate change made deadly fires in France twice as likely and those in Spain twenty times more likely. Smaller fires in the UK were not analysed by the study.

UN Climate Change leader Simon Stiell blamed fossil fuels for the fires, as well as storms in Chile and heatwaves in North America and Japan in recent weeks. “The climate alarm is blaring”, he said on Wednesday.

Guterres criticised new fossil fuel production projects and fossil fuel subsidies for causing hardship across the world. Discussing his speech, a senior UN official – who did not want to be named – said the subsidies amounted to trillions of US dollars a year and criticised pension funds and institutional investors, including insurance companies, for continuing to invest in fossil fuel projects.

The head of the United Nations Antonio Guterres (right) with the head of the UN’s climate arm Simon Stiell (left) at COP30 (Photo: Kiara Worth/UNFCCC)

Asked why world leaders and the public are not prioritising climate action, Guterres said they are distracted by wars in Ukraine, the Middle East, Sudan and elsewhere and sometimes forget “other aspects that are a sometimes even more dangerous threat”.

Also the fossil fuel industry and “some countries” are campaigning to pretend that climate change does not exist, he said, adding that the UN should be more active in “naming the situations as they are and the responsibilties as they are and mobilising the public opinion”.

After meetings in Paris and Madrid earlier in the week, the UK’s new foreign minister Ed Miliband issued joint statements with his French and Spanish counterparts – Jean-Noël Barrot and José Manuel Albares Bueno – calling on the world to reduce its dependence on fossil fuels.

They promised to do more to reduce emissions and protect their people and encouraged other governments to do the same.

The UK-French statement called on governments to publish UN climate plans, known as nationally determined contributions (NDCs), which are aligned with the Paris Agreement’s goal to limit global average temperatures to 1.5C above pre-industrial levels.

According to Climate Action Tracker, only three countries – the UK, Nigeria and Norway – have submitted NDCs with 2035 emissions reduction targets which are compatible with 1.5C. Fifty-two countries – including Egypt, Vietnam and Argentina – have yet to submit an NDC at all.

Defending science

Beyond action on emissions, the ministers also intervened in an ongoing dispute over the timing of the Intergovernmental Panel on Climate Change’s (IPCC)’s next flagship assessment.

Miliband and Barrot’s statement said they “underline the importance” of scientific report feeding into governments’ next global stocktake of progress on climate action in two years’ time, calling it a “critical input” to that process.

The timing of this report has been a contentious issue in government negotiations at the IPCC and at June’s climate talks in Bonn. While a group of nations calling themselves the “friends of science” want the report before the stocktake, others like Saudi Arabia and India have argued that this would make the report of a worse quality and less inclusive of developing countries’ scientists.

Science ‘under attack’ from fossil fuel interests at UN climate talks

The UK-Spanish statement weighed in less explicitly on this issue but said that they “recall the importance of scientific evidence and acknowledge the work of the IPCC in this respect.”

The British and French ministers said they would seek to accelerate reductions of emissions in methane, a particularly potent greenhouse gas, at COP31 in November. They encouraged governments “to work jointly to develop a marketplace for fossil fuels with near-zero methane intensity.”

Methane leaks from oil, gas and coal production are a major contributor to global warming. Over a 20-year period, methane traps around 80 times more heat than carbon dioxide.

Ed Miliband meets José Manuel Albares Bueno in Madrid on 29 July 2026. (Picture by Ed Morris / FCDO)

The UK and Spanish statement emphasised the importance of supporting the Global South and underlined the need to mobilise sustainable financing “at scale with the challenge we face”. The previous UK government, in which Miliband was energy minister, cut climate finance to developing countries to pay for increases in military spending.

The UK government led by new Prime Minister Andy Burnham has yet to outline any major changes to climate finance in its two weeks in power but has announced it will convert some finance from grants to loans in order to free up money to subsidise bus travel in England.

More adaptation needed

Guterres said that “it is time to stop treating each disaster as an isolated tragedy and recognise the systemic risk that is unfolding before our eyes.” A recent study found that three-quarters of UK media reports about the British June heatwave did not mention climate change.

As well as reducing emissions, the UN Secretary-General called for measures to adapt vulnerable people to extreme heat. Specifically, he said that buildings should be built and retrofitted for extreme heat and that every city and country should have heat-health action plans and early warning systems. Over 250 cities have joined the UN’s ‘beat the heat’ initiative, he said.

The Portuguese diplomat called for governments and employers to do more to protect their workers from heat, criticising global fashion brands for not setting heat standards for the factories that supply them. “No one should have to risk their life to earn a living,” he said.

The post UN chief warns climate crisis “in overdrive” as El Niño threatens to fuel the fire appeared first on Climate Home News.

UN chief warns climate crisis “in overdrive” as El Niño threatens to fuel the fire

Continue Reading

Climate Change

‘Ride the wave of momentum’: Australia announces once-in-a-decade Marine Parks Network review

Published

on

In response to the federal government announcing its once-in-a-decade review of Australia’s Marine Parks Network, the following lines can be attributed to Elle Lawless, Senior Campaigner at Greenpeace Australia Pacific:

“Greenpeace Australia Pacific welcomes today’s announcement that the Albanese Government will review Australia’s Commonwealth Marine Parks Network. This is a rare, once-in-a-decade opportunity to strengthen our marine parks and ban industrial fishing in Australia’s marine protected areas.

“Australians would be appalled to know that more than half of Australia’s Marine Parks Network currently allows for extractive industries, like longlining, bottom trawling and oil and gas mining. These so-called ‘protected’ areas were designed to safeguard our beloved ocean wildlife and underwater ecosystems – that is what Australians expect. Damaging industrial industries should not be given a free pass to trawl, fish, drill or extract from our marine parks.”

“With the first Ocean COP just around the corner, and off the back of Australia’s move to ratify the Global Ocean Treaty earlier this year, the Australian government has a unique opportunity to ride the wave of this momentum and solidify itself as a true global ocean leader.

“Greenpeace Australia Pacific is calling for industrial activities to be banned from our protected waters and for at least 30% of Australia’s ocean to be protected as ocean sanctuaries. This review presents a rare opportunity to create more ocean sanctuaries, true blue havens where ocean life can recover, thrive and repopulate the surrounding waters.”

—ENDS—

‘Ride the wave of momentum’: Australia announces once-in-a-decade Marine Parks Network review

Continue Reading

Climate Change

Factcheck: No, Europe is not having its ‘quietest’ year for wildfires

Published

on

In recent days, prominent climate sceptics and rightwing commentators have shared charts on social media incorrectly implying that Europe is having its “quietest” year for wildfires in 2026.

These include Dr Matthew Wielicki, a former University of Alabama geochemist and self-described “professor in exile”, who was recently appointed by the Trump administration to lead the US Global Change Research Program.

However, these charts paint a misleading picture as they are skewed by encompassing the entirety of Russia in the data – including the vast plains of Siberia.

These charts also use data that include fires that are deliberately lit to manage cropland, which is a declining practice across much of Europe.

In this factcheck, Carbon Brief shows that the area burned by wildfires across the European Union in 2026 is second only to 2022 for this time of year.

The latest data from the European Forest Fire Information System (EFFIS) also shows that France has set a new modern record for area burned and Spain’s wildfire season is among the worst on record.

The fires have displaced more than a third of a million people across south-western Europe, while an impending heatwave has also raised fears of the fires worsening in the coming days.

‘Quietest year’

On 27 July, as wildfires raged across multiple European countries, former Conservative peer and climate-sceptic commentator Matt Ridley posted on Twitter that “2026 is the quietest year for wildfires in Europe by some distance”.

Misleading social media post by Mitt Ridley that says" er...2026 is the quietest year for wild fires un Europe by some distance."

Ridley, who sits on the academic advisory council of the Global Warming Policy Foundation (GWPF), a UK-based climate-sceptic lobby group that refuses to reveal the sources of its funding, was responding to an article by Daily Telegraph columnist Tim Stanley.

Stanley’s column, headlined: “Climate change is real – and the right needs to get serious about it”, warned:

“This is no longer a matter of speculation: the wildfires of Europe, pitiless and persistent, are the way we live now.”

Ridley included a chart from Our World In Data, showing the cumulative area burned by wildfires by week for Europe. The chart puts 2026 as having the smallest area for this time of year in a dataset going back to 2012.

Ridley’s post was widely shared by prominent rightwing figures – including Richard Tice, deputy leader of the hard-right, climate-sceptic Reform UK party, former Conservative cabinet minister Jacob Rees-Mogg and multiple commentators.

Separately, Wielicki also shared a chart on Twitter to imply that wildfires in Europe are declining. Wielicki has previously claimed that the “science is not settled on climate change”.

The charts posted by Ridley and Wielicki both use data from the Global Wildfire Information System (GWIS). The GWIS category for “Europe” encompasses all the countries on the continent and includes the whole of Russia.

As a result, Russia accounts for about 74% of the area included in the GWIS definition of “Europe”.

Wildfires in Russia typically account for 80-90% of the burned area in the GWIS Europe dataset. In 2026, fires in Russia are substantially below average. Therefore, including Russia in this comparison creates the false impression that wildfire activity across Europe is unusually low.

Dr Calum Cunningham, a research fellow at the University of Tasmania’s Fire Centre, says that such claims are “highly misleading”, noting that “they rely on aggregating fire activity across an enormous and climatically diverse region”. He tells Carbon Brief:

“A relatively quiet season in Russia can easily mask an exceptionally active season in France or Spain. If the analysis is focused on the regions actually experiencing the current fires, the picture is very different.

“The reality is that western Europe has experienced an extraordinary sequence of climate conditions this year.”

In contrast, the EFFIS provides a subset of wildfire data specifically for the area covered by the 27 nations of the EU, which, therefore, excludes Russia.

Another difference between the two datasets is that GWIS monitors all fires – including those on agricultural land that are intentionally set alight. The burned area as measured by GWIS contains significant cropland area.

By contrast, EFFIS uses land-cover data and other information to filter specifically for forest fires.

Looking at the EU-only data from EFFIS reveals that Europe is far from having its “quietest” year. The bloc’s burned area, as of 29 July, is almost 435,000 hectares (ha) – second only to 2022 for this time of year.

The area burned by wildfires in the EU in 2026 by end of July is second only to 2022. Weekly cumulative burned area (hectares). Line graph shows 2026 burned area reaching over 400,000 hectares by late July, far exceeding the 2006-2025 average. Source: EFFIS - (alt text generated by Google Gemini)

Notably, Wielicki has actually continued to post charts based on GWIS data, even after acknowledging that “includ[ing] all of Russia, including vast areas of Siberia…isn’t a good proxy for Europe”.

French fires

Even looking at EU-wide data misses the scale of this year’s wildfires for some individual countries.

The chart below shows the surge in burned area in France since mid-July.

For much of the first half of the year, the country was having a wildfire season that was only slightly above average in terms of total burned area. However, a notable uptick began in the first week of July.

The third week of the month saw France break its previous cumulative annual record by more than 19,000ha. That gap has widened as the fires continue to burn; as of 29 July, the cumulative burned area in France during 2026 was nearly 24,700ha above the previous record.

France's wildfires in 2026 are the most widespread in modern records. Weekly cumulative burned area (hectares). A line chart shows 2026 burned area sharply rising by August to over 90,000 hectares, well above the 2006-2025 range maximum of around 65,000 and average of 15,000. Source: EFFIS - (alt text generated by Google Gemini)

The fires in France follow a record-breaking June heatwave that “dried out vegetation across the region, allowing fires to spread quickly”, wrote the New York Times.

On 27 July, French president Emmanuel Macron called a “crisis cabinet meeting” in order to address the fires “ravaging several areas of south-west France”, said France 24.

More than 220,000 people have been evacuated due to the Gironde fire, west of Bordeaux, in “what may be France’s largest peacetime evacuation”, reported the Associated Press.

In the Conversation, Cunningham and two other University of Tasmania researchers write that evacuation orders “protec[t] human lives, but makes it more likely houses and other structures will burn if there’s no one to defend them”. They add:

“There is little doubt climate change has made France and Spain’s wildfires worse. They represent yet another reason to redouble our efforts to tackle climate change and stabilise our climate.”

Central Spain scorched

While Spain’s fire season has not broken records in the same way that France’s has, it is on track to be among the worst since EFFIS began reporting data in 2006.

The chart below shows the rapid increase in burned area in Spain since 8 July. The latest data from EFFIS reveal that, as of 29 July, Spain has almost matched its previous record at this point in the year. It is also nearly five times the average area burned for this time of year.

Line chart titled "Spain's 2026 wildfires are among the worst in modern records", subtitle "Weekly cumulative burned area (hectares)". By August, 2026 burned area surges past 200,000 hectares, rising far above the 2006-2025 average and near the upper historical range. Source: EFFIS - (alt text generated by Google Gemini)

In Spain, the wildfires have been concentrated in the central part of the country, near Madrid.

BBC News reported that the fires outside the capital have burned “an area more than twice as large as the city itself”.

Nearly 90,000 people were forced from their homes in central Spain by the fires, said the Associated Press.

Pedro Sánchez, Spain’s prime minister, called the fires a “painful expression” of climate change.

Meanwhile, the UK, French and Spanish governments have issued joint statements this week in response to the fires. The UK/Spain statement begins:

“This summer’s wildfires demonstrated that climate change was now a national security emergency facing Europe and threatening our way of life.”

The post Factcheck: No, Europe is not having its ‘quietest’ year for wildfires appeared first on Carbon Brief.

Factcheck: No, Europe is not having its ‘quietest’ year for wildfires

Continue Reading

Trending

Copyright © 2022 BreakingClimateChange.com