
Welcome to Carbon Brief’s DeBriefed.
An essential guide to the week’s key developments relating to climate change.
This week
‘Leeway’ for fossil fuels
METHANE EXEMPTION: The European Commission is considering making changes to its flagship methane emissions regulation to give fossil-fuel companies “leeway to avoid penalties…in what would be a major win for the oil and gas sector”, reported Politico. According to new draft government guidelines seen by the outlet, “national authorities would be able to grant exemptions to companies on energy security grounds”. A separate Politico story said the move comes after the Trump administration “has intensified pressure on the regulation”.
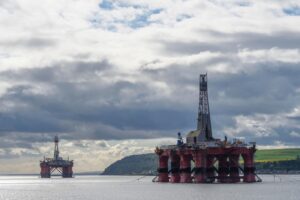
GAS EXPANSION: The Guardian reported that the Norwegian government has been “heavily criticised for approving plans to reopen three North Sea gasfields nearly three decades after they were closed”, with the justification of helping to “fill the gap in energy supplies created by the Middle East war”. Oslo has also given its approval for oil and gas companies to explore 70 new locations in the North Sea, Barents Sea and Norwegian Sea, the newspaper added.
RENEWABLES INVESTMENT: The Financial Times reported that investors are “piling into clean-power funds at the fastest pace in five years as the Iran war accelerates a global push for energy security and alternatives to oil and gas, boosting a slew of stocks linked to the transition away from fossil fuels”. It added that more than £3bn has been invested in global funds linked to renewable energy in April, bringing their total net asset value up to $43bn.
Around the world
- SHIPPING TALKS: Nations are “back on track” to adopt a framework for curbing global shipping emissions, following the latest International Maritime Organization’s meeting in London, according to a Carbon Brief Q&A.
- SUPER El NIÑO: Global sea temperatures were the second highest on record for the month of April, “stoking concerns among scientists that an El Niño warming cycle is brewing that would intensify extreme weather”, reported the Financial Times.
- ROUND-THE-CLOCK: An International Renewable Energy Agency (IRENA) report found that “solar and wind power paired with battery storage systems are already delivering reliable, round-the-clock electricity at a lower cost than fossil fuel-dominated energy systems in a growing number of regions”, said BusinessGreen.
- KENYA FLOODS: At least 18 people have died in floods and landslides driven by heavy rain in Kenya, reported Al Jazeera.
0.15C
The average amount by which trees lower summer temperatures in cities globally, according to research in Nature Communications.
Latest climate research
- Airborne microplastics and nanoplastics have the potential to contribute to warming by absorbing sunlight | Nature Climate Change
- A mega tsunami in Alaska in 2025 was “preconditioned by glacial retreat caused by climate change” | Science
- “Net-zero global power systems meeting universal electricity needs for decent living standards are technically feasible” | Nature Energy
(For more, see Carbon Brief’s in-depth daily summaries of the top climate news stories on Tuesday, Wednesday, Thursday and Friday.)
Captured
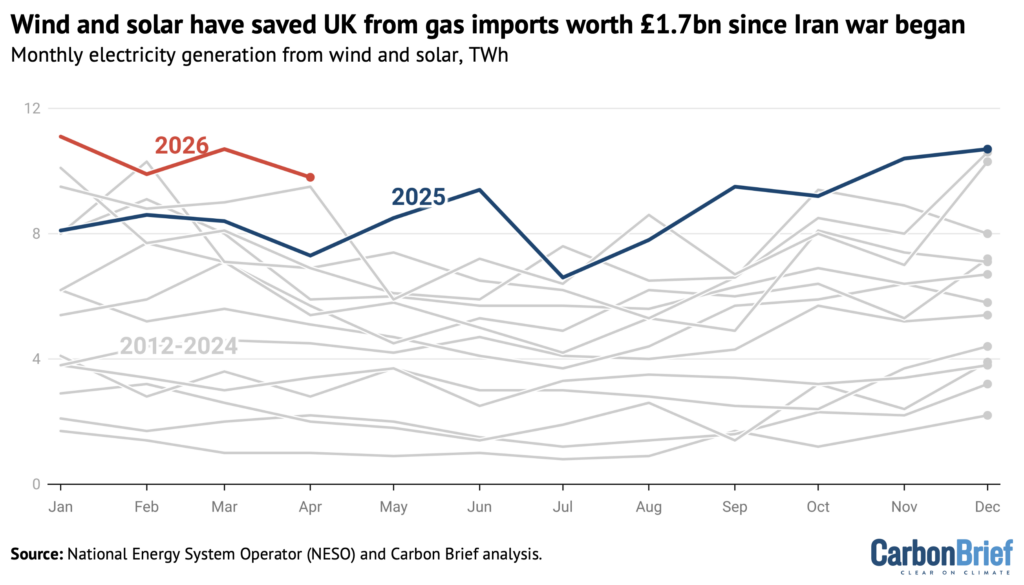
The UK has avoided the need for gas imports worth £1.7bn since the start of the Iran war, as a result of record electricity generation from wind and solar, according to Carbon Brief analysis. The chart above shows that wind and solar have generated a record 21 terawatt hours (TWh) on the island of Great Britain since the end of February 2026, when the US and Israel first attacked Iran. The record wind and solar output avoided the need to import 41TWh of gas – roughly 34 tankers of liquified natural gas (LNG). Importing those 34 tankers of LNG would have cost around £1.7bn, according to Carbon Brief analysis.
Spotlight
Tipping troubles
New research published this week shows how even small increases in global temperature, when combined with deforestation, could push the Amazon rainforest past a “tipping point”.
Crossing this threshold would trigger the gradual transition of vast swathes of the lush rainforest into dry savannah.
On the sidelines of the European Geosciences Uniongeneral assemblyin Vienna, Carbon Brief speaks to lead author Prof Nico Wunderlingfrom Goethe University Frankfurt and the Potsdam Institute for Climate Impact Research.
Carbon Brief: Why does the Amazon rainforest have a tipping point?
Prof Nico Wunderling: All tipping elements have important feedback mechanisms that once a threshold – the tipping point – is crossed, kick in and a change in the system is self-amplified. For the Amazon rainforest, this important feedback mechanism is the atmospheric moisture recycling – meaning that the rainforest generates much of its own rainfall.
For eastern parts of the rainforest, moisture mostly comes from the Atlantic. The rainfall it receives then evaporates and is transported towards the west. And, just to give you a sense of how large this feedback can be, for parts of the rainforest, more than 50% of its rainfall is generated by the forest itself.

CB: How do global warming and deforestation both play a role in a potential tipping point?
NW: Both global warming and deforestation undermine this atmospheric moisture recycling. The direct way is deforestation – we cut down the forest, we lose major parts of the evapotranspiration, so you have less rainfall for the downwind forest. Also, global warming impacts the rainforest – it increases the number and intensity of droughts, which decreases the overall available rainfall and, therefore, can decrease the stability of the rainforest, which also leads to an undermining of the atmospheric moisture recycling.
Around 17% of the Amazon rainforest has already been lost. The critical threshold in our study is in the order of 22-28% of deforestation.
CB: Would such a transition be Amazon-wide? Or would it happen in pockets or regions?
NW: That actually depends on the other pressures that we expose the rainforest to. What we found is that, under climate change only [with no deforestation], the threshold kicks in at around 3.7-4C of warming. If that is crossed, then we find that around one-third of the Amazon rainforest is at risk of transitioning to a degraded ecosystem.
Then, if deforestation is also included [at 22-28%], this threshold comes down to well within the Paris Agreement limits – 1.5-1.9C of global warming. At the same time, the area at risk of transition increases from around one-third to around two-thirds to three-quarters.
CB: In your paper, you say that crossing a tipping point is “not inevitable” – can you elaborate?
NW: In a way, for the Amazon rainforest, we’re in a better situation than with other tipping elements, because we have multiple options for improving our situation. One is we can stop global warming – we can stop emitting and curb emissions before we reach the 2C target. That’s important for the Amazon rainforest. But crucial for the Amazon rainforest is that deforestation levels are halted below 22-28%.
And, indeed, current trends across the Amazon rainforest show that efforts to decrease deforestation are in place and they seem to work. If these trends continue, then I’m mildly optimistic that we will not reach 22-28%. But, if you would have asked me the same question five years ago, I might have said that, well, by mid-century, these values could be reached.
Watch, read, listen
AFRICA RENEWABLES: A CNBC Africa TV report examined the continent’s “renewables rise” and the “shift from climate policy to energy security”.
‘CLIMATE MONSTER’: New York Times writer David Wallace-Wells has a long read on the approach of “perhaps the most fearsome El Niño since before scientists even began modeling them”.
SANTA MARTA SUMMIT: For the Conversation, two political researchers lay out “four dynamics to watch” to determine whether the first conference on transitioning away from fossil fuels in Santa Marta, Colombia “becomes more than rhetoric”.
Coming up
- 8-9 May: Association of Southeast Asian Nations (ASEAN) leaders summit, Cebu, Philippines
- 10-14 May: Intergovernmental Panel on Climate Change Working Group III second lead author meeting for the seventh assessment report, Riyadh, Saudi Arabia
- 11-12 May: Organisation for Economic Co-operation and Development (OECD) ministerial council meeting, Paris
- 11-15 May: 21st session of the UN forum on forests, New York
- 12 May: Bahamas election
Pick of the jobs
- Carbon Brief, journalism internship | Salary: £14.80 per hour (London Living Wage). Location: London/hybrid
- Secure Energy Project, campaign director | Salary: $50,000. Location: Brazil (remote)
- Commonwealth Secretariat, adviser on climate change | Salary: £80,672. Location: London
- Politico, deputy editor, Congress (energy and environmental policy) | Salary: Unknown. Location: Arlington, Virginia
DeBriefed is edited by Daisy Dunne. Please send any tips or feedback to debriefed@carbonbrief.org.
This is an online version of Carbon Brief’s weekly DeBriefed email newsletter. Subscribe for free here.
The post DeBriefed 8 May 2026: EU eyes fossil-fuel exemptions | Wind and solar save UK ‘£1.7bn’ | Amazon ‘tipping point’ appeared first on Carbon Brief.
The UN body that regulates mining in international waters has defended its authority over ocean governance after two subsidiaries of deep-sea mining firm The Metals Company (TMC) launched legal action to halt an investigation into their conduct.
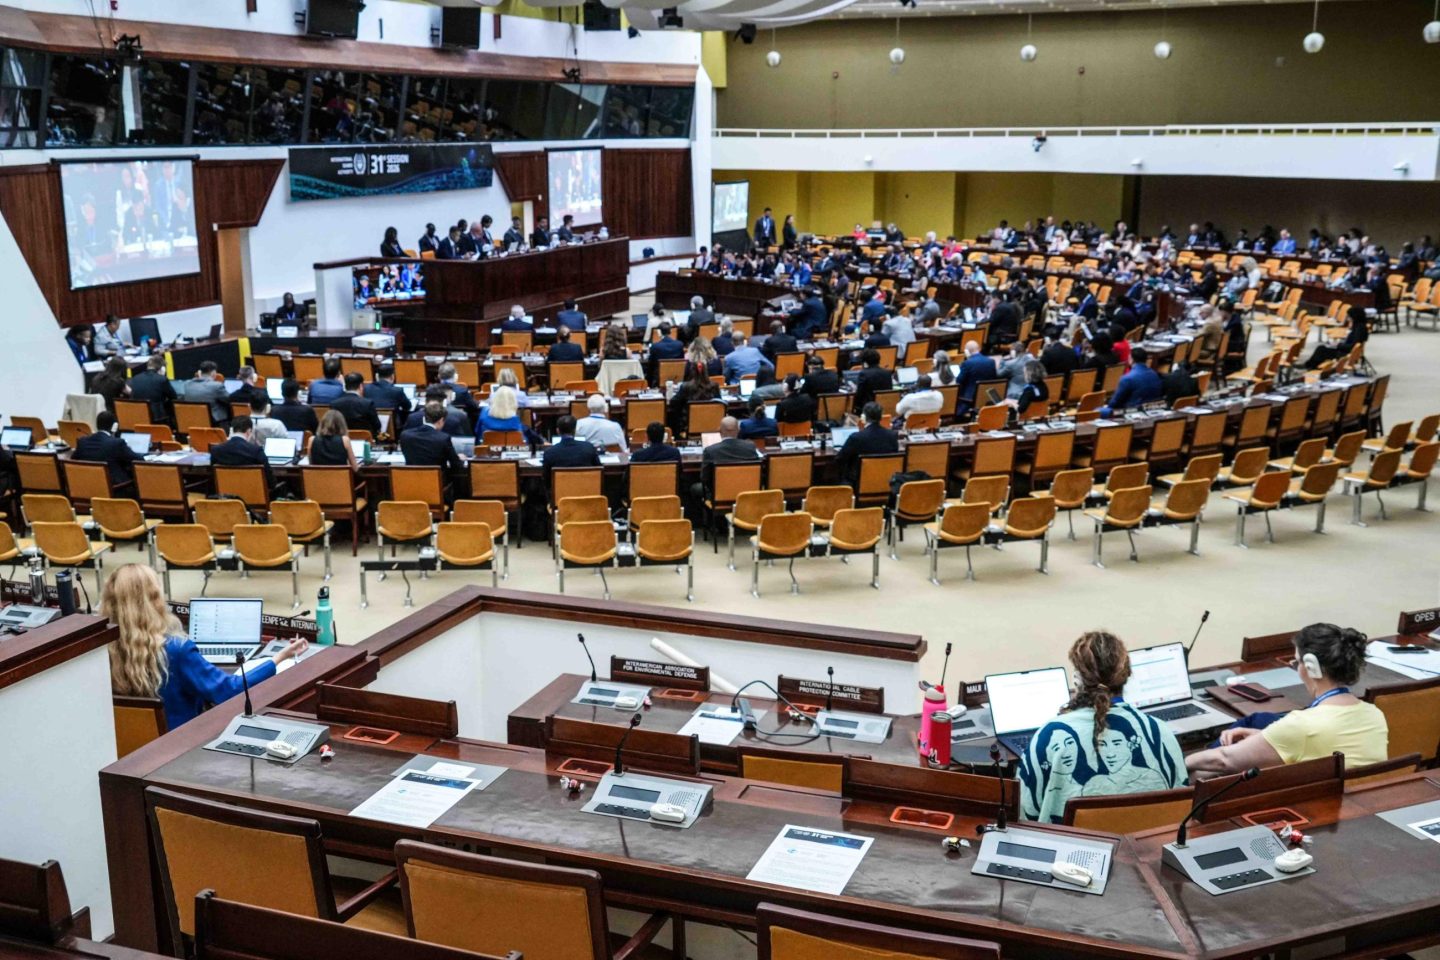
Speaking at the International Seabed Authority’s (ISA) annual meeting in Kingston on Monday, secretary-general Leticia Carvalho said the regulator’s role “matters more than ever” as governments grapple with growing pressure to exploit the deep seabed for minerals needed for the energy transition.
“The deep seabed belongs to no single country and no corporation; it belongs to all of us,” Carvalho said, describing its resources as “the common heritage of humankind”.
“If we lose sight of this,” she added, “we risk repeating on the ocean floor the same injustices and destruction we still strive to remedy on land.”
The conflict stems from TMC’s attempt to bypass the UN process by applying for US-sponsored ocean mining permits offered last year by the Trump administration. The Canadian firm aims to become the first company to mine the seabed for minerals like nickel, rare earths and manganese used in the production of both clean energy technologies and military equipment.
Several governments, including China, condemned the move as a “violation of international law”. In response, ISA member states agreed to open an inquiry into its licence-holders – among them two of TMC’s subsidiaries – to make sure they have complied with international law. If they are ultimately found to have breached those obligations, their exploration contracts could be revoked.
In June, the two TMC subsidiaries – Tonga Offshore Mining Ltd (TOML) and Nauru Ocean Resources Inc (NORI) – filed claims against the ISA at the International Tribunal for the Law of the Sea (ITLOS), asking the court to suspend the inquiry while the case proceeds. The companies argue they are being targeted “without lawful procedural basis”, “in breach of due process”, and without “good faith”.
Environmental groups have accused The Metals Company of using legal tactics to block the investigation into its subsidiaries.
“We find ourselves in this Orwellian situation where these companies are trying to effectively get an injunction against the ISA from continuing its inquiry,” said Louisa Casson, who leads Greenpeace’s global campaign against deep-sea mining.
“The stakes are so high and that’s why we’re seeing this pretty extraordinary move to try to get an injunction against the ISA,” she added.
-
Trump throws lifeline to Canadian deep-sea miner, setting scene for international clash
US president’s executive order looks like a victory for Vancouver-based The Metals Company (TMC) and other industry advocates, but fierce environmental and international opposition still stands in the way of ocean floor mining -
UK government faces legal challenge over deep sea mining permits to “opaque” firm
Greenpeace says UK may have acted unlawfully by transferring deep-sea mining licences to firm with US ties -
Loss and damage fund delays first project approvals as needs dwarf resources
The new Fund for Responding to Loss and Damage faces an overwhelming number of initial requests for its limited pot of money and board members decided to take more time to choose which to back first


Mining the deep ocean floor
The ISA has been negotiating a mining code for the deep ocean floor for over 12 years without success. Nearly 40 governments, including the UK, France and Germany, have called for a moratorium or precautionary pause on deep-sea mining until there is sufficient scientific evidence that it can proceed without causing serious harm to marine ecosystems.
Rather than wait for the UN process, industry frontrunner, The Metals Company, decided to apply for US permits offered by the Trump administration last year. In May, the US National Oceanic and Atmospheric Administration (NOAA) certified TMC’s application to explore 120,000 square kilometers of sea floor.
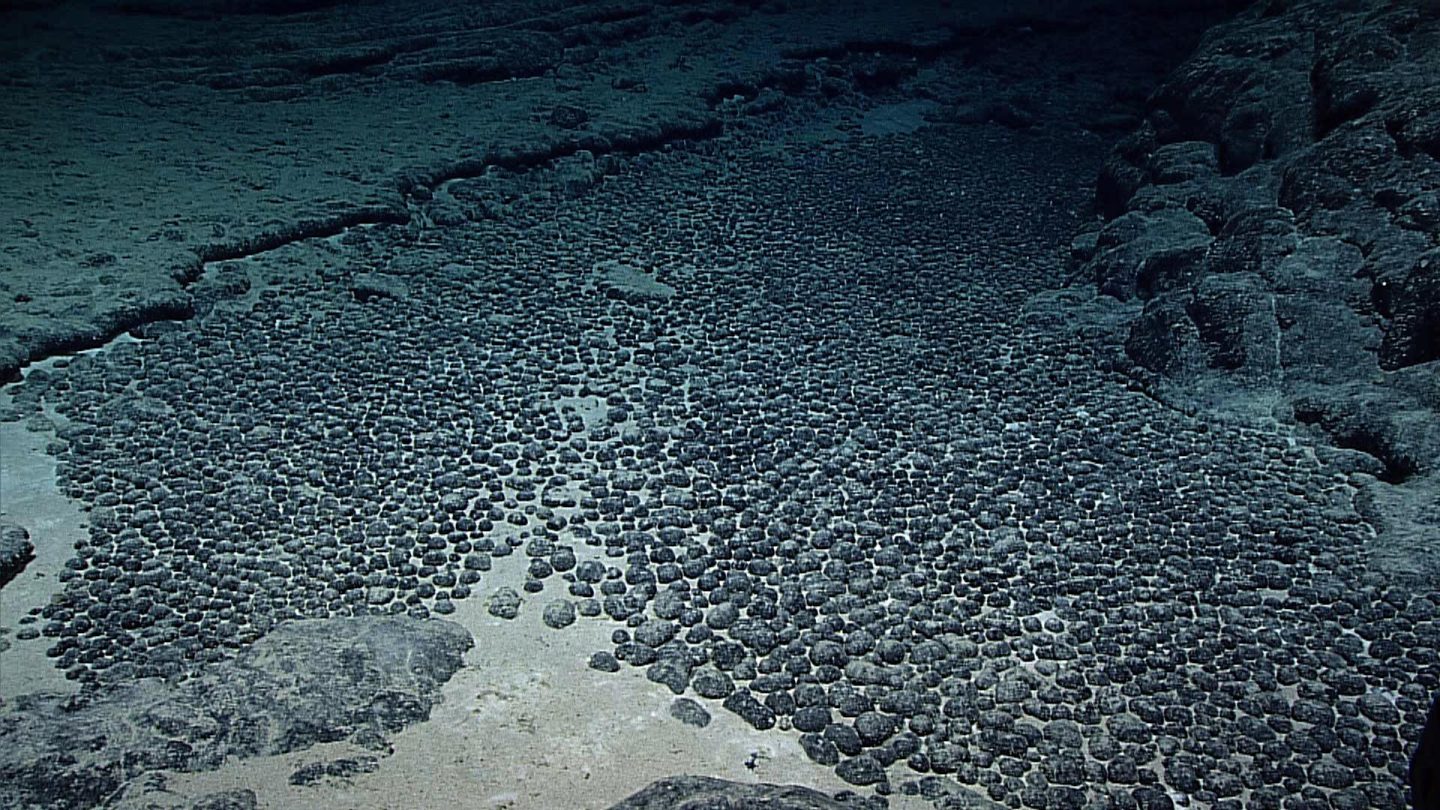
The firm wants to mine an area in the Pacific known as the Clarion-Clipperton Zone, which holds critical minerals inside potato-sized rocks found in the deep ocean floor known as polymetallic nodules. The minerals like manganese, nickel and rare earths are used in clean energy technologies like batteries and wind turbines.
But the area is also a little-understood ecosystem inhabited by thousands of unnamed species. The International Union for Conservation of Nature (IUCN), the world’s largest environmental network, says mining this area would threaten the existence of over half of all molluscs reliant on deep-sea vents.
Governments launch inquiry
Seeking to discourage companies from bypassing the UN process, the ISA’s member states unanimously agreed to open an inquiry into whether holders of its exploration licences complied with their contractual obligations under the UN Convention on the Law of the Sea (UNCLOS).
“The stage we’re at now is countries grappling with what they can do about this. What tools do they have to constrain this pathway that would go against international law,” Casson said.
Both NORI and TOML continue to hold ISA exploration contracts in the Clarion-Clipperton Zone. NORI’s license, however, expires later this month on July 21st and is up for review.
The inquiry is currently ongoing, but Casson said that if governments decide to cancel NORI’s license, other firms could apply for the ISA permit and compete for mining rights in the area.
“If that happens, it could really put into jeopardy TMC USA’s application (for US permits) because then suddenly that area could be open for a competing claim,” she explained. “At the moment, TMC is trying to kind of play both sides and shore up the area so that there will be no competition.”
Deep-sea mining firms push back
The cases before ITLOS are the first contentious disputes over deep-sea mining to reach the court designed for maritime disputes and the first brought directly by private contractors against the ISA. Among the companies’ legal advisers is former ISA secretary-general Michael Lodge.
Both NORI and TOML claimed that, unless the inquiry is suspended, there is a “real
and imminent risk of prejudice” that “may have significant legal and practical consequences” for
their activities.
The claim was backed by the Pacific island nation of Nauru, which has sponsored TMC’s push to mine the Clarion-Clipperton Zone and would benefit from the economic activity. The country raised “concerns on the adherence of due process with respect to the treatment of NORI”.
The mining companies allege that the ISA has singled them out among other applicants by requesting additional documentation, and that the UN auditors did not give them an opportunity to “meaningfully respond” to their concerns.
The ISA rejected those allegations as “wholly unsupported assertions”. It added that, given TMC’s application for US mining permits, it had done “what any reasonable regulator would do”: with the unanimous support of member states, it opened an inquiry simply to establish the facts.
Delay tactics
A decision from the maritime court is now expected by July 18, which has added to a “climate of significant regulatory uncertainty”, according to global law firm HSF Kramer.
As ISA countries meet in Kingston this week, the court’s president asked them “not to act in any way that could hinder any order” the court may make.
At the hearing representing the ISA, renowned human rights lawyer Philippe Sands said the deep-sea mining firms were engaging in “strategic litigation” meant to delay the inquiry and send the ISA into a years-long legal process.
“It’s a delaying tactic, and nothing would make them happier than for you to kick this into the long grass for two years while you sort out the merits. That is what they want this Tribunal, the Chamber, to do. You are being instrumentalized in this process,” Sands told the judges.
The post UN seabed regulator defends authority as mining firms seek to halt inquiry appeared first on Climate Home News.
UN seabed regulator defends authority as mining firms seek to halt inquiry
The UK’s incoming prime minister Andy Burnham has remained tight-lipped on his views on climate change during his leadership campaign.
When asked his views on reversing Labour’s manifesto pledge to stop new North Sea drilling in June – a move that the oil-and-gas industry and right-wing media have pushed for in recent months – he said he had “something of an open mind” on the issue.
But a trawl of Burnham’s past comments about climate change, net-zero and fossil fuels reveals a different picture.
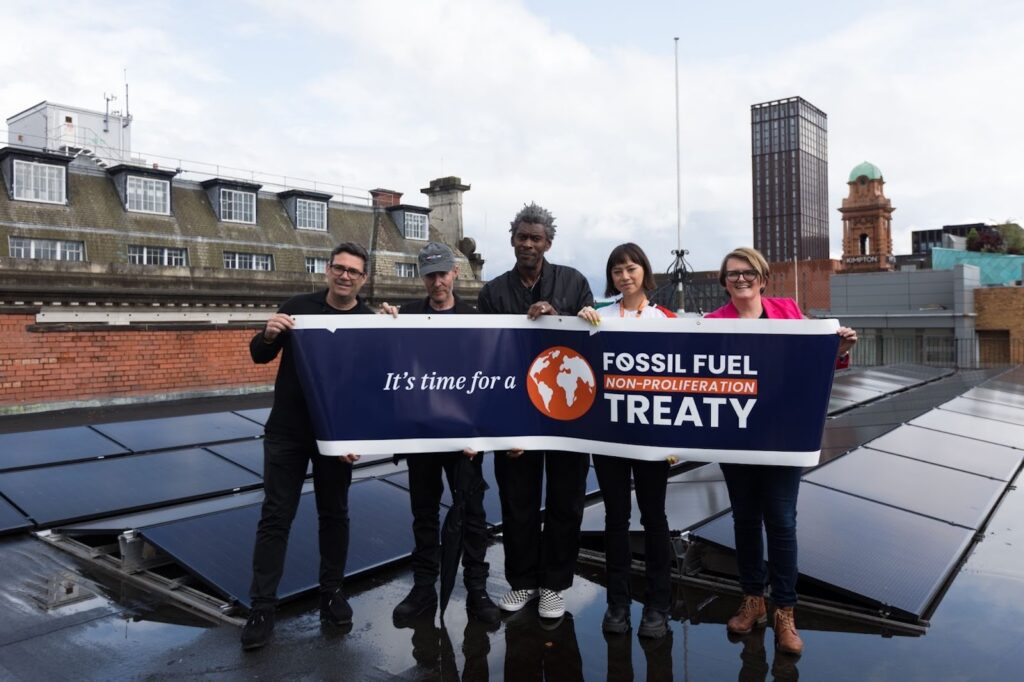
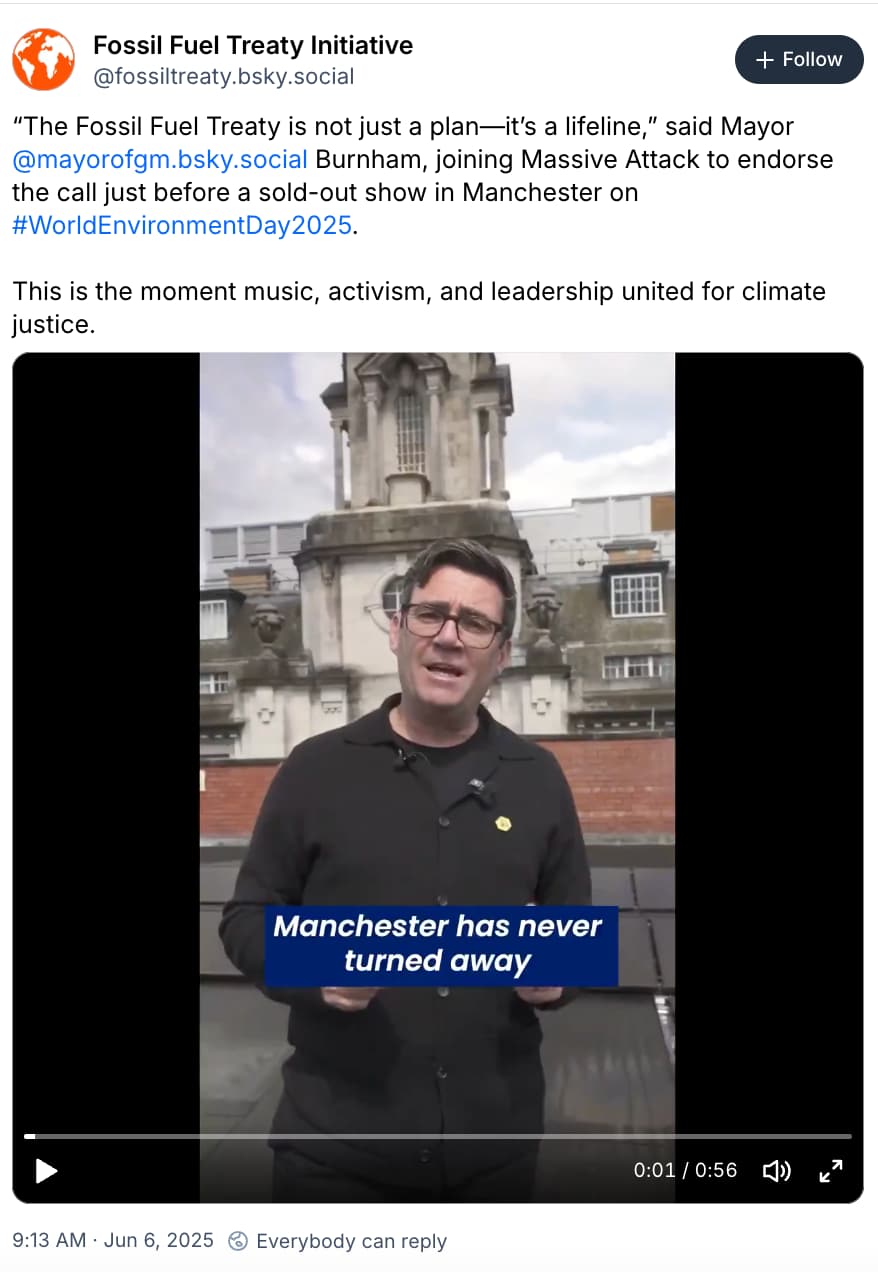
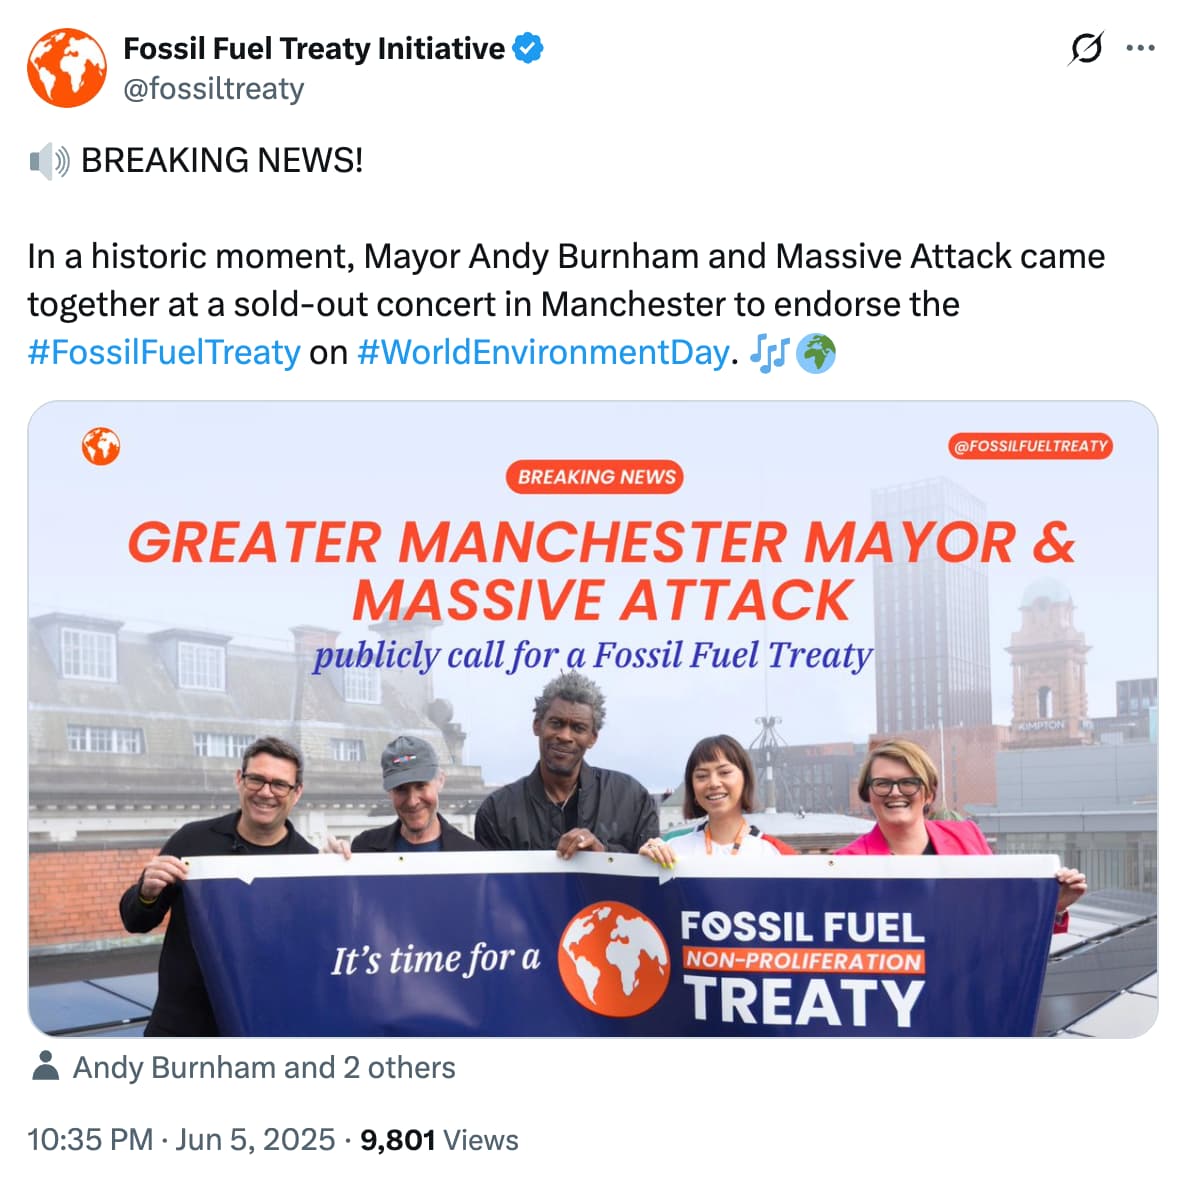
Just a year ago in June 2025, Burnham, while mayor of Greater Manchester, gave his support to the fossil fuel treaty – a proposed international pact on phasing out coal, oil and gas – calling it a “lifeline” that “all governments” should join.
In a video message endorsing the treaty, he also said that “there should be no turning away from net-zero”.
During his last bid to be Labour leader in 2015, he used similar language, saying:
“Labour under my leadership will never turn our back on either our duty to tackle climate change or the prospects offered by the green economy.”
Burnham has spoken about the threat of climate change since at least 2008, noting in 2021 that accelerated action could “create thousands of good jobs”, but also warning that net-zero risked becoming the “next Brexit”.
Burnham is yet to appoint his cabinet, but there is much speculation that he will select current net-zero secretary Ed Miliband as his chancellor – with their ally Miatta Fahnbulleh having a “strong chance” of taking Miliband’s former position.
Below, Carbon Brief recounts 28 things that Burnham has said about climate change, net-zero, fossil fuels, energy and transport.
Climate change
“Tackling climate change isn’t just about protecting the planet – it’s a powerful opportunity to build a fairer, greener future for our communities and businesses.”
Calling for local councils to be given more power and money for climate action, 29 November 2025
“There is little doubt that Greater Manchester’s biodiversity has taken a hit over the years, with habitats being lost, destroyed and becoming less diverse due to the impact of development, climate change, pollution and invasive species…We are committed to delivering a city-region for all residents to enjoy – a fairer, greener and more prosperous place for everyone.”
Statement after Greater Manchester declared a “biodiversity emergency”, 25 March 2022
“Over the next decade, if we accelerate our response to the climate crisis, we can create thousands of good jobs, improve homes, overhaul our transport system and make [Manchester] an even better place to live.”
Greater Manchester Green Summit, 18 October 2021
“The environment has never been higher on the national and international agenda.”
Statement after visiting a peat bog restoration project in England, 9 January 2020
“I think climate change [action] will be driven more quickly from the bottom up, if I’m honest. It’s the will of evolution if you wait for the government to act…When governments aren’t listening you get out and get your voice heard…so I think [climate protesters] deserve our encouragement, not our criticism.”
Speaking to Manchester Evening News at a student climate protest in Manchester, 24 May 2019
“Labour under my leadership will never turn our back on either our duty to tackle climate change or the prospects offered by the green economy.”
Labour leadership candidate speech, 15 July 2015
“Climate change can seem a distant, impersonal threat – in fact the associated costs to health are a very real and present danger…We need well-designed climate change policies that drive health benefits.”
Speaking to the Guardian about a study on climate and health, 25 November 2009
“The Stern report on the economics of climate change has changed the debate, in this country and around the world. It made it clear that the people who could suffer most from a failure to tackle climate change, or from a lack of ambition in our approach to it, are those living in the developing countries. They are the most vulnerable…[and] Stern said that the cost of not acting would be large. That is why the government took various measures in the recent spending review to ensure that we are prepared to face the challenges posed by climate change.”
Speaking in the UK parliament on the economic impacts of climate change on his final day as chief secretary to the Treasury, 24 January 2008
Net-zero
“There should be no turning away from net-zero.”
Speaking after giving his support to the fossil fuel treaty – a proposed global pact to introduce laws to phase out coal, oil and gas – on behalf of Manchester, 6 June 2025
“An opportunity is opening up for Britain as other countries move away from net-zero. We should seize that…We can make Britain a green leader. This is not the time to tiptoe, it is the time to commit to this path.”
Speaking at Innovation Zero World Congress in London, 29 April 2025
“[We] need a government that fully buys into the 2038 vision because the UK will not get to 2050 unless places like Greater Manchester are freed up to go faster – and we’re ready to go faster.”
Speaking about Greater Manchester’s aim to reach net-zero by 2038, 19 October 2022
“In Greater Manchester we have plans to build 30,000 net-zero social rented homes because we recognise that a successful city region needs good quality, affordable accommodation for everyone.”
Speech on the future of cities, 24 June 2022
“By building a broad consensus behind the drive to net-zero, we can ensure that the transition is a fair one that delivers social justice as well as climate justice. This is an opportunity for all of us to show how cutting carbon emissions in our cities can make a real difference to our communities – away from the abstractions and rooted in the real world.”
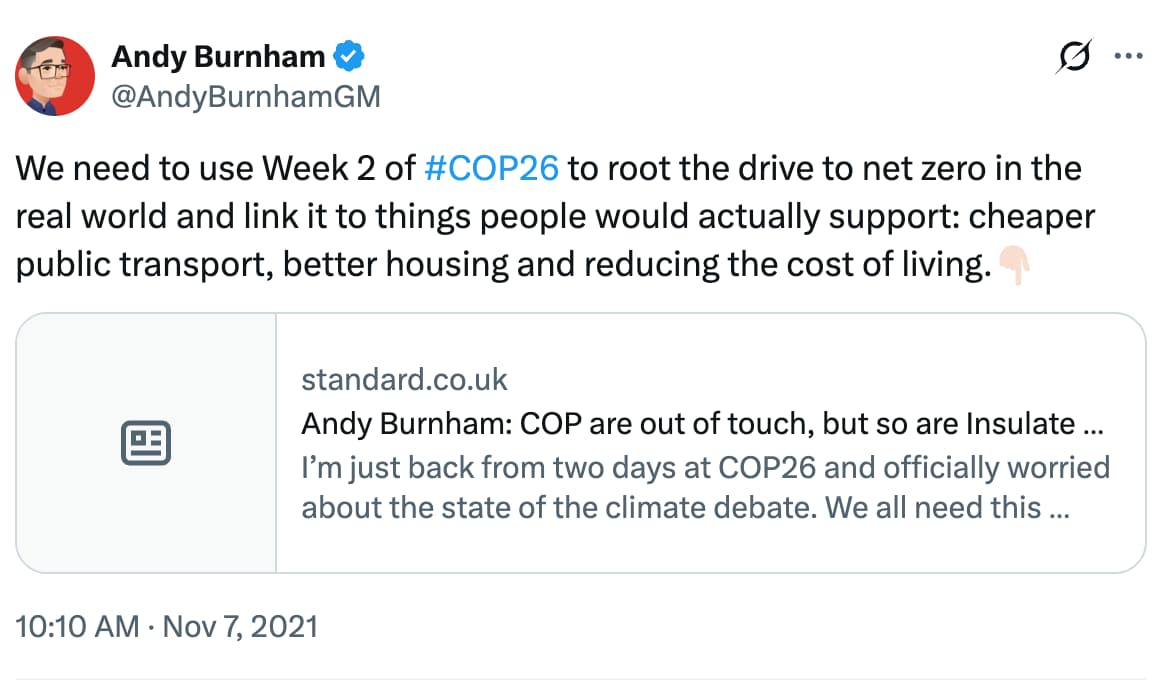
Panel discussion in Glasgow during the COP26 climate summit, 12 November 2021
“To the extent that people have picked up anything from COP26, it’s a sense that the drive to net-zero will mean cost and inconvenience for ordinary people and offsetting for the wealthy and entitled. All of a sudden, you can feel how net-zero could become the new Brexit – a debate that gets very divided on class grounds…This has got to be a wake-up call. We cannot let this happen. We need to act now to build a broad social consensus behind the drive to net-zero. How to do that? It starts with taking control of the climate narrative from those steering it in the wrong direction and turning it around…We must show how, if done in the right way, the drive to net-zero is actually an opportunity to reduce the cost of living; to make people’s lives better and society fairer.”
Writing for the London Standard, 5 November 2021
“The drive to net-zero is a chance to re-industrialise the north of England, this time in a clean way. Create really good jobs, future-facing jobs for people, better public transport, improve people’s homes…If we go quickly towards net-zero, it’s the quickest way to level up the country.”
ITV interview at COP26, 1 November 2021
“If we really embrace the drive to net-zero, that is the route to level up the country…But it needs substantial investment, upfront, now, of the kind that Rachel Reeves, shadow chancellor [and chancellor under Keir Starmer’s government], has been talking about. We need long-term predictable funding.”
Interview with GB News at COP26, 1 November 2021
“I would have preferred to hear slightly less about carbonated wine and much more about a decarbonised economy.”
Referencing a UK budget, which included tax cuts for sparkling wine and other drinks, 28 October 2021
“Decarbonising is not just about lowering costs on to people. It’s the route to get better, cheaper public transport. It’s the route to getting homes that are cheap to run. It’s actually the way we can create thousands of good jobs for the people who live in Greater Manchester. This is the route to levelling up the country by going further and faster on decarbonisation.”
Speaking to Manchester Confidential, 20 October 2021
“[I am] asking people to stop seeing the environmental agenda as a cost and a burden agenda. I think this is a barrier that we’ve got to get over. Already in the media interviews I’ve done today, people are saying ‘can you afford it?’, ‘can it be achievable when times are tough?’.
“My answer to that is, at some point in the 21st century, all homes will be zero-carbon. At some point in this century, all buildings of any kind will be zero-carbon…All cars will be zero-carbon, all public transport will be zero-carbon…The question is: when? And surely the places that embrace those things first are putting themselves in a position of economic strength when it comes to facing up to the future. Rather than seeing the whole agenda as a burden, we’ve got to see it for the benefits that it can bring.
“There may be a greater upfront cost in a zero-carbon home, but let’s stop thinking, as we tend to do in Britain, of the short-term, the short-termist approach to life. Surely let’s start talking to the public about the lifetime cost.”
Greater Manchester Green Summit, 21 March 2018
Fossil fuels
“I’ve got something of an open mind, you know. I don’t have a sort of fixed position.”
Speaking on the issue of new North Sea oil and gas in a New Statesman interview, 3 June 2026
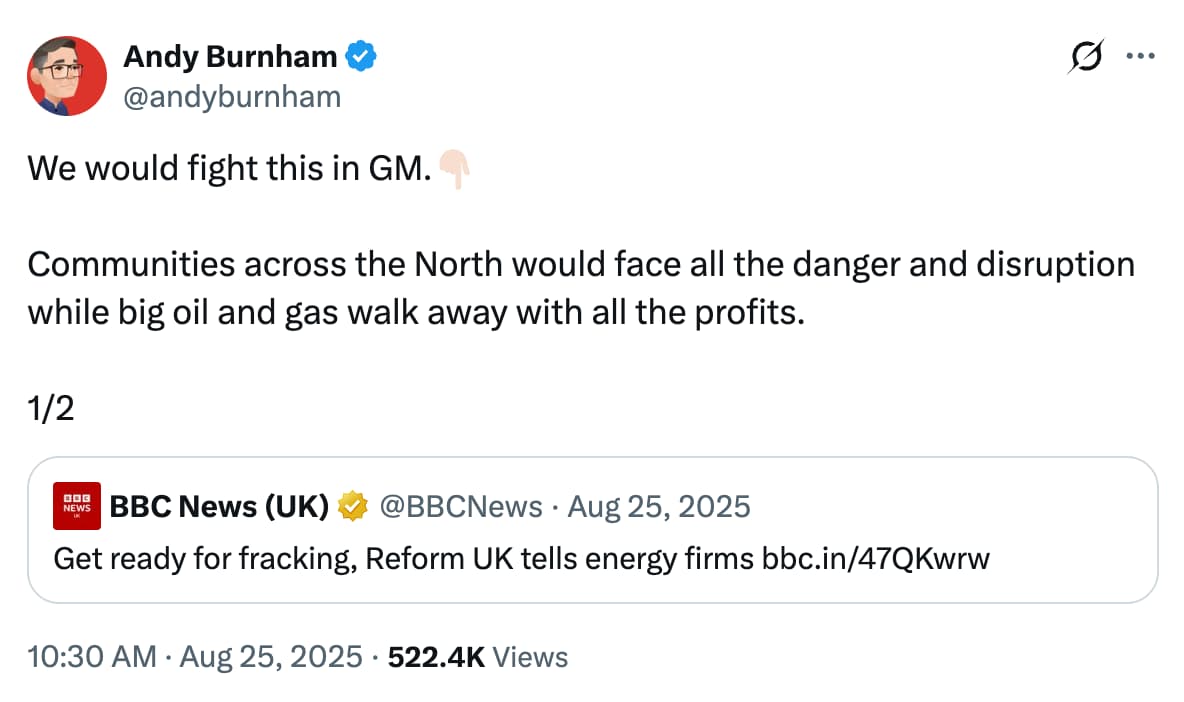
“We would fight this in GM [Greater Manchester]…Communities across the north would face all the danger and disruption while big oil and gas walk away with all the profits.”
In response to Reform’s call for fracking, on X, 25 August 2025
“I am proud to endorse the fossil-fuel treaty proposal today on behalf of Greater Manchester. It’s not just a plan – it’s a lifeline. It’s a call to end coal, oil and gas, hold polluters accountable…I urge all governments, nationals and subnationals to join this fight.”
Statement upon endorsing the fossil-fuel treaty, 5 June 2025
“Fracking is the past, it is not the future.”
Speech at London climate protest, 20 September 2019
“I have called for a moratorium on fracking. Far too many potential risks and unanswered questions.”
On X, 22 June 2015
Energy and transport
“What I would do, if successful, is lay out a plan for more public control over water, energy, transport, so that over the period we can get those bills down, fares down, and give people and give businesses breathing space.”
LBC interview, 2 July 2026
“I am all in favour of tough decisions at a national level. I don’t believe there should be a third runway at Heathrow, for instance. But I think those are decisions for national government.”
Guardian interview, 13 June 2019
“There is a debate to be had about aviation, isn’t there? There are changing public attitudes about aviation. Rather than just saying no to people flying, don’t we need to accelerate research into low and zero-carbon forms of aviation?”
Guardian interview, 13 June 2019
“Today, I stand alongside the mayors of some of the greatest cities in the world. I’m committed to a cleaner, greener and healthier future for Greater Manchester. Around a third of greenhouse gas emissions in our city-region come from transport.”
When signing the C40 Fossil-Fuel-Free Streets Declaration, which includes support for zero-emissions vehicles and walking and cycling, on behalf of Manchester, 14 September 2018


The post 28 quotes from next UK leader Andy Burnham on climate, net-zero and fossil fuels appeared first on Carbon Brief.
28 quotes from next UK leader Andy Burnham on climate, net-zero and fossil fuels
Suresanathan Murugesu is the country director of Action Against Hunger in the Philippines
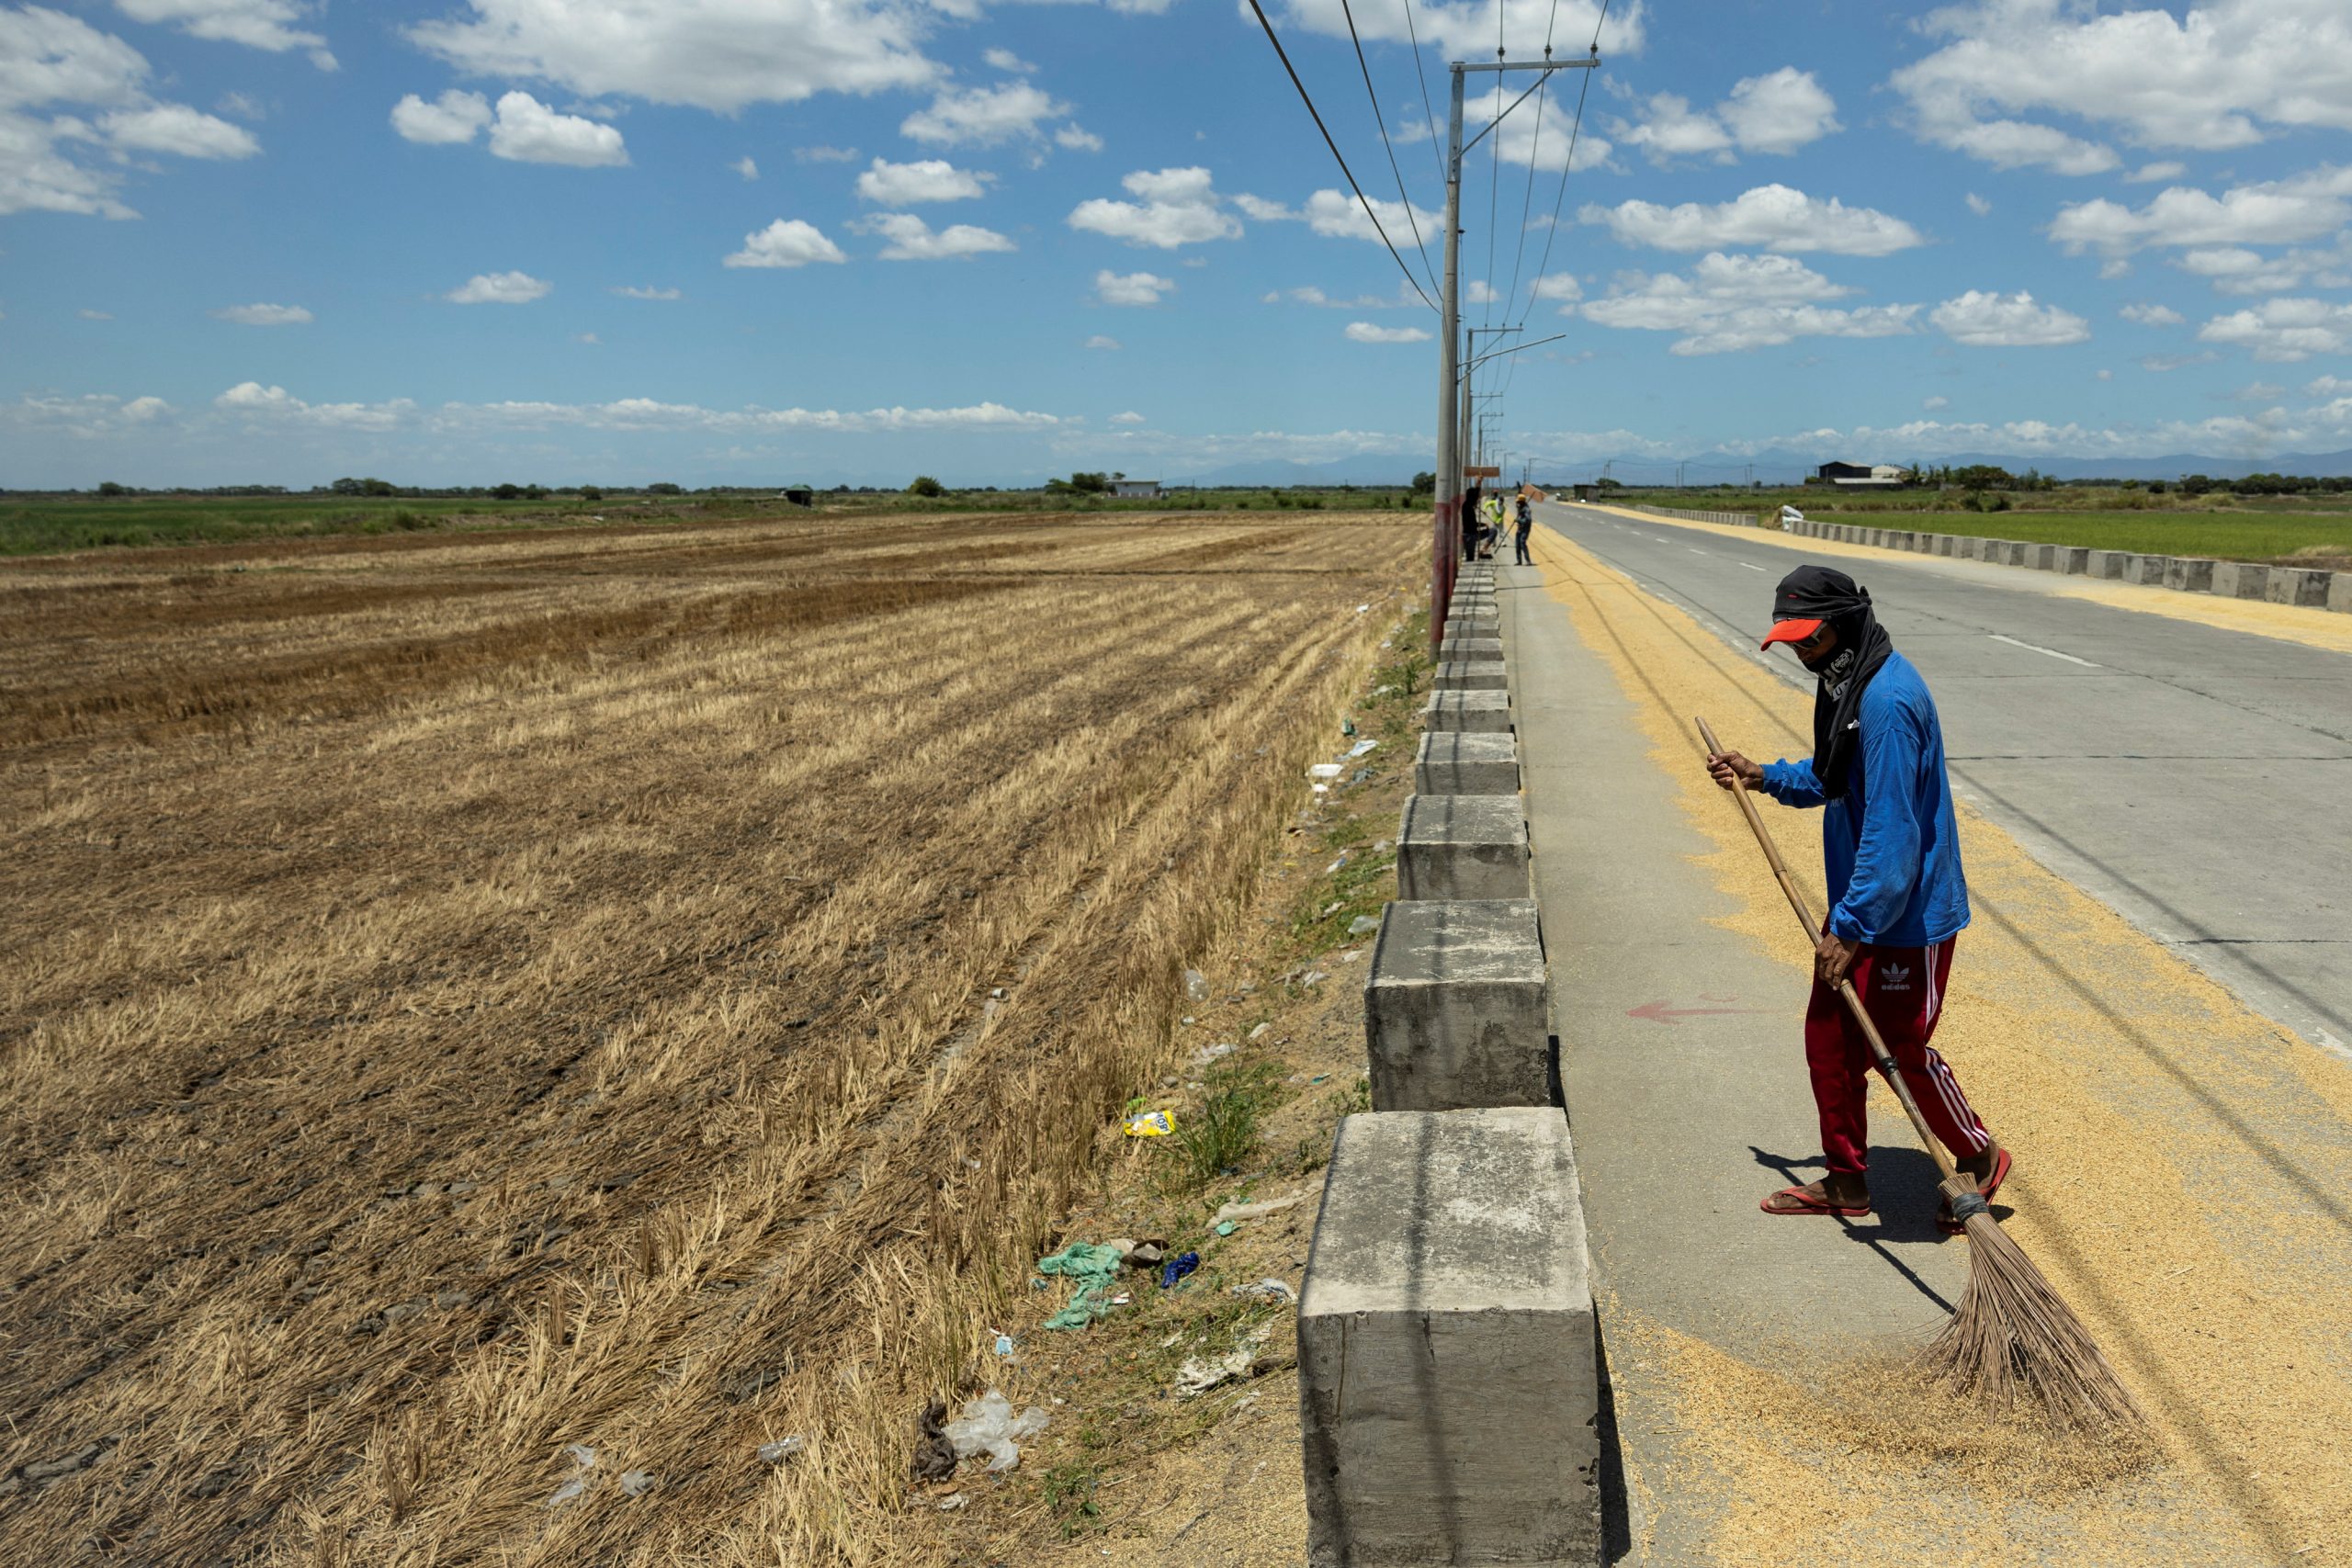
The Philippines is caught in an extreme weather trap. Here, forecasts for a strong El Niño in the months ahead do not just indicate a period of drought – they also point to torrential rain and flooding.
It could hardly come at a worse time, threatening communities that are still struggling to recover from previous typhoons, such as last year’s Typhoon Tino, as well as two strong earthquakes – in Cebu in September 2025 and last month’s 7.8-magnitude quake in Mindanao.
Forecasts point to the arrival of one of the most intense El Niños in recent history this year and into 2027, with the United Nations warning that it could be the strongest in decades around the world.
The peak of the El Niño is expected towards the end of the year, but the weather phenomenon is already estimated to have caused agricultural losses of nearly €30 million (£25.9 million), potentially affecting the livelihoods of 4 million farmers.
-
Scientists warn El Niño could intensify climate extremes in 2026
Climatologists say a particularly powerful weather pattern could amplify wildfire risk, heatwaves and flooding worldwide as global temperatures continue to rise -
WHO issues new guidance on heat-health action plans, as El Niño sets in
Amid warnings of “unprecedented” weather extremes this year, the World Health Organization urges governments to strengthen protections for vulnerable groups -
Philippines storm victims to seek damages from Shell in “unprecedented” climate claim
The case is the first civil claim to directly link an oil firm’s climate impact to deaths and personal injury in the Global South, its backers say


On the climate frontline
For many, El Niño is a figure in a report or a distant headline, but for those of us who live and work on the ground, it is a reality that is already hitting the most vulnerable families.
When I travel through the communities of the Bangsamoro Autonomous Region – in the south – or speak with families on the island of Siargao or in the Zamboanga region, I do not see data or graphs.
I see a father looking at his cracked rice field, wondering how he will pay off the debts from a harvest that is already lost before it has even begun. I see a mother walking under a relentless sun because her village’s well has dried up, carrying the water that sustains the health of her children and her entire community.
And what we are seeing today – 26 provinces experiencing drought and millions of dollars in agricultural losses – is only the beginning.
Loss and damage fund delays first project approvals as needs dwarf resources
Many Filipino families are still trying to rebuild and recover after last year’s typhoons and the two earthquakes. In Mindanao, where the recent magnitude 7.8 earthquake displaced more than 90,000 people and destroyed over 19,000 houses, uncertainty remains about when the people will be able to fully recover and return home.
Today, they are trying to protect the meagre possessions they have and, if they are lucky enough to have their home unscathed by typhoons and earthquakes, their homes from flooding; tomorrow, they will have to survive the hardship and impact of drought.
The effects of El Niño threaten to exacerbate their troubles.
Struggle for basic needs
Many low-income Filipino families already face significant challenges to meet their basic needs.
In our daily visits, we see how life is becoming increasingly difficult for millions of people. Rising fuel and transport costs are driving up the price of basic foodstuffs, making them unaffordable for many families. At the same time, crop failures and income losses are leaving households without livelihoods, while disasters contribute to further suffering.
But we are not just talking about hunger. We are talking about health, safety and dignity. Water shortages are forcing many people to resort to unsafe sources, increasing the risk of disease. And, as is the case in so many crises, it is the most vulnerable who bear the heaviest burden: walking long distances every day to fetch water or food, enduring enormous physical strain and facing risks of violence and insecurity.
Building resilience
Faced with this reality, our response is based on a simple idea: to be there before the crisis reaches its most critical point. At Action Against Hunger, we work alongside communities to anticipate the situation, assessing the impact of the drought and activating early response mechanisms to protect their livelihoods and access to water.
We translate climate forecasts into concrete action plans: from support for farmers to programmes ensuring safe water. All of this is done in coordination with local authorities and international partners, because we know that what we do today will make the difference tomorrow.
The hardest months are yet to come. But the question is not just what will happen, but what we are doing now to prevent it. How many tables will remain empty and how many children will see their health compromised will depend on our ability to act in time.
We cannot stop El Niño. But we can prevent it from becoming a crisis of human dignity. We cannot afford to look the other way whilst the earth cracks and opportunities disappear. Because behind every statistic, there is a family struggling to get by. And that is a reality we cannot ignore.
The post A strong El Niño spells more climate pain for the Philippines appeared first on Climate Home News.
A strong El Niño spells more climate pain for the Philippines


-
Greenhouse Gases11 months ago
Guest post: Why China is still building new coal – and when it might stop
-
Climate Change11 months ago
Guest post: Why China is still building new coal – and when it might stop
-

 Greenhouse Gases2 years ago
嘉宾来稿:满足中国增长的用电需求 光伏加储能“比新建煤电更实惠”
-

 Climate Change2 years ago
嘉宾来稿:满足中国增长的用电需求 光伏加储能“比新建煤电更实惠”
-
Climate Change2 years ago
Bill Discounting Climate Change in Florida’s Energy Policy Awaits DeSantis’ Approval
-

 Renewable Energy9 months ago
Sending Progressive Philanthropist George Soros to Prison?
-

 Carbon Footprint2 years ago
US SEC’s Climate Disclosure Rules Spur Renewed Interest in Carbon Credits
-
Greenhouse Gases12 months ago
嘉宾来稿:探究火山喷发如何影响气候预测