
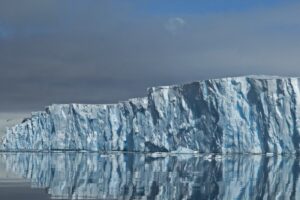
Arctic sea ice has recorded its smallest winter peak extent since satellite records began 47 years ago, new data reveals.
Provisional data from the US National Snow and Ice Data Center (NSIDC) shows that Arctic sea ice reached a winter maximum extent of 14.33m square kilometres (km2) last week.
This is 1.31m km2 below the 1981-2010 average maximum and 800,000km2 smaller than the previous low recorded in 2017, according to the data.
Dr Julienne Stroeve, a senior scientist at the NSIDC, tells Carbon Brief that such a small winter peak “doesn’t mean a record-low” summer minimum will necessarily follow in September.
But, she adds, it does “continue the overall long-term decline in the ice cover”.
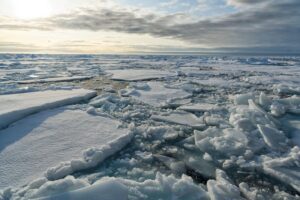
Meanwhile, Antarctic sea ice reached its summer minimum extent earlier this month, with 2025 tying with 2022 and 2024 for the second-smallest summer low on record, the NSIDC says.
The combination of reduced sea ice cover in both the Arctic and Antarctic means that global sea ice extent dwindled to an “all-time minimum” in February this year, according to the Copernicus Climate Change Service (C3S).
Record low
Arctic sea ice extent changes throughout the year. It grows during the winter towards its annual maximum extent – often referred to as its “winter peak” – in February or March. It then melts throughout the spring and summer towards its September minimum.
Using satellite data, scientists can track the growth and melt of sea ice, allowing them to determine the size of the ice sheet’s winter maximum extent. This is a key way to monitor the “health” of the Arctic sea ice.
On 22 March 2025, Arctic sea ice reached its smallest-ever winter peak, according to the NSIDC. At 14.33m km2, this was 1.31m km2 below the 1981-2010 average maximum and 800,000km2 below the previous low, which was recorded in 2017.
The chart below shows Arctic sea ice extent over the satellite era (1978 to the present day). Red indicates the 2025 extent, while shades of blue indicate different years over 1978-2024.

Daily Arctic sea ice extent (in millions of km2) over the satellite era (1978 to present), where lines indicate individual years. This year is shown in red, while darker blues indicate more recent years. The dashed line indicates the record low winter peak. Credit: Carbon Brief
NSIDC senior research scientist Dr Walt Meier told the Press Association:
“This new record low is yet another indicator of how Arctic sea ice has fundamentally changed from earlier decades. But, even more importantly than the record low, is that this year adds yet another data point to the continuing long-term loss of Arctic sea ice in all seasons.”
Freeze season
The growth season for Arctic sea ice kicked off after reaching its summer minimum extent of 4.28m km2 on 11 September last year. This was the Arctic’s seventh-lowest summer low on record.
As temperatures cooled, the NSIDC says that Arctic sea ice grew slowly at the start of October. Ice growth then sped up towards the middle of the month and then slowed again towards its end. The average sea ice extent for October was 5.94m km2 – the fourth lowest on record, according to the NSIDC.
Throughout November, air temperatures over the Arctic Ocean were “mixed”, according to the NSIDC. It says that temperatures were above average from coastal Canada to northern Scandinavia, as well as in the area north of Greenland, but below average over the Beaufort, Bering and Laptev Seas.

Arctic sea ice grew at a steady pace for most of November – mainly in the Kara, Beaufort and Chukchi Seas, as well as Baffin Bay and the Canadian Arctic archipelago. However, in the Hudson Bay – where air temperatures were 1-5C above average – “no appreciable sea ice” formed, according to the NSIDC.
The November extent averaged 9.11m km2, ranking the third lowest in the satellite record and 1.59mkm2 below the 1981-2010 average, the NSIDC says.
December saw above-average air temperatures over “essentially all of the Arctic Ocean”, with a particularly “prominent” area of warmth off the Canadian Arctic archipelago and Greenland, the NSIDC says.
Due to delayed ice growth in the Hudson Bay and low extent in the northern Barents Sea, December Arctic sea ice extent was the lowest in the satellite record at 11.43m km2.

Daily Arctic sea ice extent decreased sharply at the end of January, when the region lost about 0.3m km2 – an area roughly the size of Italy – in less than a week, according to C3S.
It adds that “such a rapid decrease is unusual at this time of year, when sea ice is typically expanding towards its annual maximum”. It points to the “pronounced warm event” over the Greenland Sea and Svalbard region as the reason for the drop.
Dr Rick Thoman – a specialist in the Alaskan climate from the University of Alaska Fairbanks – tells Carbon Brief that the sea ice decrease in late January and early February was partially driven by “separate cyclones producing simultaneous south winds across much of the Barents and Bering Seas”. As winds pushed the ice northwards, “ocean wave action” melted the thin ice at the edge of the ice sheet, he says.
February was marked by slow Arctic sea ice growth, resulting in a record-low February Arctic sea ice extent of 13.75m km2, according to the NSIDC. The organisation adds that daily sea ice growth “stalled” twice in the month, which “helped to contribute to low ice conditions and led to overall ice retreat in the Barents Sea”.
This rapid melt was partially driven by above-average temperatures. Between northern Greenland and the north pole, temperatures reached up to 12C above average, the NSIDC says.

Antarctic melt
At the south pole, Antarctic sea ice has been declining during the southern hemisphere summer. It reached its annual minimum of 1.98m km2 on 1 March.
This summer low ties with 2022 and 2024 for the second-smallest Antarctic extent in the 47-year satellite record, the NSIDC says. It adds that the past four years are the only years on record in which Antarctic sea ice has reached a minimum below 2m km2.
The graphic below shows Antarctic sea ice extent over the satellite era. Red indicates the 2025 extent and shades of blue indicate different years over 1978-2023.

Daily global sea ice extent (in millions of km2) over the satellite era (1978 to present), where lines indicate individual years. This year is shown in red, while darker blues indicate more recent years. The dashed line indicates the record low. Credit: Carbon Brief
The melt season for Antarctic sea ice began with its winter maximum of 17.2m km2 on 19 September 2024.
This was 1.6m km2 smaller than the 1981-2010 average maximum and the second-lowest winter peak on record, according to the NSIDC.
As the southern hemisphere warmed, Antarctic sea ice began to melt. Throughout October, Antarctic sea ice extent continued to rank the second lowest on the satellite record following the record-breaking 2023 season, the NSIDC says.
It adds that “seasonal ice loss was relatively slow during the early part of the month, but the pace picked up substantially during the last week of October, approaching 2023 values”.
By 30 November, Antarctic sea ice was the third lowest on record, tracking higher than the 2023 and 2016 levels for the same date, the NSIDC says.

After a “prolonged period of record to near-record daily lows set in 2023 and 2024”, December 2024 saw Antarctic sea ice loss slow down, with the average rate of decline tracking “well below average”.
By the end of December 2025, Antarctic sea ice extent was roughly in line with the 1981-2010 average, according to the NSIDC.
As a result, it says that “speculation that the Antarctic had entered a new regime of strongly reduced Antarctic sea ice related to oceanic influences, has, at least temporarily, come to an end”.
It adds that sea ice extent was “above average over the western Weddell and Amundsen Seas and slightly below average in the Ross Sea, with near-average extents in other areas”.
Throughout February, Antarctic sea ice continued to melt – especially in the eastern Ross Sea and Amunsden sea, where ice concentration is low, according to the NSIDC.
Global ‘all-time minimum’
With sea ice at or around record lows in both the Arctic and Antarctic, global sea ice extent dropped to an “all-time minimum” in February this year, according to the Copernicus Climate Change Service (C3S).
Global sea ice hit a new daily low in early February and remained below the previous record from 2023 for the rest of the month, C3S says.
The graphic below shows global sea ice extent over 1978-2025, where red indicates the 2025 extent and shades of blue indicate different years.

Daily Antarctic sea ice extent (in millions of km2) over the satellite era (1978 to present), where lines indicate individual years. This year is shown in red, while darker blues indicate more recent years. The dashed line indicates the record low. Credit: Carbon Brief
C3S deputy director Dr Samantha Burgess noted that the low sea ice came as “February 2025 continues the streak of record or near-record temperatures observed throughout the last two years”. She added:
“One of the consequences of a warmer world is melting sea ice – and the record or near-record low sea ice cover at both poles has pushed global sea ice cover to an all-time minimum.”
The story was picked up in newspapers around the world, including the Guardian, Hindustan Times and Washington Post.
In response to the news from C3DS, Prof Richard Allan – a professor of climate science at the University of Reading – warned that “the long-term prognosis for Arctic sea ice is grim”. He added:
“Averaging over all regions the global warming trend is clear, with February 2025 more than 1.5C above pre-industrial conditions, repeating a level of excess warmth experienced in all but one of the past 20 months despite a weak cooling influence of La Niña conditions in the Pacific.”


The post Arctic sea ice winter peak in 2025 is smallest in 47-year record appeared first on Carbon Brief.
Arctic sea ice winter peak in 2025 is smallest in 47-year record
For the past two decades, low-level cloud cover has been declining, increasing the amount of sunlight absorbed by Earth and amplifying global warming.
As global temperatures have reached record highs in recent years, there has been concern that the decline in cloudiness may be enhancing warming more than previously expected.
In a new study, published in Atmospheric Chemistry and Physics Letters, we investigate how the decline in global cloudiness affects the Earth’s “energy imbalance” – the difference between absorbed solar energy and heat radiated into space that results in global warming.
This imbalance has more than doubled over the past 20 years, as greenhouse gases have trapped more heat in the atmosphere.
We find that, since 2003, the decrease of cloudiness has been responsible for half of the increase of Earth’s energy imbalance.
Analysing the drivers of global changes to cloud cover, we find that the decrease in cloudiness over the past two decades has been primarily driven by humans, rather than being caused by natural variations in Earth’s climate.
Taken together, our findings mean that scientists can even more confidently attribute recent warming to human activities.
Low-level clouds and warming
Low-level clouds are those that have a base below 6,500 feet (2,000 metres) above Earth and include stratus, stratocumulus and cumulus. They are typically found over large areas of the global ocean, where there is a large moisture supply from evaporation.
These clouds have a powerful impact on the Earth’s climate because they reflect a substantial fraction of incoming sunlight back into space.
By acting as the Earth’s “sunscreen”, they keep the climate cooler than it would otherwise be.
Satellite observations reveal a global decline in these low-level clouds since the turn of the millennium. This is shown in the chart below, where the black line represents the average percentage of the Earth covered by low-level clouds and the dashed line the downward trend.
Our research shows that the decline in cloudiness over the past 20 years has played a major role in increasing the Earth’s energy imbalance and, therefore, warming.
The Earth’s energy imbalance is the difference between the amount of energy arriving at the Earth from the sun and what is reflected and radiated back to space.
Rising greenhouse gas emissions from human activity are upsetting this balance by trapping more energy in the atmosphere, leading to warming.
A less cloudy atmosphere also helps supercharge the energy imbalance, because it means more sunlight reaches the Earth.
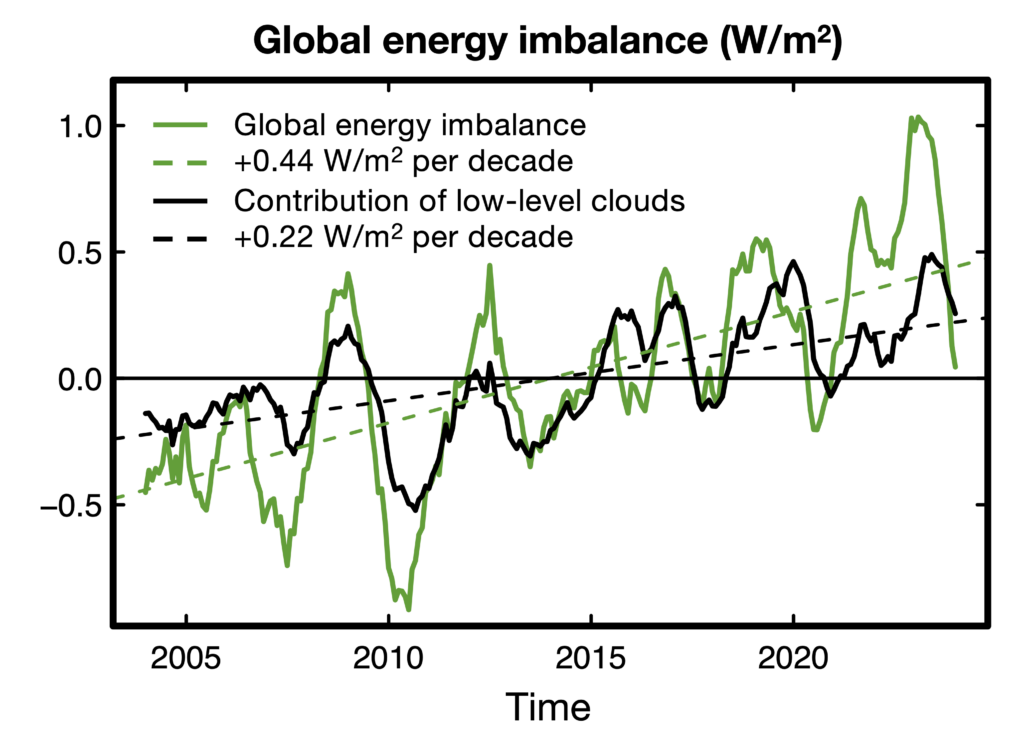
In our research, we use a simple model to assess how changes in low-level clouds between July 2003 and June 2024 contributed to the Earth’s energy imbalance.
We find that, averaged globally, changes in low-level cloudiness caused an extra 0.22 watts per metre squared (W/m2) per decade of absorbed sunlight. This amounts to exactly half of the concurrent increase in Earth’s energy imbalance over the same time period.
This is shown in the chart below, where the green line represents the increase in the Earth’s energy imbalance over 2003-24 and the black line shows the contribution of low-level clouds to that trend.
Why is cloudiness changing?
Scientists have attributed declining cloud cover in the 21st century to three main causes.
The first is a decrease in human-caused aerosol emissions over recent decades. Aerosols – tiny, light‑scattering particles produced mainly by burning fossil fuels – influence the formation of clouds, by acting as “seeds” for cloud droplets to form.
In recent years, aerosol emissions have been reduced due to efforts to clean up air pollution, such as cleaner shipping fuel regulations. Cleaner air has resulted in a decline in cloudiness.
Second, increasing concentration of greenhouse gases in the atmosphere has led to a warmer and drier atmosphere, which also helps to dissipate clouds.
Although a warmer atmosphere generally holds more water vapour in absolute terms, what matters for clouds is the “relative humidity” of the air, which has been declining in many places. This is a measure of how “saturated” the air is, or how much water vapour the air contains compared to the maximum it could hold.
Finally, cloud cover decreases have also been linked to ocean surface warming, which affects atmospheric humidity and, thus, cloudiness. Reduced cloudiness leads to more sunlight being absorbed at the ocean surface – and more warming. This amplifying loop is known as a “cloud feedback”.
However, the exact strength of these three effects on cloud cover is still unclear.
In fact, cloud feedbacks are among the main uncertainties in climate model projections of global warming.
Attributing low-cloud cover changes
In the next step of our study, we explore how the three human-caused factors mentioned above – aerosols, greenhouse gases and cloud feedback – contributed to recent low-level cloud changes.
We also look at the extent to which cloud changes could be explained by natural climate variability, which causes substantial year-to-year fluctuations in cloudiness and energy imbalance.
To do this, we use a statistical technique known as “cloud-controlling factor analysis”.
This analysis involves calculating the sensitivity of clouds to their “controlling factors”, including meteorological variables, such as temperature, humidity and winds, as well as aerosol concentrations.
To calculate how each factor contributed to the bigger picture of declining cloud cover, we combine sensitivity calculations with observed trends in meteorology and aerosol emissions.
This analysis allows us to attribute trends in cloud cover to known physical drivers: either natural climate variability, or human activities linked to aerosols, greenhouse gases and cloud feedback.
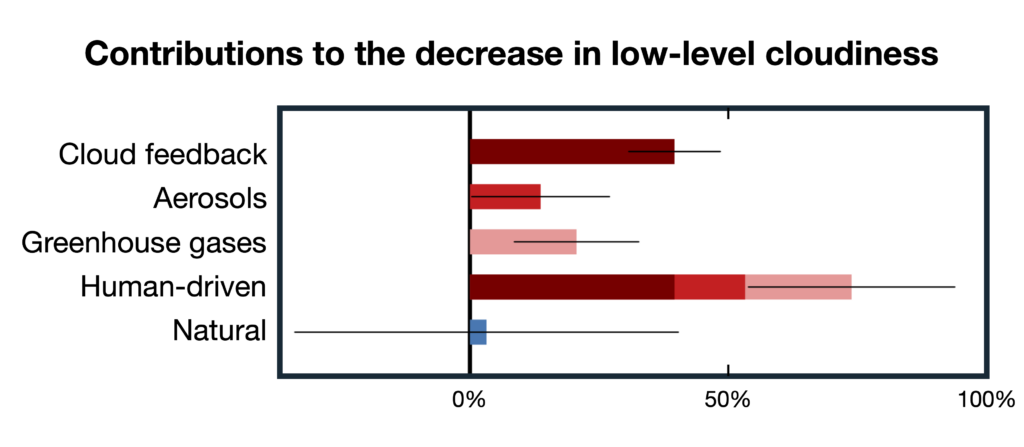
Our research finds that about 40% of the low-level cloud decrease since 2003 was driven by warming of the ocean surface – in other words, the cloud feedback process. This is followed by the effects of greenhouse gases (21%) and aerosols (14%).
Natural climate variability accounts for just 3% of the low-level cloud trend.
(The remaining 23% of the trend cannot be explained by our statistical method. This could be due to the limitations of cloud, temperature, humidity and aerosol concentration observations.)
The chart below shows how human-driven factors – the sum of aerosol effects (red), greenhouse gas emissions (pink) and cloud feedback (burgundy) – were responsible for almost three quarters of the decrease in low-level cloudiness over 2003-24. Natural climate variability (blue), on the other hand, played a minor role.
Thus, our analysis indicates that, at global scales, the observed cloud decrease is primarily driven by humans, rather than being caused by natural variations in Earth’s climate.
And, since low-level clouds contribute to half of the energy imbalance increase over the same period, it follows that a significant part of recent rises in energy imbalance can also be attributed to humans.
Clouds in climate models
So, should we be concerned that this cloudiness decrease means the Earth could see more warming than already anticipated?
To answer this, we looked at whether the climate models used by scientists to project future global warming accurately simulate recent declines in low-cloud cover.
While the models produce a wide range of outcomes, we found that, on average, the simulated changes in low-level cloudiness changes are in close agreement with real-world trends.
This is reassuring, as it means the effects of low-cloud cover are already accounted for in existing warming projections.
However, questions still remain around what is driving recent increases to the Earth’s energy imbalance, which have outpaced projections made by climate models.
Our findings rule out declines in low-level clouds as the reason that climate models have been underestimating the Earth’s energy imbalance, and, as a result, warming. But it is still possible that models are underrepresenting future global warming to some extent.
Low-level clouds are just one of several drivers of changes in energy imbalance. Future work will therefore need to assess other observed and simulated drivers of energy imbalance changes: for example, the impact of upper-level clouds, or changes in water vapour or sea ice.
Finally, it is important to stress that, while our findings are reassuring, they should certainly not make us complacent about the current global warming trend. The impacts of climate change are serious enough as they are – even if there is no evidence of a missing amplifying feedback in our projections.


The post Guest post: How declining cloudiness is accelerating global warming appeared first on Carbon Brief.
Guest post: How declining cloudiness is accelerating global warming
A Dutch startup thinks it has the answer to two of Europe’s biggest energy transition conundrums – long-duration storage batteries that are free from critical minerals and powered by rust.
In a pilot project in February, Amsterdam-based Ore Energy supplied four days of uninterrupted power to a research facility operated by France’s EDF electricity utility using a battery made of little more than iron pellets, water and air. That followed a grid installation in the Netherlands last year.
“These are the first instances of grid-connected iron-air batteries in Europe,” Yakup Koç, Ore Energy’s chief operating officer, told Climate Home News. “With these deployments, we’ve proven that the technology really works.”
Using abundant, cheap materials that can be sourced locally across Europe, iron-air batteries store and release electricity through a simple, chemical process: rusting and de-rusting.
“Rusting refers to discharging, and de-rusting refers to charging,” Koç said. “When discharging, air is drawn in and reacts with the iron, forming rust and releasing electricity in the process. To recharge, the oxygen is removed, and the rust reverts to iron, ready to go again.”
Energy transition’s “missing link”
Batteries able to store solar and wind power over longer periods of time than conventional lithium-ion batteries are often described as the “missing link” in the energy transition.
Technology such as Ore Energy’s could hold particular appeal for Europe as it strives to reduce its exposure to volatile critical mineral supply chains and boost its production of batteries for power storage and electric vehicles (EVs) instead of relying so heavily on imports from China.
“There are no critical raw materials in our batteries … which means we are truly independent of supply chain issues in that sense,” Koç said.
It also makes them cheaper than established batteries, which mostly use either lithium iron phosphate (LFP) or lithium nickel cobalt manganese oxide (NMC) chemistries.
“Critical raw materials are expensive,” Koç adds. “Because we’re using abundant resources, our cost price can be as much as 10 times lower than lithium.”
-
Battery passport plan aims to clean up the industry powering clean energy
Some of the world’s largest battery makers are piloting a scheme led by the Global Battery Alliance to reward manufacturers that meet social and environmental standards -
South African rare earths project aims to rival Chinese with low-cost model
The EU-backed Zandkopsdrift project plans to offset the high cost of rare earths production with another mineral in hot demand for use in batteries -
Self-taught mechanics give second life to Jordan’s glut of spent EV batteries
As EV sales boom in Jordan, a lack of formal infrastructure for dealing with end-of-life batteries is leading to some innovative solutions


Europe sprints for storage capacity
Wind and solar make up the fastest-growing energy sources globally, but bridging inherent supply fluctuations requires batteries capable of storing energy for far longer than currently possible with a typical lithium-ion battery.
Demand for battery energy storage systems has surged and it currently accounts for 15% of global battery demand, according to the International Energy Agency (IEA).
Multi-day storage capabilities will become increasingly important as renewable integration booms, said Zeenat Hameed, principal analyst for energy storage at Wood Mackenzie.
“Under net-zero scenarios, the average duration of newly installed storage assets may need to increase from around 2.5 hours today to roughly 20 hours to manage multi-day variability in wind and solar generation,” she told Climate Home News.
Europe added a record 27.1 GWh of new batteries in 2025, bringing total capacity to 77.3 GWh, according to a recent report by industry group SolarPower Europe, adding that capacity must increase 10-fold by 2030 to meet its needs.
With about 90% of battery-storage applications relying on Chinese lithium batteries, steps to diversify suppliers are also seen as vital to shore up energy security.
Innovation that can help reduce or diversify battery mineral supplies and demand – for example, technologies that do not require critical minerals – could play a key role in shoring up energy security, the IEA says.
Uncomplicated alternative?
This is where iron-air comes in.
Koç said Ore’s system can be configured to store energy anywhere between 24 and 100 hours, and is capable of being reused over a lifespan of as much as 20 years.
Each battery storage unit ships in standard 40-foot containers, a similar size as lithium-ion systems, and can be connected and operational within days of arriving on site.
Ore Energy is not the only company in the race to bring iron-air to the market.
US-based Form Energy, which has also developed an iron-air battery system, has partnered with Xcel Energy on a 10-megawatt (MW) iron-air system in Minnesota at a retiring coal plant. They have also announced plans to provide a 300-MW iron-air system to power a new Google data centre.
-
To break its coal habit, China should look to California’s progress on batteries
Big strides on battery storage are helping the state and other parts of the US cut their reliance on “peakers” – fossil fuel power plants that crank up at times of high demand -
China maximises battery recycling to shore up critical mineral supplies
Beijing is bracing for a tsunami of spent EV batteries by taking steps to boost recycling – a strategy that could also cut its reliance on imports of clean energy minerals -
Cobalt and nickel-free electric car batteries boom in “good news” for rainforests
Lithium iron phosphate batteries do not contain cobalt and nickel, which are mostly found in rainforest nations like the DR Congo and Indonesia


Beyond iron-air, a broader range of long-duration energy storage (LDES) technologies is taking shape. US-based Noon Energy is developing a carbon-oxygen battery based on solid-oxide fuel cell technology which it says avoids “scarce metals and minerals” and targets storage durations of 100 hours and above, while E-Zinc’s zinc-air systems are another player in the ultra-long-duration bracket.
Mahika Sri Krishna from the LDES Council, a global organisation focused on accelerating long duration energy storage solutions, told Climate Home News a mix of different technologies would be necessary to support grid reliability as renewables gain ground.
“Medium-duration storage solutions can help manage daily variability in renewable generation, while very long-duration systems may help address less frequent but more challenging reliability events,” said Sri Krishna, a senior manager for research and analysis at the group.
Last longer, scale up faster
Iron-air faces numerous challenges to scale-up and challenge established battery technologies, however, energy experts say.
Demand for multi-day storage is not yet high enough to drive commercialisation, Hameed said, estimating that lithium-ion is expected to retain about 85% of the global storage market through 2034 as economies of scale and manufacturing innovations reduce its costs.
While iron-air’s raw materials are cheap, the overall system cost still needs to prove itself at scale, Hameed added.
At Ore Energy, the next step is moving from single- to multi-container configurations, building what Koç describes as an “energy reservoir” that can be deployed across different use cases.
The scale-up itself, he said, is less the challenge than gaining industry acceptance by building a commercial track record.
“It’s not only about customers seeing the data and knowing it works,” he said. “The whole ecosystem around a new technology has to be brought along.”
When that happens, the technology could have transformative effects on Europe’s energy transition, he said.
“Europe will not decarbonise its power system on renewables alone,” Koç said. “Without long-duration storage, Europe risks replacing dependence on fossil fuels with dependence on overbuilding, curtailment and backup generation.”
The post Dutch startup’s rust-powered batteries could help crack Europe’s energy storage gap appeared first on Climate Home News.
Dutch startup’s rust-powered batteries could help crack Europe’s energy storage gap
The state is one of a handful where cancer diagnoses are on the rise.
Iowa is among a few states where cancer diagnoses are on the rise. A new analysis from the Harkin Institute for Public Policy & Citizen Engagement and the Iowa Environmental Council says that environmental exposures are partially to blame.
Iowa’s Cancer Crisis Linked to Pesticides, PFAS, Fertilizer and Radon, Report Says


Guest post: How declining cloudiness is accelerating global warming

Dutch startup’s rust-powered batteries could help crack Europe’s energy storage gap
Iowa’s Cancer Crisis Linked to Pesticides, PFAS, Fertilizer and Radon, Report Says
-
Greenhouse Gases8 months ago
Guest post: Why China is still building new coal – and when it might stop
-
Climate Change8 months ago
Guest post: Why China is still building new coal – and when it might stop
-

 Greenhouse Gases2 years ago
嘉宾来稿:满足中国增长的用电需求 光伏加储能“比新建煤电更实惠”
-
Climate Change2 years ago
Bill Discounting Climate Change in Florida’s Energy Policy Awaits DeSantis’ Approval
-

 Climate Change2 years ago
嘉宾来稿:满足中国增长的用电需求 光伏加储能“比新建煤电更实惠”
-
Climate Change Videos2 years ago
The toxic gas flares fuelling Nigeria’s climate change – BBC News
-

 Carbon Footprint2 years ago
US SEC’s Climate Disclosure Rules Spur Renewed Interest in Carbon Credits
-

 Renewable Energy5 months ago
Sending Progressive Philanthropist George Soros to Prison?