
The UK’s greenhouse gas emissions fell by 5.7% in 2023 to their lowest level since 1879, according to new Carbon Brief analysis.
The last time UK emissions were this low, Queen Victoria was on the throne, Benjamin Disraeli was prime minister, Mosley Street in Newcastle became the first road in the world with electric lighting and 59 people died in the Tay Bridge disaster in Dundee.
Carbon Brief’s analysis, based on preliminary government energy data, shows emissions fell to just 383m tonnes of carbon dioxide equivalent (MtCO2e) in 2023. This is the first time they have dropped below 400MtCO2e since Victorian times.
Other key findings from the analysis include:
- The UK’s emissions are now 53% below 1990 levels, while GDP has grown by 82%.
- The drop in emissions in 2023 was largely due to an 11% fall in gas demand. This was due to higher electricity imports after the French nuclear fleet recovered, above-average temperatures and weak underlying demand driven by high prices.
- Gas demand would have fallen even faster, but for a 15% fall in UK nuclear output.
- Coal use fell by 23% in 2023 to its lowest level since the 1730s, as all but one of the UK’s remaining coal-fired power stations closed down.
- Transport was the single-largest sector in terms of emissions, followed by buildings industry, agriculture and electricity generation. The electricity sector likely dropped below agriculture for the first time.
While the 23MtCO2e reduction in 2023 was faster than the 14MtCO2e per year average needed to reach net-zero by 2050, it was mostly unrelated to deliberate climate action. The UK will need to address emissions from buildings, transport, industry and agriculture to reach its 2050 target.
The analysis is the latest in a long-running series of annual estimates from Carbon Brief, covering emissions during 2022, 2020, 2019, 2018, 2017, 2016, 2015 and 2014.
Lowest since 1879
The UK’s territorial greenhouse gas emissions – those that occur within the country’s borders – have now fallen in 25 of the 34 years since 1990.
(Consumption-based emissions, including CO2 embedded in imported goods and services, were increasing until 2007, but have since fallen at a similar rate to territorial emissions.)
Apart from brief rebounds after the global financial crisis and the Covid-19 lockdowns, UK emissions have fallen during every year for the past two decades.
The latest 23MtCO2e (5.7%) reduction in 2023 takes UK emissions down to 383MtCO2e, according to Carbon Brief’s new analysis.
This is the lowest since 1879 – outside the 1926 general strike – as shown in the figure below.

Having dropped to a then-record low for the modern era of 404MtCO2e during the height of Covid in 2020, UK emissions bounced back in 2021 as the economy reopened.
While emissions declined in 2022, they remained above 2020 levels. In 2023, however, emissions fell below the lows seen during Covid lockdowns, to levels not seen since Victorian times.
Accidental action
The biggest contributor to the drop in UK greenhouse gas emissions in 2023 was an 11% reduction in gas demand, which accounted for around two-thirds of last year’s overall decline. This took the UK’s gas demand to its lowest level since the 1980s.
However, the drop in 2023 was not primarily due to deliberate climate action.
The figure below shows the estimated actual drop in emissions in red, followed by contributions from a series of factors that decreased emissions, in blue, and other factors in grey.
The most significant factor was the UK returning to its long-term position as a net electricity importer in 2023, reducing demand for domestically generated power from gas by more than 20%.
This followed an anomalous year in 2022, when the UK was a net exporter for the first time ever, as a result of widespread outages in the French nuclear fleet.
Lower demand for gas power accounted for more than two-thirds of the fall in gas use overall.
Next, above-average temperatures reduced the need for heating, while continuing very high prices since Russia’s invasion of Ukraine caused weak underlying demand for gas.
Reflecting both of these factors, there was a 6% drop in domestic demand in 2023, accounting for a fifth of the overall decline in gas consumption. A similar 7% drop in commercial demand for gas accounted for another tenth of the total, with a 5% drop in industrial demand the remainder.
Finally, the figure shows that there was a small reduction in gas demand and associated CO2 emissions as a result of increased wind and solar generation.
The impact of rising wind and solar capacity in 2023 was muted by average windspeeds being below average and the average number of sun hours falling sharply compared with 2022.

The UK’s emissions would have fallen even further in 2023 if not for a 15% decline in the output of the nation’s nuclear fleet. This followed the closure in 2022, of the Hunterston B station in Scotland and the Hinkley Point B plant in Somerset, as well as maintenance outages.
The decline in 2023 means UK nuclear output fell to the lowest level since the early 1980s. Following the site closures in 2022, the UK only has five operational nuclear power plants remaining, all but one of which – Sizewell B in Suffolk – are due to close this decade.
Out of coal
After gas, the next-largest driver of falling UK emissions in 2023 was coal, accounting for around 14% of the overall drop in emissions.
The decline of coal use in the UK – for homes, railways, factories and power stations – is a major part of the long-term reduction in greenhouse gas emissions over the past 30 years.
Factors in this long-term decline include controls on domestic coal burning to limit air pollution, the end of steam railways, the shift from coal-based “town gas” to “natural” gas from the North Sea, the deindustrialisation of the 1970s and the “dash for gas” of the 1990s.
More recently, coal demand has dropped precipitously as the rapid build-out of renewable sources of electricity has combined with falling demand and carbon pricing that favours gas.
The figure below shows how UK coal demand surged during the industrial revolution before levelling off through the 20th century, barring general strikes in 1921 and 1926.
Coal demand has been falling steadily since the passage of the Clean Air Act in 1956, in response to London’s “great smog” of 1952. In 2023, UK coal demand fell by another 23% to the lowest level since the 1730s, when George II was on the throne and Robert Walpole was prime minister.

The recent reduction of coal demand is largely down to the demise of coal power, which made up around 40% of the UK’s electricity generation as recently as 2012. Coal power output has fallen by 97% over the past decade, accounting for 87% of the fall in UK coal demand overall.
In 2023, only 1% of the UK’s electricity came from coal, with three coal-fired plants closing down: the coal units at Drax in Yorkshire; Kilroot in Northern Ireland; and West Burton A in Lincolnshire.
As of the start of October 2023, only one coal plant remains – the Ratcliffe-on-Soar site in Nottinghamshire. Operator Uniper plans to close Ratcliffe in September 2024, ahead of the government’s deadline to end coal power by October 2024.
Sectoral shifts
The reductions in gas use for power and building heat, as well as the fall in coal use for power, further cemented the transport sector as the largest contributor to UK emissions in 2023.
This is shown in the figure below, which highlights how transport emissions have barely changed over the past several decades as more efficient cars have been offset by increased traffic.
The power sector was the largest contributor to the UK’s emissions until 2014. In 2023, it was likely only the fifth-largest below transport, buildings, industry and – for the first time – also agriculture.

As of 2023, transport emissions were only around 10% below 1990 levels and made up nearly a third of the UK’s overall total. There are now more than a million electric vehicles (EVs) on the UK’s road, which will have avoided around 2MtCO2e of annual emissions.
However, the government has also frozen or cut fuel duty every year since 2010, rather than increasing it in line with inflation, adding up to around 20MtCO2e to the UK’s total.
Emissions from buildings – chiefly for heating and cooling – are the second-largest contributor to the UK’s emissions, accounting for around a fifth of the total.
They were around one-third lower than 1990 levels in 2023, with improved insulation and boiler regulations making the UK’s buildings more efficient to heat.
Efficiency improvements dried up around a decade ago and the fall in building emissions since 2021 has been driven by high prices suppressing demand, rather than deliberate policy choices.
Industrial emissions made up an estimated tenth of the UK’s total in 2023, having fallen by two-thirds since 1990 and by a quarter in the past decade.
In common with many other developed economies, the UK shifted from heavy industry towards advanced manufacturing and services from the 1970s onwards. However, industrial energy efficiency improvements and a shift to lower-carbon fuels are also part of the picture.
Agricultural emissions have barely changed for decades, making up just over a tenth of the UK’s total in 2023 and having fallen just 12% since 1990 as livestock herds have shrunk.
There was a small decrease in farm emissions in 2022 as the energy crisis filtered through into surging prices for fertilisers. For the figure above, Carbon Brief assumes the reduced fertiliser use in 2022 continued in 2023, as fertiliser prices only eased in summer 2023.
Decoupling emissions
The drop in UK emissions in 2023 came as the economy flatlined, growing by just 0.4% on 2022 levels. The UK’s emissions are now 53% below 1990 levels while the economy has grown 82%.
This “decoupling” of emissions from economic growth is shown in the figure below. As noted above, this analysis is based on territorial emissions within the UK’s borders.
Consumption-based emissions including imported goods and services were climbing in the early part of this century. However, emissions cuts over the past two decades have been very largely driven by sectors that cannot easily be “outsourced”, particularly power and building heat.

The UK is now in a mild recession and the economy is only expected to grow by around 1% in 2024. Recent trends in the “emissions intensity” of the UK economy – the emissions per unit of GDP – and weak economic growth suggests that emissions could continue to fall in 2024.
On the other hand, gas and oil prices are easing to pre-crisis levels, while above-average temperatures may not continue for another year. Petrol demand rose by nearly 5% in 2023 as traffic continued to rebound from the pandemic – and jet fuel use similarly climbed by 16%.
Moreover, the one-off impact of the UK returning to net electricity imports has now unwound. As such, further emissions cuts in 2024 are far from guaranteed.
Target practise
While the UK has made rapid progress in cutting its territorial emissions since 1990, it remains only around halfway to reaching its net-zero target for 2050, as the chart figure shows.
Emissions fell by 23MtCO2e in 2023, according to Carbon Brief’s analysis. This is faster than the 14MtCO2e reduction needed every year for the next quarter-century to reach net-zero by 2050.

However, with only one coal-fired power station remaining and the power sector overall now likely only the fifth-largest contributor to UK emissions, the country will need to start cutting into gas power and looking to other sectors, if it is to continue making progress towards its targets.
This will mean expanding wind and solar capacity to reduce gas use, while retaining gas-fired power stations for periods of low wind and starting to build low-carbon alternatives, such as gas with carbon capture and storage, long-term energy storage or hydrogen-fired turbines.
Emissions from road transport and buildings will be key areas if the UK is to progress, which is why changes to government plans around electric vehicles and heat pumps could be problematic.
Similarly, a government decision to “carry forward” the “surplus” emissions cuts from earlier years – largely due to external events such as Covid – would severely weaken UK targets at a time when continued ambition is needed, to stay on track for medium- and long-term climate goals.
Methodology
The starting point for Carbon Brief’s analysis of UK greenhouse gas emissions is preliminary government estimates of energy use by fuel. These are published quarterly, with the final quarter of each year appearing in figures published at the end of the following February. The same approach has accurately estimated year-to-year changes in emissions in previous years (see table, below).

One large source of uncertainty is the provisional energy use data, which is revised at the end of March each year and often again later on. Emissions data is also subject to revision in light of improvements in data collection and the methodology used, with major revisions in 2021.
The table above applies Carbon Brief’s emissions calculations to the comparable energy use and emissions figures, which may differ from those published previously.
Another source of uncertainty is the fact that Carbon Brief’s approach to estimating the annual change in emissions differs from the methodology used for the government’s own provisional estimates. The government has access to more granular data not available for public use.
Carbon Brief’s analysis takes figures on the amount of energy sourced from coal, oil and gas reported in Energy Trends 1.2. These figures are combined with conversion factors for the CO2 emissions per unit of energy, published annually by the UK government. Conversion factors are available for each fuel type, for example, petrol, diesel, gas, coal for electricity generation.
For oil, the analysis also draws on Energy Trends 3.13, which further breaks down demand according to the subtype of oil, for example, petrol, jet fuel and so on. Similarly, for coal, the analysis draws on Energy Trends 2.6, which breaks down solid fuel use by subtype.
Emissions from each fuel are then estimated from the energy use multiplied by the conversion factor, weighted by the relative proportions for each fuel subtype.
For example, the UK uses roughly 50m tonnes of oil equivalent (Mtoe) in the form of oil products, around half of which is from road diesel. So half the total energy use from oil is combined with the conversion factor for road diesel, another one-fifth for petrol and so on.
Energy use from each fossil fuel subtype is mapped onto the appropriate emissions conversion factor. In some cases, there is no direct read-across, in which case the nearest appropriate substitute is used. For example, energy use listed as “bitumen” is mapped to “processed fuel oils – residual oil”. Similarly, solid fuel used by “other conversion industries” is mapped to “petroleum coke”, and “other” solid fuel use is mapped to “coal (domestic)”.
The energy use figures are calculated on an inland consumption basis, meaning they include bunkers consumed in the UK for international transport by air and sea. In contrast, national emissions inventories exclude international aviation and shipping.
The analysis, therefore, estimates and removes the part of oil use that is due to the UK’s share of international aviation. It draws on the UK’s final greenhouse gas emissions inventory, which breaks emissions down by sector and reports the total for domestic aviation.
This domestic emissions figure is compared with the estimated emissions due to jet fuel use overall, based on the appropriate conversion factor. The analysis assumes that domestic aviation’s share of emissions is equivalent to its share of jet fuel energy use.
In addition to estimating CO2 emissions from fossil fuel use, Carbon Brief assumes that CO2 emissions from non-fuel sources, such as land-use change and forestry, are the same as a year earlier. Remaining greenhouse gas emissions are assumed to change in line with the latest government energy and emissions projections.
These assumptions are based on the UK government’s own methodology for preliminary greenhouse gas emissions estimates, published in 2019.
Note that the figures in this article are for emissions within the UK measured according to international guidelines. This means they exclude emissions associated with imported goods, including imported biomass, as well as the UK’s share of international aviation and shipping.
The Office for National Statistics (ONS) has published detailed comparisons between various different approaches to calculating UK emissions, on a territorial, consumption, environmental accounts or international accounting basis.
The UK’s consumption-based CO2 emissions increased between 1990 and 2007. Since then, however, they have fallen by a similar number of tonnes as emissions within the UK.
Bioenergy is a significant source of renewable energy in the UK and its climate benefits are disputed. Contrary to public perception, however, only around one quarter of bioenergy is imported.
International aviation is considered part of the UK’s carbon budgets and faces the prospect of tighter limits on its CO2 emissions. The international shipping sector has a target to at least halve its emissions by 2050, relative to 2008 levels.


The post Analysis: UK emissions in 2023 fell to lowest level since 1879 appeared first on Carbon Brief.
Analysis: UK emissions in 2023 fell to lowest level since 1879
Mohamed Adow is the founder and director of Power Shift Africa.
At London Climate Action Week, electrification moved from the margins of climate policy to the centre of the road to COP31. The launch of the Electrify Now campaign gave fresh momentum to a target floated at the Bonn climate talks: by 2035, electricity should provide 35% of the world’s final energy consumption, up from just over 20% today.
That makes electrification one of the defining tests for this year’s climate summit in Türkiye. If COP31 is to be more than another exercise in negotiating text, it must show how the world can replace fossil fuels in transport, heating, industry and everyday life with clean electricity.
For Africa, this agenda presents both an extraordinary opportunity and an immense challenge.
For decades, the continent has been viewed primarily through the lens of energy poverty. More than 600 million Africans still lack access to electricity. Yet that very deficit also means many African countries are not locked into ageing fossil-fuel infrastructure in the way industrialised economies are. They have the chance to build cleaner energy systems from the outset.
-
Iran war fuel shocks threaten Africa’s clean cooking push, IEA says
Disruptions in the Strait of Hormuz have hit supplies of liquefied petroleum gas (LPG), seen as a cleaner cooking alternative to charcoal and wood -
COP31 leaders unveil global targets, with spotlight on electrification
Co-hosts Türkiye and Australia want countries to sign on to global targets in three of their priority areas for this year’s COP climate negotiations -
EU, UK lead push for electrification as “powerful weapon” against fossil fuels
A group of dozens of countries seeks to build momentum for a COP31 pledge to electrify 35% of global energy use by 2035 as an alternative to fossil fuels


The case for electrification is compelling. Transport, industry and heating account for much of the world’s fossil-fuel consumption. Replacing combustion engines with electric vehicles, diesel generators with renewable power and fossil-fuel heating with electric alternatives is one of the fastest ways to cut emissions while improving energy security. Electric technologies are also far more efficient, and renewable electricity is now the cheapest source of new power across much of the world.
Africa also possesses one of the greatest renewable energy endowments on Earth. The continent possesses some of the world’s best solar resources. Vast wind corridors stretch across North, East and Southern Africa. Geothermal energy is already powering much of Kenya’s electricity system. Hydropower resources remain significant in several regions.
But potential is not the same as progress.
The biggest obstacle is not a lack of sunshine or wind. It is a shortage of investment.
Financial barriers
African countries pay some of the highest borrowing costs in the world despite contributing the least to climate change. Projects that would be commercially viable elsewhere become prohibitively expensive because of high interest rates and perceptions of financial risk. Until the cost of capital falls, many countries will struggle to build the renewable power stations, transmission lines and battery storage needed to electrify their economies.
The electricity itself is another challenge. It is difficult to persuade people to buy electric vehicles or industries to electrify production if power supplies remain unreliable. Many national grids require major investment to expand access, improve reliability and accommodate growing volumes of renewable energy. In rural areas, decentralised solar and battery systems will often provide the quickest route to universal electricity access, but they too require finance and supportive policy frameworks.
Industrial policy matters just as much.
Africa is rich in many of the minerals needed for batteries and clean technologies, yet too often it exports raw materials and imports finished products. If electrification simply creates new markets for imported batteries, electric vehicles and solar equipment, much of the economic opportunity will be lost. The transition should also become a strategy for building African manufacturing, creating skilled jobs and capturing more value from the continent’s own resources.
There are encouraging signs. Ethiopia has pushed aggressively to promote electric mobility while seeking to reduce its dependence on imported oil. Kenya has become a global leader in geothermal electricity and is seeing rapid growth in electric motorcycles. Morocco is building an industrial base around renewable energy and battery supply chains.
Electrification is happening
These examples show that electrification is no longer a distant prospect. But they also remain outliers rather than the norm. For most African countries, unreliable grids, high borrowing costs and limited access to finance still stand in the way of a much broader transformation. That is precisely why the emerging electrification agenda matters.
If the world wants electricity to account for 35% of final energy demand by 2035, then success cannot be measured simply by announcing a global target. It must be measured by whether developing countries have the finance, technology and policy support to make that transition possible.
For Africa, electrification is not only about reducing emissions. It is about determining what kind of development path the world’s youngest and fastest-growing continent will follow.
More than a billion people live in Africa today. By mid-century, that number will be closer to 2.5 billion. This is a continent on the cusp of sweeping economic transformation, with cities expanding, industries growing and hundreds of millions of people rightly demanding the energy, mobility and prosperity long enjoyed elsewhere.
Campaigners oppose Dangote’s planned Kenya refinery over climate and ecological risks
That development will require vast amounts of power. The question is whether it will be delivered through the old fossil-fuel model of imported oil, gas infrastructure and polluting combustion, or through clean electricity generated from Africa’s own renewable resources.
This matters for Africa. But it also matters for the world. A global transition to electrification cannot succeed if a continent of this scale is locked into a new generation of fossil-fuel dependence. Nor can it be just if Africa is told to decarbonise without being given the finance and technology to build something better.
The choice facing COP31 is therefore not simply whether electrification will happen. It is whether Africa is helped to become an electro-state continent, powering its development through clean electricity, or pushed by neglect into repeating the fossil-fuel pathway that has already destabilised the climate.
For the age of electrification to be a success, COP31 needs to ensure Africa is equipped to shape and accelerate it. If Africa is left behind, the global energy transition will fall behind with it.
The post Africa can lead the Age of Electrification appeared first on Climate Home News.
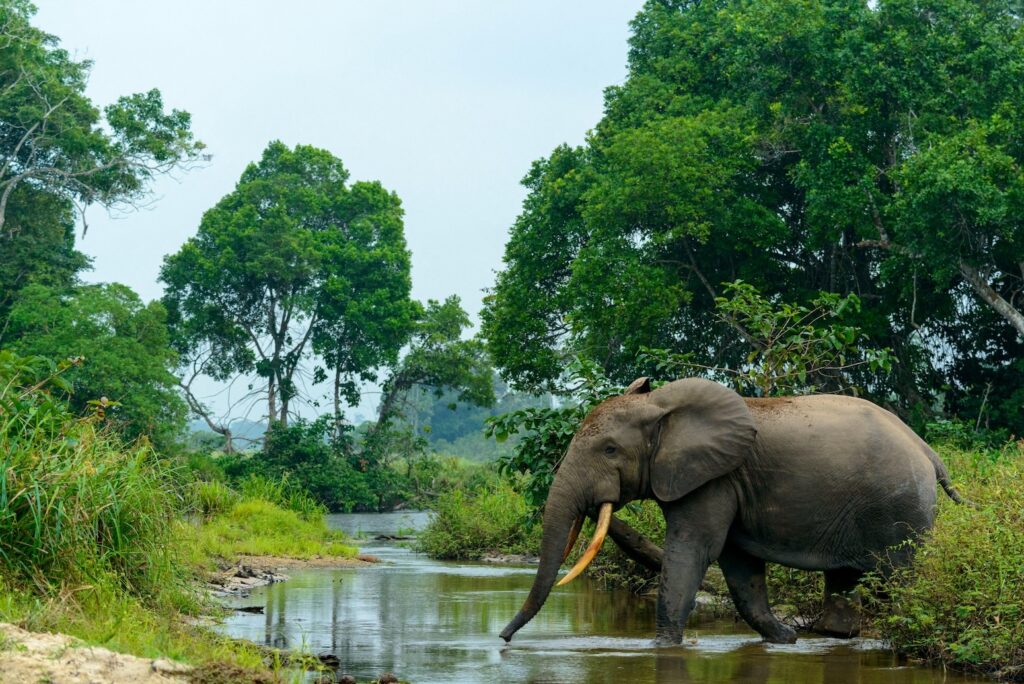
The UK has abandoned projects worth tens of millions of pounds that were meant to help protect Congo rainforests and support local people.
Together, these initiatives would have made up around half of the £200m that the UK pledged to support conservation in the Congo basin – the world’s second-largest rainforest.
When it hosted COP26 in Glasgow, the UK led a new initiative to end forest loss, which included a collective pledge by 12 donors of “at least” $1.5bn (£1.1bn) for Congo rainforest nations by 2025.
Development minister Jenny Chapman revealed last week that, as of 2024, the UK had only provided £39.8m towards this goal.
Alongside the US and much of Europe, the UK has significantly cut its aid budget in recent years, leading to much of its Congo rainforest spending being cancelled or reappraised.
The government says it still plans to “prioritise” rainforest regions, including the Congo basin, but civil society groups and MPs are concerned about the lack of “ring-fenced” forest funding in the UK’s new aid strategy.
COP pledge
At COP26, the UK – led by then prime minister Boris Johnson – launched the “Glasgow leaders’ declaration”, with a goal to “halt and reverse forest loss” by 2030. This was backed by more than 140 nations.
The UK also made various funding pledges, including £200m to protect the Congo basin, £350m for tropical forests in Indonesia and “up to £300m” for the Amazon.
These commitments target the world’s three largest rainforests, all of which face major forest loss due to threats such as agriculture, logging and climate change.
The Congo basin is the planet’s largest forested carbon sink. Yet, its six host nations are among the poorest in the world and face significant funding barriers.
This has global ramifications. An official UK assessment warned that “degradation or collapse” of the Amazon or Congo rainforests “threaten UK national security and prosperity”.
Forest cuts
Following successive aid cuts introduced by both the Conservative and then Labour governments – tracking a global trend – the UK’s Congo funding is under threat.
The Congo basin forest action programme (CBFA) was launched by the UK at COP27. It was explicitly set up to provide “roughly half” of the UK’s £200m Congo pledge.
CBFA set out to “empower central African nations”, such as the Democratic Republic of the Congo (DRC), with support for “community forests” and other measures to curb forest loss.
Now, after reporting delays, the UK has slashed the CBFA as part of the Labour government’s recent aid cuts, intended to free up money for defence spending.
Its original £90m budget has now been reduced to £18.8m. Government data shows that £15m of this has already been spent.
This is not the only Congo project that has been dropped due to this latest round of aid cuts.
The Congo part of the biodiverse landscapes fund – championed by the previous government and worth at least £12.3m – has been closed, just two years into its seven-year schedule.
Government documents reveal more Congo forest funding is at risk as the UK scales back its aid budget, including the UK’s two largest remaining projects in the region.
One initiative, intended to “incubate forest-friendly enterprises” in DRC, faces “reduc[ed] budgets”. Officials working on the other, while more optimistic, reported that the project may be forced to operate in fewer countries as the cuts set in.
Documents also reveal the difficulties that come when operating in the Congo, including “complex political economies” and, in Gabon, a military coup – which “complicated matters”.
‘Breaking promises’
Damian Fleming, a senior director of forests at WWF International tells Carbon Brief:
“Tropical forest countries are making long-term policy and development choices in expectation that international partners will honour their commitments.”
In a series of recent parliamentary responses, Chapman revealed that the UK had only spent £39.8m on Congo forest finance, as of 2024. (She declined to provide any information on the Indonesia and Amazon regional goals.)
Despite being presented as the UK’s “contribution” to the £1.1bn-by-2025 global goal agreed at COP26, the £200m target has a deadline of 2029.
Therefore, while the collective goal has been met, the UK’s contribution so far has been relatively small.
Zac Goldsmith, a former Conservative minister who oversaw the forest targets at COP26, tells Carbon Brief that, in his view, the UK has “discarded” its regional pledges:
“We have gone from being perhaps the leader on protecting nature internationally to breaking promises to countries around the world for whom the environment is an existential issue.”
Future targets
The Labour government says it has met the five-year “climate finance” target of £11.6bn that expires this year.
Ministers also say the government has met “and exceeded” the £3bn and £1.5bn sub-goals for “preserving nature” and forests, respectively, within the £11.6bn. These are the funding streams that include support for the Congo basin and other rainforests.
The UK has funded a variety of projects in line with its forest goals, including mangrove restoration in Indonesia, support for carbon-offsetting projects in Brazil and promoting “forest stewardship” among farmers in Cameroon.
Chapman has stated that the UK will continue to “prioritise” the Congo rainforest, in line with its new plan for aid spending in Africa. The UK even helped to launch a new “call to action” for Congo basin funding at COP30 last year.
The UK government also says it supported the creation of Brazil’s flagship “Tropical Forest Forever Facility” (TFFF). However, so far it has not provided any funding for the facility.
When the government announced a new climate finance pledge for 2026 onwards, it stressed that nature would still be a “focus” and said it would also generate billions in “climate and nature positive investments”. Nevertheless, it dropped the “ring-fenced” amounts for nature and forests that had appeared in its previous pledge.
The UK, alongside other developed countries, has pledged to provide biodiversity finance to developing countries, under the Kunming-Montreal Global Biodiversity Framework (GBF) – a non-binding global pact to halt and reverse nature loss by 2030.
Sarah Champion, chair of the international development committee of MPs, says “sub-pledges” for nature and forests are a “cost-effective and impactful” way to ensure this finance is provided, alongside climate finance. She tells Carbon Brief that she was “concerned” about the move away from this approach:
“When the minister recently appeared before the international development committee, I was concerned to hear her characterise this shift as a ‘gamble’.”
A government spokesperson tells Carbon Brief:
“We remain committed to providing finance for forests, including in the Congo basin, as a core element of our overall climate funding.”
A shorter version of this article was first published in Cropped, Carbon Brief’s fortnightly newsletter that provides a digest of food, land and nature news, on 15 July 2026. Subscribe for free.


The post UK withdraws millions in funding from world’s second-largest rainforest in Congo appeared first on Carbon Brief.
UK withdraws millions in funding from world’s second-largest rainforest in Congo
Climate Change
Cropped 15 July 2026: Uganda starves | Trump opens endangered habitats | UK cuts rainforest aid
We handpick and explain the most important stories at the intersection of climate, land, food and nature over the past fortnight.
This is an online version of Carbon Brief’s fortnightly Cropped email newsletter.
Subscribe for free here.
Key developments
Global drought and heat
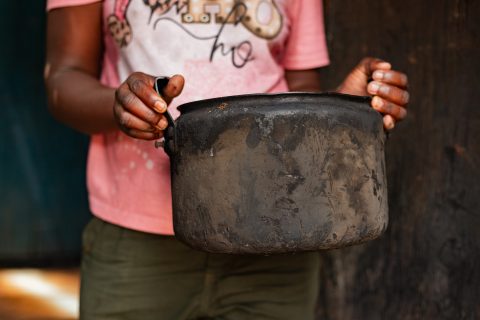
DRY THEN WET: A recent heatwave and months of low rainfall has led to a prolonged drought for Uganda, resulting in at least 16 deaths from hunger and significant crop losses, reported BBC News. Bastille Post Global suggested that “a developing El Niño later this year could bring heavier rainfall to parts of the region, raising the risk of flooding in areas now struggling with drought”.
FUNDING FOOD: The UN Food and Agriculture Organization (FAO) and the World Food Programme (WFP) have appealed for $200m in funding to help African nations deal with the impact of El Niño, stated Deutsche Welle. This would target 22 high-risk countries with measures, including “cash transfers, climate-resilient seeds, livestock protection and flood control.” The Guardian explained how El Niño could still “cause a severe shock to global food prices lasting into 2028”.
FARMING FEARS: Extreme weather has devastated agriculture across the world. India saw its driest June in 12 years, reported BBC News, and France has had a “double-digit production” decline, according to Le Monde. The Financial Times reported that farmers in the UK are mitigating the impacts of extreme heat by eliminating “chemicals and intensive ploughing to improve soil quality so it retains water”.
EURO FIRES: Wildfires have spread across Europe, with Spain reporting at least 12 deaths so far, according to the Guardian, and France experiencing road closures, said Reuters. Wildfire Today reported that the most extreme conditions are “across France, Spain and northern Portugal, the Alpine arc extending into northern Italy, the south of the UK and south-east Ireland”. CNN explained how “the climate crisis is driving hotter, drier weather, which is setting the stage for fiercer fire seasons”.
Endangering species
REDEFINING HARM: The Trump administration “reversed decades of longstanding environmental law protecting endangered species…opening up sensitive habitats…to drilling, mining, farming and real estate development”, reported CNN. According to the story, the change “redefines what constitutes ‘harm’” to endangered species, which historically prohibited habitat modification or degradation. Agence France-Presse reported that US environmental groups sued the Trump government over the move, arguing that it had violated “common sense, biological science and federal law”.
OPEN SEASON: Reuters reported that the change “limits the reach of the 50-year-old Endangered Species Act” (ESA), which is a “key regulatory consideration” when granting permits for “oil and gas, mining, electric transmission and other operations on federal lands and water”. Legal scholars told the New York Times the US government “was acting without conducting scientific research into the impact” of the change, while the National Mining Association “applauded the announcement”.
News and views
- INTERNATIONAL WATERS: After a significant delay, the UK ratified the Biodiversity Beyond National Jurisdiction Agreement (BBNJ), also known as the High Seas Treaty. Oceanographic detailed how this will allow for “marine protected areas across international waters for the first time”, but also stressed that the “hard part” starts now.
- SCOPE-FREE: The world’s largest meat supplier JBS “scrapped a key climate goal” in its net-zero plan that accounts for its suppliers’ emissions, “which make up the vast bulk of the company’s environmental footprint”, reported the Financial Times. The company told the paper it was difficult to control these “indirect” emissions.
- DEEP TROUBLE: Pacific gray whales are facing a “catastrophic die-off” as sea-ice loss threatens their food sources, said the Guardian. Separately, conservationists warned that more than half of all molluscs that “cluster around underwater vents” could face extinction from deep-sea mining, reported Reuters.
- ETHANOL PUSHBACK: India’s new rules to promote 100% ethanol fuel and make ethanol-blended fuel mandatory at pumps “triggered a political row”, reported the Times of India. While the Indian government defended the push to automobile owners, a Hindu editorial and an Indian Express comment warned against incentivising fuels made from “water-intensive” sugarcane and rice.
- AMAZON ACTION: Deforestation in the Brazilian Amazon fell to its lowest level in a decade, but president Lula’s plans to “end illegal deforestation by 2030” could be hampered if he is not re-elected, reported Al Jazeera. Meanwhile, Colombia’s outgoing environment minister warned of greater environmental and climate risk under the incoming government, said the Associated Press.
- WAR WORRIES: The International Energy Agency (IEA) warned of the impact of the Iran war on Africa’s clean cooking efforts as disruption in the strait of Hormuz has stunted supplies and increased prices of liquefied petroleum gas (LPG), explained Climate Home News.
Spotlight
UK ‘discards’ Congo rainforest funding
Amid worldwide cuts to aid spending, Carbon Brief explores how the UK is backtracking on funding for the Congo basin – the world’s second-largest rainforest.
The UK has abandoned projects worth tens of millions of pounds that were meant to help protect Congo rainforests and support local people.
Together, these initiatives would have made up half of the £200m that the UK pledged to support forest conservation in the Congo basin.
When it hosted COP26 in Glasgow, the UK led a new initiative to end forest loss, which included a collective pledge of “at least” $1.5bn (£1.1bn) for Congo rainforest nations by 2025.
Development minister Jenny Chapman revealed last week that, as of 2024, the UK had only provided £39.8m towards this goal.
COP pledge
At COP26, the UK – led by then prime minister Boris Johnson – launched the “Glasgow leaders’ declaration”, with a goal to “halt and reverse forest loss” by 2030.
The UK also made various regional funding pledges, including £200m for the Congo basin, £350m for tropical forests in Indonesia and “up to £300m” for the Amazon.
All of these rainforests face major forest loss. The Congo basin is the planet’s largest forested carbon sink, but its six host nations are among the poorest in the world and face significant funding barriers.
This has global ramifications. An official UK assessment warned that “degradation or collapse” of the Amazon or Congo rainforests “threaten UK national security and prosperity”.
Forest cuts
Following successive aid cuts introduced by both Conservative and Labour governments – tracking a global trend – the UK’s Congo funding is under threat.
The Congo basin forest action programme (CBFA) was explicitly set up to provide “roughly half” of the UK’s £200m Congo pledge.
Now, after reporting delays, the UK has slashed the CBFA as part of the Labour government’s aid cuts. Its £90m budget has been “quietly reduced by 79% to £18.8m”, according to the Times.
This is not the only Congo project that has been dropped due to aid cuts. The Congo part of the biodiverse landscapes fund – worth at least £12.3m – has closed five years early.
Official documents reveal more Congo forest funding is at risk, including the UK’s two largest remaining projects in the region. One initiative, intended to “incubate forest-friendly enterprises” in DRC, faces “reduc[ed] budgets”.
Documents also show the difficulties operating in the Congo, including “complex political economies” and, in Gabon, a military coup – which “complicated matters”.
‘Breaking promises’
Damian Fleming, a senior forests director at WWF International told Carbon Brief:
“Tropical forest countries are making long-term policy and development choices in expectation that international partners will honour their commitments.”
In a parliamentary response, Chapman said that the UK had spent £39.8m towards its £200m Congo target, as of 2024.
Despite being described as the UK’s contribution to the £1.1bn-by-2025 global goal agreed at COP26, the £200m target has a deadline of 2029. Therefore, while the collective goal has been met, the UK’s contribution was relatively small.
Zac Goldsmith, a former Conservative minister who oversaw the forest targets at COP26, told Carbon Brief that, in his view, the UK has “discarded” its regional pledges:
“We have gone from being perhaps the leader on protecting nature internationally to breaking promises to countries around the world.”
The Labour government says it has met its overarching “climate finance” goals and still intends to “prioritise” the Congo rainforest.
However, civil society groups and MPs are concerned about the lack of “ring-fenced” forest funding in the UK’s new aid strategy.
Watch, read, listen
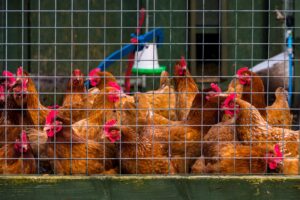
TOXIC TROUBLES: DeSmog unpacked a new report that said Northern Ireland is being turned into a “toxic” pig and poultry farming “sacrifice zone” to satiate the UK’s meat appetite.
NEED TO NOAA: Laid-off scientists from the US’s National Oceanic and Atmospheric Administration (NOAA) launched Climate.Us – an independent, public-backed version of the climate information website shut down by Trump last year.
DRY FRUIT: A Dialogue Earth long read looked at how climate change is impacting apricot harvests in the “stark, high-altitude desert” region of Ladakh, India.
READING ALOUD: A London Review of Books podcast discussed Robin Wall Kimmerer’s influential book “Braiding Sweetgrass”, weighing its compelling themes and where it veers into “scientific overreach”.
New science
- Climate change could cause Indigenous peoples in the Amazon to lose 28-34% of their plant species and 18-23% of their associated services | Nature
- Biodiversity in forests can act as a “buffer” against compound extreme weather events | Nature Communications
- Zero-deforestation commitments in Indonesia’s palm oil sector have had “no additional impacts” on reducing forest loss | Proceedings of the National Academy of Sciences
In the diary
- 7-15 July: High-level political forum on sustainable development | New York City
- 13-31 July: Meeting of the International Seabed Authority assembly and council | Kingston, Jamaica
- 16 July: International Energy Agency critical minerals outlook 2026, online
- 27 July-1 August: Scientific and technical subsidiary body meeting of the UN Convention on Biological Diversity | Nairobi, Kenya
This edition of Cropped was written by Jess Milligan, Josh Gabbatiss and Aruna Chandrasekhar. Cropped is edited by Dr Giuliana Viglione. This edition was edited by Daisy Dunne. Please send tips and feedback to cropped@carbonbrief.org.
The post Cropped 15 July 2026: Uganda starves | Trump opens endangered habitats | UK cuts rainforest aid appeared first on Carbon Brief.
Cropped 15 July 2026: Uganda starves | Trump opens endangered habitats | UK cuts rainforest aid


-
Climate Change11 months ago
Guest post: Why China is still building new coal – and when it might stop
-
Greenhouse Gases11 months ago
Guest post: Why China is still building new coal – and when it might stop
-

 Greenhouse Gases2 years ago
嘉宾来稿:满足中国增长的用电需求 光伏加储能“比新建煤电更实惠”
-

 Climate Change2 years ago
嘉宾来稿:满足中国增长的用电需求 光伏加储能“比新建煤电更实惠”
-
Climate Change2 years ago
Bill Discounting Climate Change in Florida’s Energy Policy Awaits DeSantis’ Approval
-

 Renewable Energy9 months ago
Sending Progressive Philanthropist George Soros to Prison?
-

 Carbon Footprint2 years ago
US SEC’s Climate Disclosure Rules Spur Renewed Interest in Carbon Credits
-
Greenhouse Gases1 year ago
嘉宾来稿:探究火山喷发如何影响气候预测