
Europe’s solar energy industry achieved remarkable milestones in 2024, marking a record-breaking year for generation and capacity expansion. Solar energy continues to play a pivotal role in the EU’s green transition, driven by innovations, investments, and policy efforts.
This article explores Europe’s solar achievements in 2024, highlighting key areas of growth and developments according to data reported by energy think tank Ember.
2024: A Record Year for Solar Growth
In 2024, Europe’s solar industry saw unprecedented growth, with annual solar generation increasing by 54 TWh (+22%) compared to 2023. This marked an acceleration from the previous year, which saw a 40 TWh increase.

The EU also set a record for capacity additions, installing 66 GW in 2024—equivalent to more than 450,000 solar panels per day. This rapid expansion pushed total installed solar capacity to 338 GW, keeping the EU on track to meet its REPowerEU interim goal of 400 GW by 2025.
If this growth continues, the EU’s ambitious 2030 target of 750 GW will be within reach. However, the pace of deployment is already surpassing what many national targets require.

Importantly, solar energy growth occurred across every EU country in 2024. Sixteen countries generated over 10% of their electricity from solar power—an increase from 13 in 2023.
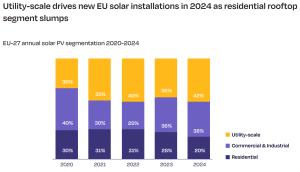
Innovative approaches, such as balcony solar panels in Germany and agri-PV systems that integrate solar with agricultural land use, are expanding the reach of solar energy beyond traditional rooftops and fields. Residential rooftop installations, which faced significant losses, were overtaken by utility-scale solar, the largest market segment in 2024, per Solar Power analysis.
Capital investments in EU solar PV had steadily climbed from €19 billion in 2020 to €60 billion in 2023. However, this upward trend shifted in 2024.
- RELATED: Solar Energy Developer Secures $415 Million to Power the World’s Largest Direct Air Capture Plant
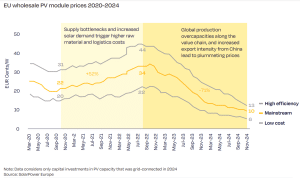
European wholesale module prices hit record lows, declining by 35% between January and November 2024, following a 50% drop the previous year as seen below. This sharp price reduction was driven by falling supply chain costs and overcapacity in the market.
Solar Meets Demand Like Never Before
The success of solar energy is reflected in its ability to meet growing electricity demands across the EU. In 2024, 12 EU countries reported solar meeting at least 80% of their electricity demand during peak hours on multiple occasions.
Notably, Hungary saw an incredible leap, with solar meeting over 80% of demand on 70 days in 2024—up from just 10 days in 2023.
This trend underscores the potential of solar energy to displace expensive and polluting fossil fuels during daylight hours. However, achieving consistent reliability requires integrating clean flexibility solutions, such as battery storage, expanded grids, and smart electrification.
These technologies can store excess solar energy during midday production peaks and distribute it during evening demand surges, reducing reliance on fossil fuels for power balancing.
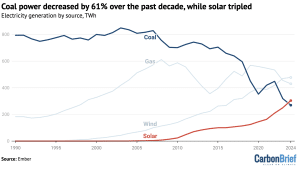
Notably, the EU’s shift to solar, alongside wind, has cut coal-fired electricity generation by nearly two-thirds over the past decade. This is despite a brief rise after Russia’s 2021 invasion of Ukraine.
Clean Flexibility: The Backbone of Solar’s Future
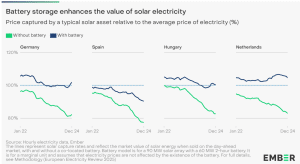
Clean flexibility is central to ensuring the continued growth of solar energy in Europe. Batteries, in particular, play a critical role in shifting energy supply to match demand. By storing excess energy generated during sunny hours and delivering it when demand peaks, batteries stabilize the grid and maximize solar’s value.
Co-locating batteries with solar plants is quickly becoming an industry standard. This practice enables solar producers to avoid selling electricity at low midday prices and instead capitalize on higher prices during evening peaks. It also strengthens the financial case for solar energy by ensuring profitability even in periods of surplus generation.
In 2024, the deployment of battery storage continued to grow rapidly. EU-installed battery capacity doubled from 8 GW in 2022 to 16 GW in 2023.
However, this growth remains uneven, with 70% of capacity concentrated in Germany and Italy. To fully realize the potential of batteries, the EU must address barriers like double grid charging and restrictive market participation rules.
Solar Savings: Economic Wins and Consumer Perks
Solar energy’s rapid growth delivered significant economic benefits in 2024, particularly through reduced electricity prices. Abundant solar generation during midday hours frequently drove hourly power prices to zero—or even below.
- Negative or zero-price hours doubled in 2024, occurring 4% of the time across the EU, compared to 2% in 2023.
These price dynamics create opportunities for consumers and market participants alike. Consumers can save money by using smart electrification technologies to shift energy use to periods of lower prices.
Meanwhile, market players, such as battery operators, can earn additional revenue by purchasing power at low midday prices and selling it during high-demand evening hours.
Despite the successes of 2024, significant challenges remain, however. One major barrier is the lack of infrastructure to support flexible energy use. For example, smart meters are essential for giving consumers real-time control over their energy usage, but adoption remains low.
In 10 EU countries, fewer than 30% of households have smart meters, and six countries report penetration below 10%. Additionally, the prevalence of fixed-price electricity contracts limits consumers’ ability to take advantage of low-cost solar energy during midday hours.
Grid expansion and modernization are also critical. While solar growth has exceeded expectations, national targets for grid development remain outdated. Expanding cross-border interconnectors will allow countries to share surplus solar energy, reducing reliance on fossil fuels and improving grid stability across the region.
The year 2024 was a milestone for solar energy in Europe, highlighting the industry’s ability to drive decarbonization and lower energy costs. With the right mix of technological advancements, grid modernization, and supportive policies, Europe could meet its 2030 solar targets. By doing so, the region can lead the global transition to clean, reliable, and affordable energy.
The post Europe’s Solar Industry Saw Record Growth and Innovations in 2024 appeared first on Carbon Credits.
A few months ago I went to a climate change forum at the Center for Brooklyn History. The panel I attended, “Confronting Climate Change: Understanding Deniers,” featured the prominent climate activist, Bill McKibben.

Bill McKibben. Courtesy https://billmckibben.com/.
I was curious to hear McKibben’s take on climate change deniers. I don’t regard the true deniers as a big problem – they’re only 11-15% of our country, according to most polls. Rather, I wondered if McKibben would label as “climate deniers” people who agree that climate change is a significant problem but disagree with his framing and his proposed solutions. I have worked for decades on energy and climate matters as an energy lawyer. Now, more than ever, I believe that to address climate change we need to build a big tent.
In the Q&A I tested where McKibben is on this by asking if he would label as a climate denier someone who subscribes to the main tenets of climate change science yet holds that natural gas has a role to play as a bridge fuel. (Our exchange starts at 1:12:45 of the video.)
This could have been a chance for McKibben to make clear that such a view isn’t climate denialism, even if he feels it’s misguided. But he punted, saying “I don’t care whether they’re deniers or not.” For good measure, he threw in his long-standing refrain that swapping coal for natural gas makes climate change worse, despite coal’s far higher carbon content per unit of energy.

674-MW methane-powered generating station, Salem, MA.
As you can hear in the recording, McKibben’s claim that gas is worse than coal draws on the work of Cornell scientist Robert Howarth. Yet McKibben didn’t mention that Howarth’s work is controversial and disputed by many scientists. The crux of the dispute is whether methane’s impact on warming should be measured with a 20-year or 100-year time frame.
Methane is a relatively short-lived greenhouse gas, with a lifetime of around 10 years, versus the 100-year life applicable to carbon dioxide. But each ton of methane is far more potent while in the atmosphere, trapping roughly 100 times as much heat as a ton of CO2. These cross-cutting facts about atmospheric methane — shorter life but greater potency than CO2 — have resulted in two opposing camps: one insisting on a 20-year timeframe for greenhouse gas accounting, the other adhering to the established 100-year frame. This matters because with a 20-year timeframe, generating electricity with natural gas (which, chemically speaking, is essentially all methane) is more damaging to climate than coal-fired electricity.
McKibben blew past this dispute. To hear him at the Center for Brooklyn History, one would have no inkling that there’s an active disagreement over which timeframe to use, that there are staunch climate activists who favor the 100-year time frame, and that the Intergovernmental Panel on Climate Change (IPCC) generally uses the 100-year timeframe.

McKibben’s latest (2025) book. Published by W.W. Norton & Company.
McKibben also insisted that a discussion about natural gas’s potential role in mitigating climate change as a replacement for coal is irrelevant because solar “is now our cheapest resource.” McKibben’s claim, of course, suffuses “Here Comes the Sun,” his 2025 book that extols solar power as the cheapest solution for all of our energy needs. But this too is questionable, because it’s based on cost comparisons between solar farms and natural gas power plants (or nuclear power plants) that fail to consider that electricity supply and delivery is a complex system of wires and plants rather than individual power plants. Based on his remarks, McKibben is choosing to ignore studies such as the comprehensive 2025 report from the Clean Air Task Force that concluded that plant-level cost comparison “is a good metric to track historical technology cost evolution [but] is not an appropriate tool to use in the context of long-term planning and policymaking for deep decarbonization.” And the task force is not alone in finding that when electricity is treated as a system, solar loses its place as the cheapest low-carbon resource.
The dogmatism McKibben displayed at the Brooklyn meeting was unfortunate. We’re in a time when efforts to combat climate change are in retreat. A unified front is required to turn the tide. Instead of doubling down on absolutist positions, activists like McKibben who seem convinced that the solution to climate change is all-renewables, end of discussion, should be seeking common ground with others who want climate action but believe that nuclear power and natural gas must also play a role.

NYC Climate March, Sept 17, 2023. Photo: C. Komanoff.
Climate change activists need to build a bigger tent, rather than call anyone who disagrees with their positions a climate change denier. It is striking that McKibben stuck to his guns after saying in the same talk that the most important goal for everyone right now is to help climate change realists win more House and Senate seats in this year’s midterms. As some have noted, an absolutist position on natural gas appears less likely to achieve that win and politicians are following that advice.
Will McKibben evolve? He has demonstrated that he knows how to build a national climate movement centered around issues like divestment. Given the current political situation, he should focus on building an even bigger tent by welcoming all of the 85% who believe that we need to address climate change but do not agree with his ideological positions.
Rich Miller is an energy lawyer who has worked for a variety of stakeholders and now gives walking tours in lower Manhattan on the history of electricity.

Image generated with Claude. Why have we juxtaposed a bicycle with balcony solar? Read on.
First it was Plug-In Solar. Then it was Balcony Solar. Now it’s Guerrilla Solar, at least according to Inside Climate News, which yesterday proclaimed that The ‘Guerrilla Solar’ Era Has Arrived.
“It,” of course, is Modular solar panels. They’re the hot new photovoltaic solution: cheap enough to buy at Home Depot, easy to hang or prop to catch maximum rays, and small enough to fit on a balcony (if you’ve got one) and plug into your “home grid.” But, alas, too meager a generator of electricity to be more than a bit player in decarbonizing most U.S. homes.
How do I know? I’ve done the math.
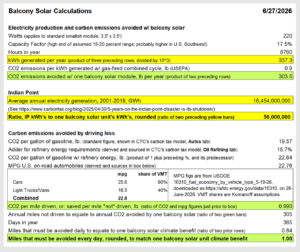
A standard, lower-end 220-watt balcony solar array will produce 337 kilowatt-hours a year, or 28 kWh a month averaged over the course of a year. That’s for a 220W unit measuring 3.5 feet by 3.5 feet. (220W x 1/1000 x 17.5% x 8760 hours per year = 337 kWh. Calculation assumes a 17.5% full-year capacity factor, which is arguably generous for New York, where I live. )

Our balcony solar mashup. Top: an install in Germany. Bottom: Home Depot advert.
A typical U.S. home consumes 10,500 kWh a year, or 28 to 29 kWh per day, says Solartech, drawing on U.S. Energy Information Administration data. That puts a home’s daily power needs on par with a balcony solar unit’s monthly output. In effect, once each month the balcony array gifts a homeowner or renter a bit more than day’s full complement of electricity. And earth’s atmosphere gets the same respite: a 3 percent reduction in carbon emissions caused by the home’s electricity usage.
(The 3 percent figure could also be calculated directly by dividing 337 kWh per year of solar production by 10,500 kWh per year to run the home. For bigger or smaller arrays, just prorate your assumed wattage by my 220W; for 440W, say, double my figures.)
Balcony Solar metrics
Why write about balcony solar if it’s so inconsequential? CTC’s mission includes puncturing would-be climate balloons before they ascend too far. In the same vein, we practice quantification to make clear what does and doesn’t move the climate needle. (More on that further below.)
The best way to depict balcony solar’s climate value is to express it in terms of tangible metrics. We’ve selected two. Both assume the basic, lower-end PV array I assumed at the top: a 3.5 foot-square array whose peak output is 220 watts.
1. It would take 50 million 220W balcony solar units (bsu’s) to restore the climate benefit we destroyed in 2020-2021 when we shut the high-performing Indian Point nuclear power plant 32 miles from Midtown Manhattan.
2. A single person cutting back their driving by a mile a day would provide the same climate benefit over the course of a year as a single 220W bsu.
(Calculations in sidebar. Now you know why we led with images of an urban dweller as cyclist and balcony solar user.)
Yes, it’s dense — as befits a sidebar. The numbers tell a story. Follow the color co-ordination.
Ponder that: It would take fifty million smallish bsu’s to level up to the fossil fuel carbon emissions that Indian Point was keeping at bay by supplying the New York City area year in and year out with abundant carbon-free power. Deploying that many balcony solar units would entail 10 bsu’s for each of the 5 million households in the MTA’s service territory. (The Metropolitan Transportation Authority provides subway, bus and commuter rail transit in the five boroughs and seven suburban counties.) Or, if those same households upgraded to 1100-watt bsu’s, collectively they would still make up only half of the lost Indian Point power.
The second comparison, involving driving, is perhaps trickier to grasp but more interesting, since it relates to people’s behavior. Living differently isn’t part of public discourse, at least not in the USA, and especially when what’s being served up is using less. But “reducing,” as we might call it (remember “Reduce, Reuse, Recycle”? or, “Insulate, then Insolate”?) is just as potent for cutting emissions as switching to renewables — even more so when the reducing means driving less, considering the multitude of benefits that accrue from diminishing cars’ imprints on our communities. Still, staying on topic: driving just one fewer mile per day brings about the same shrinkage in carbon emissions as deploying one 220W solar array.
What Balcony Solar boosters are really saying
To be fair, our friends at Inside Climate News and, yes, The New York Times appear to be trying to modulate their balcony solar enthusiasm.
ICN‘s Dan Gearino, whom we cited up front, said he looked to Germany, the birthplace of balcony solar, to see if the units made sense for U.S. households. His takeaway: “It may make more sense financially to spend the cost of plug-in solar on insulation, air sealing or other basic measures to reduce energy use.” Hooray: insulate before you insolate.
Gearino helpfully interviewed renewables guru (and U.S. emigré) Craig Morris, who currently heads Germany’s plug-in solar trade association, Bundesverband Steckersolar. To Morris, balcony solar’s main advantages are that it provides power without taking up land, and that it affords people a way to “become participants in the transition to clean energy.” Behold, guerrilla solar. That, in turn, bolsters “the political consensus that supports the transition.” But Morris also made clear that widespread adoption of plug-in solar would only meet “about 2 percent of Germany’s electricity demand.”
Morris’s “about 2 percent” feels right for Germany. But not for the U.S., where widespread adoption of virtually any individual carbon alternative seems forever out of reach, and where the energy pie is so much larger — think giant fridges, freezers for beer, steroidal homes bursting with piles of powered toys, not to mention industrial and institutional electricity use that Morris correctly excluded from his figure.

Don’t forget to micro-dose. NYT headline + image for David Wallace-Wells’ guest essay (see text). Image by Rui Pu.
Both Gearino and Morris seem more measured than climate journalist Robinson Meyer, founding editor of Heatmap and frequent contributor to The Times, where he wrote about balcony solar in mid-June.
“New zero-carbon power kits will allow Americans to make their own energy choices,” declares the callout to the print version of Meyer’s NYT guest essay, The Tiny Solar Panel That Could Change America. (The even more expansive print headline invites us to “Forget Roofs. Backyard Solar Is the Next Frontier.”)
Wallace-Wells is of two minds. He calls balcony solar “a small way that apartment- and condo-dwelling Americans can take ownership of their energy choices and cut down their pollution on the margins.” No quarrel there, thanks to his qualifiers “small” and “on the margins.” Earlier, though, he opines that balcony solar units “have the potential to change how Americans understand and consume energy,” But read further and you’ll again see Wallace-Wells cautioning that “Balcony solar will play one small role in [the] drama” of transiting to the new world of clean, abundant energy.
Any such caveats are welcome these days, amid widespread solar hoopla. Still, it doesn’t seem to be in Wallace-Wells’ toolkit — or that of Inside Climate News and other mainstream climate journalists — to tutor their audiences as to the true limits of balcony solar and other panaceas. Just like it wasn’t in their field of vision a decade ago to lay out the true stakes of shutting Indian Point as Riverkeeper was singing its siren song.
What’s Next for NY Balcony Solar
Meantime, as Canary Media reported recently (and helpfully), New Yorkers concerned with climate and affordability are waiting for NY Gov. Kathy Hochul to sign the recently passed SUNNY (Solar Up Now New York) Act legalizing balcony and other plug-in solar. It would be head-spinning (and politically suicidal) if she didn’t, given near-universal support ranging from Con Edison to DSA Assembly Member Emily Gallagher, who told Canary Media, “This is the most popular bill I’ve [ever] worked on.”
My guess is that Hochul is waiting for the right moment, and perhaps the right “package,” that can advance and not undercut her push to launch five large new nuclear power plants around the state — one to be built by the public New York Power Authority, the others to be constructed and operated privately. A little bit of math, a la what we offered here a la Indian Point, might help her out.
The governor also must manage the veritable hot potato of her deferred implementation of the landmark 2019 Community Leadership and Climate Protection Act. She might do well to consider jettisoning the act’s unwieldy cap-and-invest centerpiece in favor of a straight-up carbon tax (with the revenues distributed pro rata to the state’s households) in its place. That, far more than balcony (or guerrilla) solar, could blow open the door to the “innovations and technologies we cannot yet imagine” that Wallace-Wells fantasized about in his Times essay.

On 11 June 2026, the Science Based Targets initiative (SBTi) published the most substantial revision of its flagship corporate framework since its introduction. The SBTi Corporate Net-Zero Standard Version 2.0 takes effect on 1 February 2027 and reshapes the way companies approach their net-zero targets.
![]()


-
Greenhouse Gases11 months ago
Guest post: Why China is still building new coal – and when it might stop
-
Climate Change11 months ago
Guest post: Why China is still building new coal – and when it might stop
-

 Greenhouse Gases2 years ago
嘉宾来稿:满足中国增长的用电需求 光伏加储能“比新建煤电更实惠”
-

 Climate Change2 years ago
嘉宾来稿:满足中国增长的用电需求 光伏加储能“比新建煤电更实惠”
-

 Renewable Energy8 months ago
Sending Progressive Philanthropist George Soros to Prison?
-
Climate Change2 years ago
Bill Discounting Climate Change in Florida’s Energy Policy Awaits DeSantis’ Approval
-

 Carbon Footprint2 years ago
US SEC’s Climate Disclosure Rules Spur Renewed Interest in Carbon Credits
-
Greenhouse Gases12 months ago
嘉宾来稿:探究火山喷发如何影响气候预测