
Nitrogen fertilisers, manure and other agricultural sources drove almost three-quarters of human-caused nitrous oxide emissions in recent years.
That is according to the Global Carbon Project’s second “global nitrogen budget” – an assessment of the origins and climate impacts of the world’s nitrous oxide emissions.
The research, published in Earth System Science Data, finds that nitrous oxide emissions from human activities rose by 40% over the past four decades, partly driven by growing global demand for meat and dairy.
Nitrous oxide emissions over the past decade exceeded even the highest projected levels in emissions pathways, the research finds.
Continuing to emit the greenhouse gas at current rates would “really affect” the world’s ability to achieve the long-term goal of the Paris Agreement to limit global warming to “well below” 2C, the lead author of the study tells Carbon Brief.
One expert, who was not involved in the research, says the findings show “all too clearly” that nitrous oxide emissions “are still going rapidly in the wrong direction”.
Potent greenhouse gas
Nitrous oxide (N2O) is a long-lasting greenhouse gas that is around 270 times more potent than CO2. It is the third-largest contributor to climate change, after CO2 and methane.
Various natural sources generate nitrous oxide, including tiny organisms in the world’s oceans and soils. These natural emitters accounted for 65% of all nitrous oxide emissions over 2010-19.
Human activities caused the remaining 35% of emissions, particularly nitrogen fertiliser use and manure management in agriculture. The burning of fossil fuels and biomass also produce nitrous oxide, but to a lesser extent.
The new study assesses both natural and human-caused sources of nitrous oxide to see how they have changed over time and how they are contributing to climate change.
It divides the sources and sinks into 21 categories, such as direct emissions from nitrogen use in agriculture and the exchange of CO2 between the land and atmosphere .
The researchers use a range of satellite data, models, algorithms and inventories to assess emissions over time.
The study finds that human-caused nitrous oxide emissions “significantly increased” from 1980 to 2020, growing by 40% during this time period. This rise was spurred on, in part, by growing demand for meat and dairy.
This is a jump of 10% in these human-caused emissions from the last nitrous oxide assessment, which covered data over 1980-2016.
However, the new study includes more categories than the previous global assessment, including emissions from microbe activity in the shallow waters over continental shelves. The researchers in the study say this explains some of the higher estimates in the new report.
Concentrations of the greenhouse gas in the atmosphere have also risen faster in the past three years than any other time since 1980.
Prof Hanqin Tian is the lead author of the study and an environmental sciences professor at Boston College. He tells Carbon Brief that nitrous oxide emissions continuing at current rates would “really affect the Paris climate agreement” goals.
Natural nitrous oxide emissions, on the other hand, were “relatively stable” over the period covered by the research. Tian explains:
“In terms of the total number, natural emissions are very high. But over long time periods, they stay stable. So natural emissions do not really contribute to climate change from pre-industrial times to now.”
Human-caused emissions have increased significantly. The below infographic outlines the changes in different nitrous oxide emissions sources from 2010 to 2019.

Prof Dave Reay, the chair in carbon management and education at the University of Edinburgh, who was not involved in the study, says that the research is “really significant” for both scientists and policymakers. He tells Carbon Brief:
“Nitrous oxide’s importance can sometimes be obscured by the larger climate forcing effects of CO2 and methane, yet every missed opportunity to cut nitrous oxide emissions drags the world still further away from achieving the Paris climate goals.”
The researchers highlight that human-caused nitrous oxide emissions need to be cut by at least one-fifth by 2050 to help limit long-term warming to 2C, according to the Intergovernmental Panel on Climate Change (IPCC).
Reay says this study shows “all too clearly” that these emissions are “still going rapidly in the wrong direction”.
Agricultural emissions
Agriculture was the “major driver” of increased human-caused nitrous oxide emissions over the past four decades, the study says. In total, the researchers find that the sector was responsible for 74% of these emissions over 2010-19.
While agricultural emissions increased over time, other human-caused nitrous oxide emissions from fossil fuels and industry decreased slightly between 1980 and 2020.
Cutting nitrogen use in agriculture is a “quite complex issue related to food production, food security” and a range of other issues, Tian says.
Requirements to cut nitrous oxide emissions, particularly from livestock, have been a major political issue in the Netherlands and other countries. Nitrous oxide emissions are “expected to continue rising” over the next few decades due to the growing demand for food, the study says.

Reay says that reducing nitrogen use in agriculture “can yield benefits not just for climate change mitigation, but for food production, air and water quality and biodiversity, too”. He adds:
“The array of strategies to address these losses – primarily through improving so-called nitrogen use efficiency across our food systems – are already showing positive results in some areas of Europe and south-east Asia.”
An excess of nitrogen used on the land can wash into lakes, rivers and oceans. This run-off causes damage to plants, animals and humans and spurs on toxic algae. Nitrous oxide also contributes to depletion of the ozone layer.
Top-emitting countries
The study also examines emissions in 18 different regions, finding that they grew in some countries and decreased in others over the past four decades.
China, India, the US, Brazil and Russia were the five biggest nitrous oxide emitters in 2020, the study findings show.
Human-caused emissions increased by 157% in India, 135% in China and 131% in Brazil over 1980-2020.
China alone made up 40% of the overall increase in global human-caused nitrous oxide emissions between 1980 and 2020.
Although the country remains the biggest emitter, China’s nitrous oxide emissions have decreased in recent years as a result of efforts to use nitrogen fertilisers more efficiently, Tian says.

Nitrous oxide emissions have reduced in several parts of the world since 1980: Europe, Russia, Australia, New Zealand, Japan and Korea.
Europe – the biggest nitrous oxide emitter in 1980 – has seen the most significant drop in the four decades since. Emissions fell by one-third (31%) during this time, largely due to fossil fuel and industry emissions cuts in the 1990s.
Agriculture-related nitrous oxide emissions also decreased in Europe during this time, but the drop has levelled off since the 2000s, the study notes.
Exceeding future projections
The scientists also explore how current nitrous oxide emissions compare with those from scenarios of future projections of climate change.
The charts below show how global nitrous oxide concentrations in the atmosphere (black line) compare with projections under the “Representative Concentration Pathways” (RCPs, left) and the “Shared Socioeconomic Pathways” (SSPs, right).
The charts highlight that atmospheric concentrations of the greenhouse gas over the past decade have exceeded even the projections under the very-high-emissions trajectory, RCP8.5 (red dashed line).

The researchers outline some “major uncertainties” with their findings and the scientific understanding of where nitrous oxide comes from.
These include the understanding of emissions from soils in tropical ecosystems in the Amazon Basin, the Congo Basin and south-east Asia, alongside areas using high levels of fertilisers, such as the US “corn belt”.
The study also mentions uncertainties around estimates for the impact of deforestation on nitrous oxide emissions.
The researchers propose setting up a global network to better monitor and model nitrous oxide emissions. Reay says that this is a “very timely suggestion”, adding:
“With all nations needing to submit their updated national plans for climate action in the run up to COP30 in Brazil next year, better measurement of nitrous oxide emissions holds the promise of better reporting and, crucially, better efforts to cut them.”


The post Agriculture ‘major driver’ of rise in nitrous oxide emissions over past 40 years appeared first on Carbon Brief.
Agriculture ‘major driver’ of rise in nitrous oxide emissions over past 40 years
Climate Change
Analysis: Energy-efficient air conditioning could save Indian homes 69bn rupees a year
More energy-efficient air-conditioning units could, together, save Indian households ₹69bn ($724m) a year, according to new analysis by Carbon Brief.
Climate change-induced extreme heat is driving up the use of air conditioning across the country, as people try to cope with record-breaking temperatures.
This demand, however, is straining the country’s power grid and raising emissions.
On 21 May 2026, India’s power demand reached a record 270 gigawatts (GW), fuelled by a heatwave sweeping across the country and a surge in air-conditioning demand.
Carbon Brief’s analysis shows that, if the roughly 15m households expected to buy a new air conditioning (AC) unit this year bought a “five-star” rated one instead of a “two-star”, it would cut carbon dioxide (CO2) emissions by nearly 5m tonne (Mt).
The installation of AC units in India is currently uneven and ongoing challenges remain, predominantly around the cost of the technology.
Below, Carbon Brief looks at what more energy-efficient models would mean for India’s emissions and household electricity savings, as well as opportunities and barriers to cooling access.
Record heat
Historically, India has had one of the lowest levels of access to cooling in the world. As the nation continues to see an increasing number of heatwave days, this is shifting.
For example, India saw record-breaking heat in 2024 and nearly 14m air conditioners sold – up from 10m in 2023.
Between 2021 and 2023, AC sales volumes increased by more than 25% year-on-year in India.
While solar power is playing an increasing role in meeting the daytime electricity demand from these units, coal power plays a significant role in powering air conditioners on warm nights.
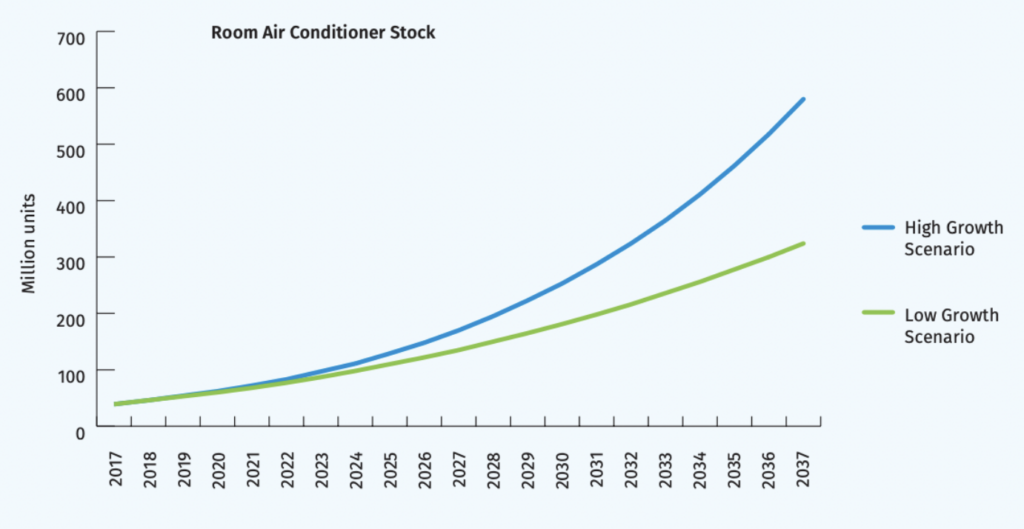
By 2037, India’s space-cooling demand was expected to grow nearly 11-fold in a business-as-usual scenario compared to 2017, according to the government’s 2019 India Cooling Action Plan (ICAP).
According to a World Bank study, this would mean a new air-conditioning unit is bought every 15 seconds in India. There would also be a 435% increase in annual greenhouse gas emissions related to air conditioning in the country over the next two decades.
The chart below shows the ICAP’s estimated rise in air conditioner units in India from 2021 to 2037. The blue line represents a high-growth scenario, while the green line corresponds to a low-growth scenario.
Growing demand
Despite the upswing in installations over recent years, it remains rare for households to have access to air conditioning in India.
According to India’s national sample survey in 2020-21, only 4.9% of Indian households owned air conditioning, with ownership concentrated among the urban rich. As of 2024, this had increased to around 8%.
(Ownership of evaporative air coolers is significantly higher than it is for air conditioning, particularly in the arid north and central Indian states, where humidity is low.)
Dr Nikit Abhyankar, an associate adjunct professor at the Goldman School of Public Policy at the University of California Berkeley, tells Carbon Brief that India is set to add between 100-150m new air conditioners in the next 10 years, which could go up to 200m “if you factor in the crazy heatwaves”.
According to his research, the two factors that drive “dramatic” sales of ACs are income and extreme temperatures.
He tells Carbon Brief:
“The moment you cross a specific income threshold, the first appliance you buy is an air conditioner, no matter whether it’s hot or not. And the moment there are extreme temperatures, the next summer, you see a huge wave of new ACs being purchased.”
With that in mind, he says India offers a “classic lock-in opportunity”, since 90% of the air conditioners that will exist in 2040 have yet to be purchased, particularly given the tendency among Indian users to repair and reuse units. Abhyankar continues:
“That’s why making sure that first AC purchase is the most efficient one is very important in India, because that AC is not going out of the market in seven years.”
Energy-efficient units
With the number of air-conditioning units in India on the rise, ensuring they are as energy-efficient as possible could save households money, while cutting emissions and electricity demand.
India’s Bureau of Energy Efficiency (BEE) mandates star ratings for air conditioners to indicate their efficiency. It uses a metric called the Indian seasonal energy efficiency ratio (ISEER), which is based on an India-specific temperature distribution.
Ratings range from one to five stars, with the latter being the most energy-efficient.
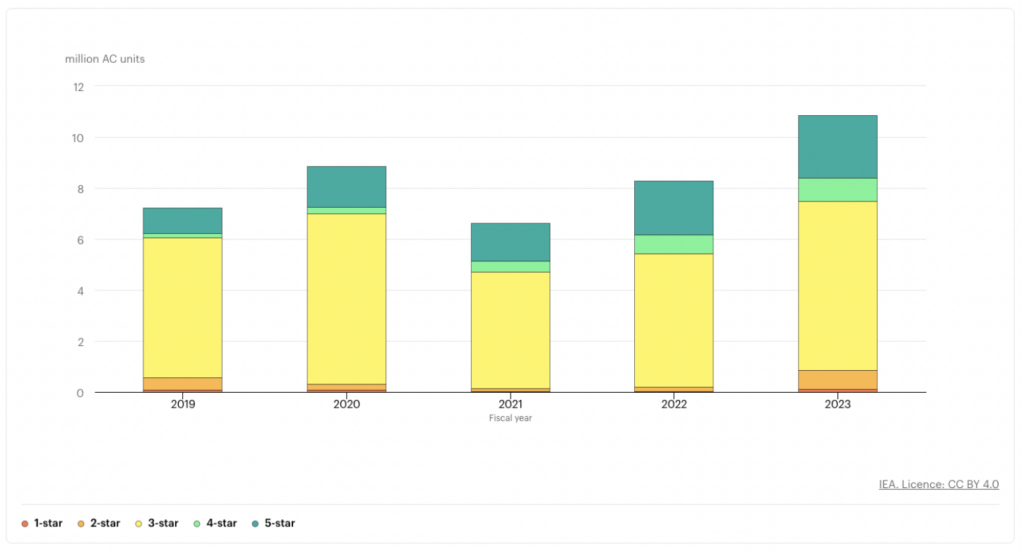
According to the International Energy Agency (IEA), three-star units “dominate” India’s air-conditioning market, “possibly due to [up-front] cost considerations”, while four- and five-star units account for a minority of sales.
The chart below shows AC production volumes in India between 2019 and 2023 by energy-efficiency star rating, according to the IEA.
Carbon Brief analysis finds that buying a five-star air conditioner could cut the emissions associated with generating electricity to run the unit by around 300 kilograms (kg) of CO2 per year, when compared to a two-star unit.
As such, if all 15m air-conditioning units expected to be sold in 2026 were five-star, it could save 5MtCO2 annually.
This is roughly equivalent to the emissions from an average-sized coal-fired power plant, the analysis shows.
In a year, the lower electricity demand from more efficient units could mean ₹69bn ($724m) in cost savings for consumers, as shown in the chart below. Each affected household could save ₹4,600 ($48) annually on their bills.
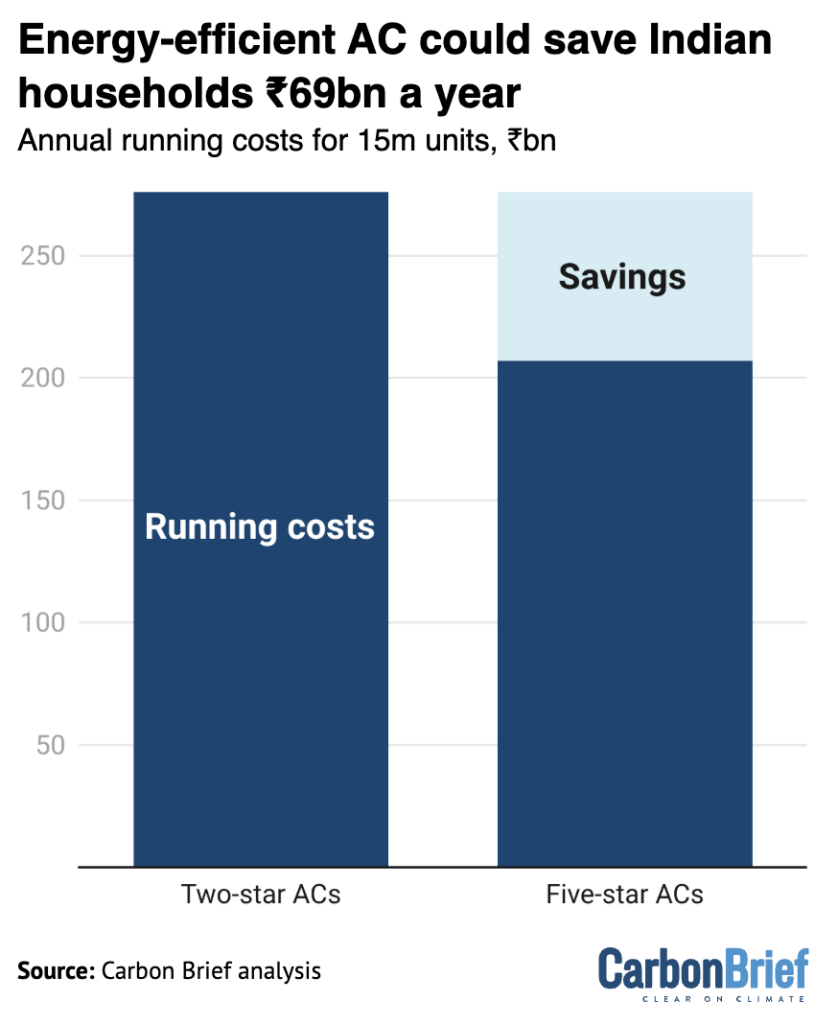
There are also significant savings from five-star units compared with three-stars, amounting to around 150kgCO2 and ₹2,300 ($24) per household per year.
Carbon Brief’s illustrative analysis is supported by a new working paper from the India Energy and Climate Center (IECC) at UC Berkeley, which looks at the longer-term impact of AC demand on electricity demand and emissions, as well as grid investment costs and consumer savings.
Released in May 2026, it says that room air conditioners already account for nearly a quarter of India’s peak electricity demand (60-70GW).
The authors estimate that AC-driven peak power demand could reach 120GW by 2030 and 180GW by 2035, pushing India’s power grid beyond its capacity. They warn:
“Even with all under-construction generation and storage projects online, power shortages are expected as early as 2028.”
Sustained energy-efficiency improvements, however, could reduce this cooling-driven peak power demand by 10GW by 2030 and 47GW by 2035.
They estimate that these improvements could help avoid nearly $80bn in power infrastructure investments and deliver $9-25bn in consumer savings between 2028 and 2035, while reducing emissions by 12MtCO2 per year by 2030.
Rolling out five-star units
While there are emissions and cost benefits to five-star air-conditioning units compared to the alternatives, the higher upfront costs can still present a barrier.
These more energy-efficient units can pay for their higher purchase price over a three-year period, but on average cost ₹5,000 to ₹8,000 ($52-84) more upfront than a three-star unit.
Researchers at the Indian climate thinktank Sustainable Futures Collaborative (SFC) called on Indian state and national governments to create a “highly-targeted active cooling” programme last year.
They recommended deploying a subsidy or a large-scale purchase programme that allows families to buy energy-efficient air conditioners. This, they said, must be targeted at portions of Indian cities with the highest heat risk, determined by the vulnerability assessments of their heat action plans.
Climate adaptation researcher at King’s College London and SFC author Aditya Valiathan Pillai tells Carbon Brief:
“Commit money to air conditioning for the poorest-of-the-poor: subsidise ultra-efficient ACs and electricity, but give them cool air at the cheapest possible, most efficient rate.
“Because these are the people running the economy, which is not going to function in a heatwave if these people are dying or unable to work.”
Methodology
Carbon Brief’s analysis is based on official energy consumption, power pricing and emissions data from different ministries and government institutions.
It uses BEE’s “search and compare” tool to list all five-star and three-star “variable speed” or “inverter” air conditioners, given their enhanced efficiency and ability to regulate humidity.
This was then filtered to air conditioners with a capacity of 1.5t, which studies say are most preferred by Indian households.
Using the same tool, Carbon Brief then listed all “fixed speed” two-star ACs of a similar capacity (1.45t to 1.55t), given that these account for the majority of two-star ACs available on the market and favoured by renters.
Based on expert estimates, the analysis lists the energy consumption of each of these key categories in kilowatt-hours (kWh) and added 15% to account for losses in power transmission and distribution.
The carbon intensity of Indian electricity is specified by the CO2 baseline database published by India’s Central Electricity Authority in November 2025.
The number of hours per year a household’s air conditioning runs is estimated at 1,600 hours by the BEE.
Carbon Brief uses a marginal electricity tariff of ₹10 per kWh to calculate annual electricity consumption costs.
This is because average electricity tariffs vary significantly from state to state, but especially by energy consumption “slabs”, with AC use pushing bills into higher-tariff rates.
For instance, in Maharashtra, electricity tariffs for domestic households range from ₹1.52 per unit for below-poverty-line households to ₹16.64 per unit for homes using more than 500 units of electricity.
Savings from higher energy efficiency, therefore, reduce electricity consumption in the highest electricity tariff block, where rates are the most expensive.
Cooling hours
Air-conditioner usage varies across India’s climatic zones. The ISEER metric that underpins star ratings estimates that, on average, a household air conditioner runs for 1, 600 hours a year.
This estimate is based on 2014 weather data for 54 cities across India, to see how many hours in a year temperatures exceed 24C.
Refrigerant emissions
The analysis only accounts for emissions from electricity generation and does not factor in “fugitive” emissions from refrigerant leaks.
These are significant, given that refrigerants are greenhouse gases that can have hundreds of times more warming potential than CO2.
According to a study published by climate thinktank iForest last year, Indian households with air conditioning are refilling their refrigerants more frequently than the global average.
It estimates that greenhouse gas emissions from refrigerant release from India’s air conditioners were 52Mt of CO2 equivalent (CO2e) in 2024, likely to increase to 84MtCO2e by 2035.
Cooling access and population data
Government estimates vary on how many Indian households do not own a single air conditioner, with little publicly available data differentiating between cooling devices and a delayed national census.
India’s national sample survey, published in 2020-21, is the only one of its kind in recent years to separate air-conditioner ownership from air cooler ownership, estimating that only 4.9% of all Indian households owned an air conditioner.


The post Analysis: Energy-efficient air conditioning could save Indian homes 69bn rupees a year appeared first on Carbon Brief.
Analysis: Energy-efficient air conditioning could save Indian homes 69bn rupees a year
Dr. Stacy Jupiter is the Executive Director of the Wildlife Conservation Society’s Global Marine Program. Melissa Wright is Bloomberg Ocean Initiative Lead at Bloomberg Philanthropies.
For years, the dominant story on coral reefs has been one of inevitable loss, with news headlines focusing on mass bleaching, ecosystem collapse, and catastrophic tipping points. As ocean temperatures continue to rise, many people have come to see the decline of the world’s reefs as unavoidable.
The threats are real and urgent, but new evidence points to a more complicated and useful conclusion: some reefs still have a meaningful chance to survive and recover, provided they are protected.
A major new analysis, published today with the support of Bloomberg Philanthropies, identifies more than 165,000 square kilometers of coral reefs, across 71 countries and 100 territories and jurisdictions, with the strongest potential to withstand and recover from climate impacts.
Drawing on more than 45,000 coral surveys, along with decades of climate and ocean data, the research finds that three times more reefs may be capable of surviving the climate crisis than previously understood. That has major implications for reef-dependent communities, food security, coastal protection, fisheries, tourism, and national economies.
-
Offshore oil and gas expansion threatens key marine ecosystems, report warns
Sea life in countries like Kenya is under threat from planned new oil and gas production, analysis by environmental groups has found -
The Pacific made history in the courts – now we must do it in the negotiations
Legal clarity alone will not lead to reduced emissions, more finance or stronger national climate plans – political will is key to meeting states’ obligations


Essential natural infrastructure for communities
The findings make clear that reefs will not all respond to climate impacts in the same way. Some are located in rare underwater cool spots that can help shield them from extreme heat. Some show greater resistance to bleaching and other climate-related stress. Others recover more quickly after severe disturbances. These differences matter because they show where protection can have the greatest long-term impact.
More than 500 million people depend on reefs for food, livelihoods, and coastal protection. For those communities, climate-resilient reefs are not an abstract conservation priority. They are essential natural infrastructure. They help protect coastlines, sustain fisheries, support local economies, and reduce climate risk. Because ocean currents move coral larvae and marine life between reef systems, some of these reefs may also help regenerate wider reef ecosystems after climate shocks.
This should change how governments, funders, and conservation partners prioritize action.
Climate change remains the greatest long-term threat to coral reefs. At the same time, many of the pressures pushing reefs closer to collapse are immediate and local. Sewage pollution, deforestation, agricultural runoff, destructive fishing practices, and poorly managed coastal development continue to damage reefs that are already under stress. Recent research shows that water pollution and fishing pressure are now among the leading local threats affecting nearly two-thirds of the world’s coral reefs.
These pressures can be reduced. Governments and local partners are already working to improve reef management, cut pollution, strengthen enforcement, and protect critical ecosystems. Those efforts need to move faster, alongside much stronger action to reduce greenhouse gas emissions.
Prioritising climate-resilient reefs
The new maps of climate-resilient reefs give governments, communities, and reef managers a clearer basis for action. They show where reefs have the strongest potential to persist over time, and where protection can deliver the greatest benefits for people, coastlines, and economies.
Right now, only around 28 percent of the identified climate-resilient reefs fall within protected or conserved areas. If these reefs are among the most capable of surviving climate impacts and helping regenerate broader reef systems, they should be prioritized for protection, management, and investment.
The case for action is practical as well as ecological. Healthy reefs can reduce wave energy by up to 97 percent, helping protect coastlines from storms, flooding, and erosion. They support fisheries that feed millions of people, sustain tourism jobs and local economies, and help reduce climate risk for vulnerable coastal communities.
For many families, a healthy reef means food, income, and protection when storms hit. For Indigenous Peoples and coastal communities, reefs are also tied to culture, heritage, identity, and traditional knowledge systems.
Ocean conservation must catch up
Governments are beginning to recognize the urgency of protecting climate-resilient reefs. At last year’s UN Ocean Conference in Nice, 11 countries signed a declaration committing to stronger protection of these reefs, including action to address destructive fishing, pollution, and unsustainable coastal development.
As leaders meet in Kenya this week to discuss the challenges facing the world’s ocean, more governments should join the declaration and help build a broader coalition committed to safeguarding these critical ecosystems.
As coral reefs pass tipping point, ocean protection rises up political agenda
Some countries are already showing what this leadership can look like. Brazil has included corals in its national climate plans. The Bahamas is embedding reef protection into national policy and local stewardship systems. The declaration offers a way to build on these efforts and scale them globally.
But commitments will not be enough. Success will depend on implementation. That means stronger protection and management, reduced local pressures, increased investment, and meaningful support for the Indigenous Peoples and local communities stewarding these ecosystems.
The science is clear. Many reefs still have the capacity to persist and recover. The question is whether policy and investment will move quickly enough to protect them, so they can continue sustaining communities, economies, and coastlines for generations to come.
The post Coral reefs are not doomed – but policy must catch up with the science appeared first on Climate Home News.
Coral reefs are not doomed – but policy must catch up with the science
Climate Change
Months After a Jet Fuel Leak, No Agency Tested Waters Downstream of Piscataway Creek. So Community Groups Are Doing It Themselves.
Authorities that manage the Potomac River tributary did not sample the stretch where residents fish and recreate. One Indigenous leader sees the lack of response as part of a pattern of ongoing neglect.
In the five months after jet fuel started leaking from Joint Base Andrews into Piscataway Creek, no agency tested the water or sediment some 20 miles downstream, where the creek empties into the Potomac River and the shoreline community and anglers gather to fish and boat along the riverbank.


-
Climate Change10 months ago
Guest post: Why China is still building new coal – and when it might stop
-
Greenhouse Gases10 months ago
Guest post: Why China is still building new coal – and when it might stop
-

 Greenhouse Gases2 years ago
嘉宾来稿:满足中国增长的用电需求 光伏加储能“比新建煤电更实惠”
-

 Climate Change2 years ago
嘉宾来稿:满足中国增长的用电需求 光伏加储能“比新建煤电更实惠”
-
Climate Change2 years ago
Bill Discounting Climate Change in Florida’s Energy Policy Awaits DeSantis’ Approval
-

 Renewable Energy8 months ago
Sending Progressive Philanthropist George Soros to Prison?
-

 Carbon Footprint2 years ago
US SEC’s Climate Disclosure Rules Spur Renewed Interest in Carbon Credits
-
Greenhouse Gases11 months ago
嘉宾来稿:探究火山喷发如何影响气候预测