

This is the second part of a three-part post. It begins with the failure of carbon tax advocacy and continues with the closure of Indian Point and the concurrent dissolution of my dream that renewable energy could do it all. Part I, “Beginning,” started with the Three Mile Island accident and covered the decline of nuclear dread, the advent of splendidly reliable reactor operation, and nuclear’s climate-hero status. It’s available here. — C.K.
4. A Climate Cure No One Wanted
Nuclear fission, wind turbines, solar panels. Each is a kind of miracle, creating electricity from sunlight, air currents, or the splitting of atoms rather than by setting things on fire. But to economists focused on decarbonization, a greater miracle would have been the widespread adoption of carbon taxes, or, as some prefer to call it, a “price on carbon” — a fee added to fossil fuels’ market price based on their carbon content. Such a tax would shift incentives across the economy away from using fossil fuels, cutting production of the main greenhouse gas, carbon dioxide.
Economists trace the carbon tax idea to the early 20th century British economist Alfred Pigou and his conception of “externalities” ― social costs, like pollution, that aren’t reflected in market prices, and are dumped on communities “external to the process.” My interest dates to the early 1970s, when I was a fledgling environmental analyst in New York City government. I had a front-row seat as an ingenious “sulfur surcharge” eliminated the price advantage of dirty, high-sulfur fuel oil, foiling an eleventh-hour attempt by the oil industry to undercut a groundbreaking clean-air regulation.
Much later, in 2007, I co-founded the Carbon Tax Center, an organization built around the idea of taxing fossil fuels by their carbon content. We proposed a national carbon tax starting at $15 per ton of CO2 and rising in annual steps to $100 within a decade. Our modeling suggested that by then, the myriad changes driven by the financial rewards for burning less carbon would be cutting U.S. emissions by nearly a third ― far more than conventional energy-efficiency standards or clean-energy subsidies.
To be clear, this wasn’t an either-or choice. A carbon tax was unusual in that it reinforced nearly every other decarbonization measure rather than competing with it. But what really set carbon pricing apart was its reach. Carbon taxes would reward every action that reduced fuel use ― not just buying more fuel-efficient cars, but driving less overall; not just laws mandating energy-efficient buildings, but reforming zoning to let new homes be built in town instead of spreading into sprawl; and, in the power sector, switching from higher-carbon coal to lower-carbon gas and from gas to virtually zero-carbon solar, wind, and nuclear power.
A carbon tax would have worked something like New York’s congestion pricing program, which last year began charging drivers $9 a day to enter Manhattan south of 60th Street. Congestion pricing hits gridlock with a one-two punch. The first punch is the price itself: faced with the toll, enough car owners find driving no longer worth it, that traffic actually drops. The second punch is the steady stream of subway improvements funded from the toll revenue — station elevators, real-time train signals, new lines — which pull still more commuters out of cars. Just so, the “stick” of a price and the “carrot” of better alternatives reinforce each other.
I took part in the 20-year campaign that pushed congestion pricing across the finish line. Its advent — and survival — in Trump’s second term is heartening. But it also highlights, by contrast, how little headway has been made toward a U.S. carbon price.
That failure constitutes a tragically missed opportunity for nuclear power, given how much a $100-per-ton carbon price could strengthen its economics. Compared with burning natural gas, the dominant source of U.S. electricity today, a $100/ton CO2 price would give nuclear roughly the same competitive edge as shaving 40 percent off the cost to build new reactors. Or, put another way, that carbon price would be like doubling or tripling what gas-fired power plants pay for pipeline fuel — pushing prices back to pre-fracking scarcity levels.[7])
5. Losing Indian Point
In the spring of 2020, with the COVID-19 pandemic raging, my wife and I fled the city for our cabin in the Adirondacks. One morning I was outside the general store, loading groceries onto my bicycle, when my phone started buzzing. It was Dietmar Detering, someone I knew slightly as leader of the advocacy group Nuclear NY, calling from Queens. I picked up and said hello.
“You call yourself a climate activist,” Dietmar began, his voice sputtering with anger. “Indian Point is being taken apart, and you haven’t said a word to stop it. How dare you?”
 I vaguely knew that a 2017 deal ― pushed by the self-proclaimed environmental group Riverkeeper and brokered by then-Gov. Andrew Cuomo ― was about to shut down the Indian Point nuclear plant, located on the Hudson River 35 miles north of midtown Manhattan. The older of its two reactors unit would (literally) get the chop within a week; its twin would follow in a year. Both reactor vessels would be cut to pieces and their radioactive components chemically dissolved. Once that process began, there’d be no turning back.
I stood there holding my phone, stunned. A near-stranger was berating me! I would have hung up, but there was something raw in his voice that I couldn’t ignore. I don’t remember exactly what I said ― probably some version of “don’t blame me.” After all, the carbon tax I’d spent years advocating would have made Indian Point too valuable to shut down. Then I offered what I thought was my strongest point: soon enough, Indian Point’s carbon-free electricity would be replaced by zero-carbon wind and solar anyway, so little harm would be done.
Then Dietmar lowered the boom.
“You don’t get it, do you?,” he said, his voice now cold. “Even if all those new solar panels and wind turbines get built, they won’t displace fossil fuels. They’ll just be replacing carbon-free nuclear electricity that was already protecting the climate. They can’t do both.”
“Wait. What? Say that again.”
“Think of it this way,” Dietmar said. “When new renewables have to replace an existing power source that was already displacing fossil fuels, like Indian Point, their net climate benefit is zero. The renewables you’ve been counting on to push out fossil fuels can’t do that job as long as they’re having to take the place of nuclear plants that were already doing the decarbonizing.”
Full disclosure: those aren’t Dietmar’s exact words. They’re actually mine, drawn from articles I later wrote for Gotham Gazette and The Nation, and from a letter I co-wrote with futurist Stewart Brand, yes, the “Whole Earth Catalog” guy, urging California Gov. Gavin Newsom to halt the planned closure of the Diablo Canyon reactors along his state’s coast. But they capture Dietmar’s central point: shutting down a working nuclear power plant ― or any large source of carbon-free electricity ― nullifies the climate benefit that new replacement wind and solar projects are supposed to provide.
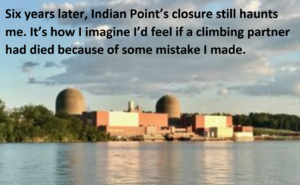
Six years later, Indian Point’s closure still haunts me. Why didn’t I speak up? It’s how I imagine I’d feel if a climbing partner had died because of some mistake I made. In New York, where I live, I measure every increment of renewable energy against the carbon benefit we threw away when Indian Point was shut down and dismantled.
 By that gauge, wind and solar look mediocre. Take those 42-inch square “balcony solar” arrays that Germans are buying like hotcakes ― they’re a neat idea, but it would take 50 million of them to match the carbon reduction Indian Point provided, as I wrote here in June. Or consider a rooftop solar setup for the City Island boathouse where my ecologically minded physicist pal stows his sailboat ― fine on its own, but matching Indian Point’s climate value would require solarizing 600,000 similar buildings across the state.[8]
Underneath these daunting numbers is Dietmar’s deeper point: all of this new renewable capacity should have been added on top of Indian Point, not built to replace it.
6. Renewables in a Dimmer Light
Solar and wind power were guiding passions of my adult life. From the 1970s onward, I savored every news story about the latest gains in solar efficiencies and blade lengths. Wind turbines especially stirred me, with their kinetic kinship to bicycles and futuristic look.
Befitting my mathematical bent, I would calculate how much fossil fuel each new wind farm would keep in the ground. For Cape Wind, intended as the first U.S. offshore wind farm, near Cape Cod, I consulted a digest of ballpark dimensions to illustrate how much coal the project would displace each year: enough to cover the entire playing field at Boston’s Fenway Park — foul territory included — in a pile three times the height of the park’s famed “Green Monster” outfield wall.[9]
While I was playing with those numbers, a Stanford mechanical engineering professor named Mark Z. Jacobson was launching a stream of papers spelling out just how many wind turbines and solar panels ― on land, at sea, on rooftops, on farmland or rangeland ― would be required to satisfy the energy needs of different states and countries.
A table in Jacobson’s paper for New York helpfully broke down how much energy had to come from each source. Offshore wind was his largest category, charged with supplying 40 percent of New York State’s energy year-round. The number of turbines: 12,700.
That figure should have given me pause. Filling that quota meant building a hundred Cape Wind projects in the waters off Long Island, even as well-heeled locals including Riverkeeper figurehead Robert F. Kennedy Jr. (yes, that Kennedy) and Walter Cronkite (yes, that Cronkite) were NIMBYing the actual Cape Wind project to death. Ditto, wind projects proposed for the next county over from our cabin in the Adirondacks.
None of those projects were ever built — not just because of local opposition, but also because of a lack of full-throated support from environmentalists who should have championed them for their climate value. Especially in liberal Northeastern states, it seemed impossible to build anything that asked property owners to tolerate construction disruption or changed views, decarbonization be damned.
You might expect the outlook for Jacobson’s all-renewables vision for New York to be improving. Wind turbines are now so prodigious that he can propose 8,000 15-gigawatt turbines instead of 12,700 5-gigawatt ones.[10] And solar power has captured the public’s imagination in a way wind power has not — it’s no accident that climate activist (and Jacobson acolyte) Bill McKibben titled his 2025 call-to-action book, “Here Comes The Sun.”
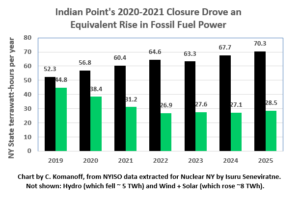
Nevertheless, the carbon-free electricity lost when Indian Point closed has gone almost entirely unreplaced. Nearly nine-tenths of the power it generated is being made up by burning natural gas — not due to corporate chicanery but because no other source has stepped up. (See chart below.)
And dreams of an all-renewables grid still have to contend with an intrinsic fault ― one even more disabling than the NIMBY opposition sparked by the projects’ thirst for land. That weakness is intermittency: the fact that wind and solar output varies not just day to day, but moment to moment, at the mercy of the weather.
Jacobson has doggedly calculated how many megawatt-hours of wind and solar would be needed to match New York’s ― and other states’ ― total annual energy use. But neither his nor anyone else’s atmospheric models are detailed enough, meteorologically, to verify that a 100% wind-water-solar grid could keep the power on continuously ― hour by hour, year in and year out. Building in extra capacity doesn’t solve this problem. Compensating for weather’s unpredictability by deliberately oversupplying wind and solar, or backing them up with batteries, may look good on paper. But either approach would be punishingly expensive and probably insufficient as well, without ample supplies of reliable, dispatchable power such as nuclear. If there’s no wind, having twice as many turbines won’t help.[11]
In New York, the political fallout from losing Indian Point’s copious ’round-the-clock carbon-free electricity is landing on Cuomo’s successor. With the plant’s closure having pushed New York’s carbon-reduction targets out of reach, Gov. Kathy Hochul this year bowed to reality and froze a 2019 law tying New York’s climate and energy future to renewables. Forces ranging from standard-issue Democrats to grassroots greens are pillorying Hochul as a sellout to Big Oil, though her proposal to add five large reactors across the state — she dubs it her Nuclear Reliability Backbone — is almost certainly a more assured path to decarbonization than the fashionable all-renewables approach.
Click here for the final installment, Why I’m Pro-Nuke Now: Conclusion.
[7] The two representations in the text of carbon pricing’s boost to new reactors’ economics are derived and sourced in my Sept. 2026 paper with James Boucher, Beyond Vogtle: What History Tells Us About the Cost of New Nuclear.
[8] Comparisons in this paragraph employ: 2,028 MW capacity and 90% capacity factor for Indian Point; 220 W capacity and 15% CF for balcony solar. 17 kW capacity and 20% CF for boathouse solar. 10 MW and 40% CF for each wind turbine.
[9] Cape Wind assumptions: 130 3.6-GW turbines and 40% capacity factor yield 1,641 GWh/year. Coal assumptions: 9,800 Btu/kWh, 11,500 Btu/lb of coal, 1.32 coal specific gravity, 62.4 lb of water per cubic foot. Calculations yield 132-foot-high coal pile covering Fenway Park’s 128,000 sq ft surface (est’d from http://www.baseball-statistics.com/Ballparks/Bos/index.htm). That is 3-4x Green Monster height of 37 feet, 2 inches, per Wikipedia.
[10] While Jacobson’s new offshore wind configuration would outproduce its predecessor by nearly two to one, he has also upped his forecast for total required energy, leaving constant offshore wind’s share 40 percent share.
[11] To take a recent example: at the onset of a late June – early July 2026 heat wave, New York State’s wind farms collectively were producing less than one percent of their rated 3,000-megawatt capacity. See my “Beyond Vogtle” report (FN 46) referenced in Footnote 7.

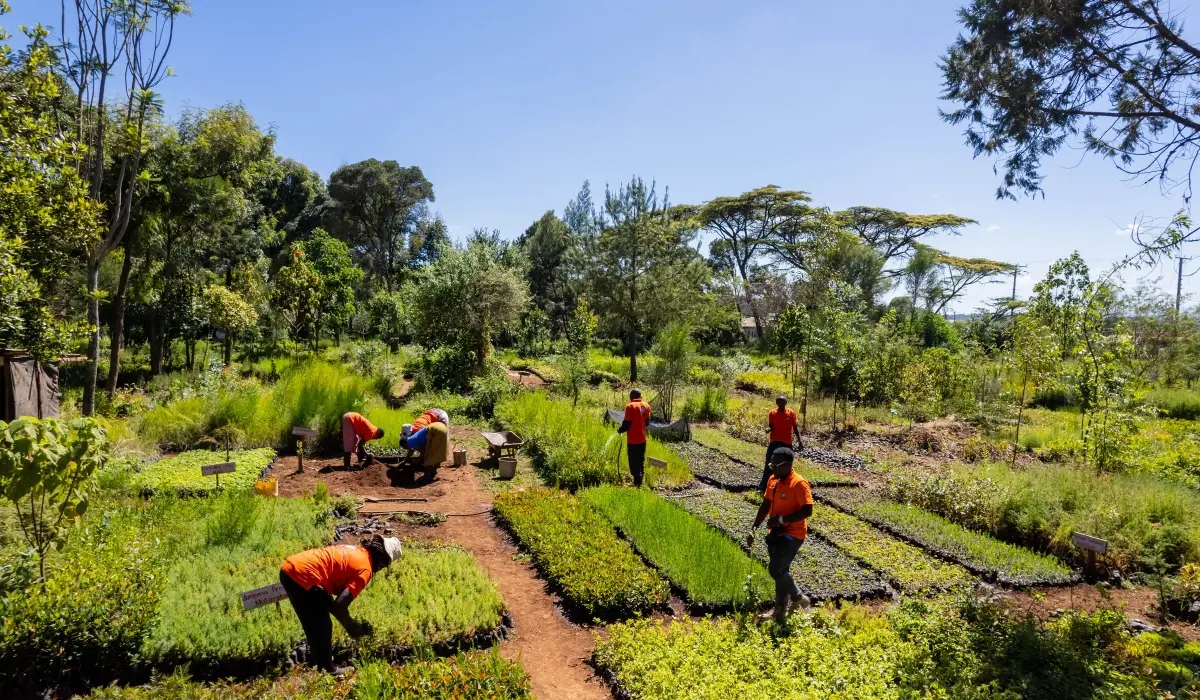
Carbon credit providers vs marketplaces is the first comparison many buyers try to make. In this comparison, a carbon credit provider is the project developer: the company that originates credits from its own projects and sells them directly. A carbon credit marketplace is a platform that lists credits from many projects at published prices.

Carbon Footprint
Democrats who call climate change an emergency should not defend a permitting system too slow to build the clean energy that would address it.”
Democrats, Take The Deal. New York Times editorial, Nov. 12.
Insetting program design starts with your supplier map. The carbon claim comes much later.
Consider a coffee procurement team that funds a farm intervention before checking its sourcing data. The supplier aggregates coffee lots from several regions. The buyer lacks farm-level traceability. Another purchaser expects to report the same outcome. A more attractive project brochure solves none of these problems.
If the distinction between a value-chain intervention and a purchased credit is still open, read CCC’s Insetting vs Offsetting guide before you set the brief.
Insetting program design begins with the purchasing relationship and works outward. You need to decide 1) where an intervention belongs, 2) what business problem it addresses, 3) who pays for it, 4) how results will be measured, and 5) what the evidence will let you say about them. This five-step playbook turns that sequence into a procurement plan.
Step 1: Insetting program design starts with supplier mapping
Start with the commodities that matter most to your Scope 3 inventory and sourcing continuity. Ask finance for spend by supplier, sustainability for the emissions baseline, and category managers for origin and volume records. Then identify which suppliers can trace material to a jurisdiction, sourcing region, producer group, or individual land-management unit.
The level of traceability affects what you can account for. Under the GHG Protocol Land Sector and Removals Standard, the spatial boundary for purchased land-based products depends on the traceability associated with each volume. Farm-specific factors or removals require physical traceability through an acceptable chain-of-custody model. A contract with a tier-one trader, by itself, does not establish a link to the farms behind its deliveries.[1]
Build a first-pass table with five columns: commodity and annual volume; supplier and origin; current traceability level; land-use and production risks; and the business owner who can change the purchasing terms. Mark missing data plainly. A blank cell is cheaper to fix before a program starts than after a claim is drafted.
If your company sets an SBTi Forest, Land and Agriculture target (FLAG), keep its land-related target boundary separate from energy and industry emissions. The current FLAG guidance also requires relevant companies to assess primary deforestation-linked commodities in their value chains.[2]
Step 2: Choose a commodity and jurisdiction for a pilot
Select one supply corridor where the sourcing connection can be established and procurement has a reason to stay. A useful pilot has repeat purchases, suppliers willing to share records, an intervention matched to a diagnosed problem, and a defined plan to measure the result. Carbon potential alone is a poor selection rule if the supplier cannot deliver the crop your business needs.
Compare candidate regions on land-use risk, supplier concentration, local rights and tenure, the availability of baseline data, and exposure to drought, erosion, or forest conversion. Check the relevant legal requirements separately. A nature project does not satisfy a due-diligence obligation merely because it has a carbon method attached.
Consider a coffee buyer sourcing from two districts. In the first, producer-group records identify the farms, while recent dry seasons have increased rejected green coffee lots. In the second, deliveries pass through several intermediaries and farm origins are unknown. Pilot shade management in the first district, with local agronomic advice and quality checks built into the plan. The buyer can trace purchases there and test the intervention against a defined sourcing problem.
Use a short decision memo to record why the selected corridor beats the alternatives, what remains uncertain, and what would stop the pilot. That memo is the first control against a project drifting toward whatever happens to photograph well.
Step 3: Design the supplier engagement and commercial model
The intervention needs an owner on each side of the contract. Decide who supplies planting material or training, who maintains the practice, who bears the cost if a harvest disappoints, and how long the buyer expects to purchase from participating suppliers. Where smallholders participate, budget cash flow and technical support for practices that offer a later return.
Put these terms in a supplier agreement or pilot addendum. It should cover eligible farms and volumes, consent to data collection, access for monitoring, any land or carbon rights that matter, benefit sharing, and what happens if the purchasing relationship ends. Ask local counsel and producer representatives to review the arrangement. The Accountability Framework is a useful reference for supply-chain work involving forests, ecosystems, and human rights.[3]
Avoid assigning an automatic carbon benefit to the buyer. The contract should say which party has the right to report each outcome, how overlapping claims will be checked, and how any issued credits will be handled. A reduction reported in a buyer’s inventory cannot simply be sold for someone else’s offset claim without an accounting review. SBTi FLAG guidance excludes purchased credits used as offsets from near-term FLAG target achievement.[2]
Set commercial measures beside environmental ones: delivered volume, rejection rate, supplier retention, and procurement cost. They tell you whether the program works as a supply-chain investment, even if carbon accounting takes longer to resolve.
Step 4: Build monitoring, reporting, and verification before rollout
Agree on the baseline and data flow before paying for a full rollout. Identify the land units or sourcing regions in scope, the practices that change, the records suppliers already keep, and the additional measurements the program requires. Decide which data can come from field visits, transaction records, or remote sensing, and who checks each source.
For carbon, separate three questions. Did the practice happen? Did emissions or removals change under an applicable method? Can the buyer attribute a defensible share to its purchased goods without double counting? The GHG Protocol’s 2026 guidance includes dedicated chapters on spatial boundaries, data and methods, evaluating actions, credited outcomes, and assurance.[1] These are distinct jobs. A photograph of a planted tree answers only part of the first.
CCC’s MRV and Additionality article explains the separate evidence questions a project reviewer will ask.
Create an evidence file for every reporting period: dated supplier and farm records, purchase volumes, methods and emission factors, uncertainty, quality checks, and changes from the baseline. Specify who can challenge the data and how corrections are recorded. If a project also seeks credit certification, keep project accounting and corporate inventory accounting separate. The GHG Protocol says its land standard focuses on entity-level inventories and does not set the rules for credit certification.[4]
Start with the minimum viable measurement design that can survive review. Add complexity when the pilot tells you which data actually changes a decision.
Step 5: Decide what can be reported and claimed
Insetting program design needs reporting rules before the marketing copy. Procurement, sustainability, finance, and legal should agree on four distinct outputs: operational performance; observed land or nature outcomes; inventory effects, if the accounting criteria are met; and any separately issued credits. One dashboard can display them, but they should not share a single unqualified headline.
SBTi FLAG guidance allows certain land-based removals within a company’s operations or supply chain to contribute to FLAG pathways, subject to criteria including permanence, traceability, data quality, and allocation. It does not allow purchased offsets to meet near-term FLAG targets.[2] Eligibility therefore depends on evidence and the applicable target rules, not on calling an activity “insetting.”
Draft a claims register. For each proposed sentence, record the period, boundary, data owner, calculation method, reviewer, and whether the result is measured, estimated, or still a goal. If the evidence supports only “we funded a pilot with 200 farms,” say that. Do not turn a funding fact into a verified emissions reduction.
What good looks like by year three
Treat year three as a review point, not a promised payback date. A mature pilot should have mapped participating supply volumes, a stable supplier agreement, a repeatable data collection process, and a comparison of commercial and environmental results against the baseline. It should also have a documented answer for outcomes that cannot be included in the buyer’s inventory.
Scale only where the pilot improves a sourcing decision and the evidence can follow the product. If neither condition holds, redesign the intervention or change the corridor. A disciplined program can conclude that a site is unsuitable. That is useful procurement intelligence.
Discuss your insetting program with CCC
Carbon Credit Capital designs nature-based supply chain investments around sourcing needs and measurable sustainability outcomes. Schedule a consultation with our carbon and sustainability experts to map your tier-one supplier network, FLAG exposure, and first pilot decision.
Sources
[1] GHG Protocol, Land Sector and Removals Standard, version 1.1, and companion Guidance, June 2026: https://ghgprotocol.org/land-sector-and-removals-standard ; https://ghgprotocol.org/land-sector-and-removals-guidance
[2] Science Based Targets initiative, Forest, Land and Agriculture Science-Based Target-Setting Guidance, version 1.2, March 2026, especially pp. 16–17, 37, and 41: https://sciencebasedtargets.org/resources/files/SBTiFLAGGuidance.pdf
[3] Accountability Framework initiative, Accountability Framework and guidance for companies: https://accountability-framework.org/
[4] GHG Protocol, Frequently Asked Questions: Land Sector and Removals Standard, questions 10 and 18: https://ghgprotocol.org/blog/frequently-asked-questions-land-sector-and-removals-lsr-standard

‘COP-out’: COP31 fails to deliver the ambition needed to phase out fossil fuels and address climate breakdown
COP31 Bulletin Day 13: New draft retains electrification goal but delays adaptation finance and science decisions

How “Marie Antoinnete” Can We Get?

-
Climate Change1 year ago
Guest post: Why China is still building new coal – and when it might stop
-
Greenhouse Gases1 year ago
Guest post: Why China is still building new coal – and when it might stop
-

 Renewable Energy1 year ago
Sending Progressive Philanthropist George Soros to Prison?
-
Greenhouse Gases1 year ago
嘉宾来稿:探究火山喷发如何影响气候预测
-

 Climate Change2 years ago
Analysis: China’s CO2 falls 1% in Q2 2024 in first quarterly drop since Covid-19
-

 Climate Change1 year ago
嘉宾来稿:探究火山喷发如何影响气候预测
-

