

The talks around climate change and energy transition bring both optimism and concern in 2025. On the positive side, the push for a net-zero carbon future creates significant opportunities for investment.
On the flip side, the physical impacts of rising global temperatures and climate change pose increasing financial risks. S&P Global focuses on measuring these risks and opportunities, suggesting a $53 trillion energy investment requirement.
Meanwhile, other analysis like that from McKinsey also explores the investment opportunities needed to transition to a green economy, indicating a $9.2 trillion annual funding for it. Let’s unlock what’s behind these numbers and why addressing them is essential to achieving net zero.
Net Zero Investments: A $53 Trillion Opportunity Awaits
Investing in low-carbon energy aims to reduce greenhouse gas (GHG) emissions and curb the long-term effects of climate change. According to S&P Global Commodity Insights, achieving net-zero emissions by 2050 could open up $53 trillion in global energy investment opportunities. This includes investments in clean energy technologies, power generation, and transmission infrastructure.
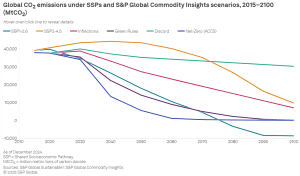
In contrast, if companies stick to a business-as-usual scenario with moderate emission cuts (SSP2-4.5 trajectory), investments in these areas will total about $37 trillion by 2050.
- SSP2-4.5 (Medium Emissions): A moderate approach where emissions stabilize and warming reaches 2.7°C by 2100.
The $53 trillion estimate is likely conservative, as it excludes spending on electric vehicles, charging networks, energy-efficient buildings, and other non-energy sectors.
The fossil fuel industry, however, faces a sharp decline in investment opportunities. Spending on oil, gas, coal, and thermal power will drop from $800 billion in 2024 to less than $600 billion by 2050 under the base case. In a net-zero scenario, this figure falls even further, to below $200 billion.
- Net-Zero Scenario: A backcast model where fossil fuel use nearly disappears, and clean energy dominates. This scenario limits warming to 1.5°C by 2100.
Most of the investment in clean energy will occur in non-OECD Asia-Pacific regions (excluding Australia, Japan, New Zealand, and South Korea). These areas will require $25 trillion by 2050 under a net-zero scenario, compared to $17 trillion under the base case. North America and Europe could also be key regions for clean energy investment.
- Base Case: A probable future where global emissions drop by 25% by 2050, but fossil fuels remain significant. This scenario aligns with the SSP2-4.5 pathway and projects 2.4°C warming by 2100.
RELATED: Constellation and Calpine’s $16.4B Deal Boosts U.S. Clean Energy Transition
Investing Big: Why Net Zero Needs $9.2 Trillion Annually
In a separate analysis by McKinsey, achieving net-zero emissions by 2050 requires $9.2 trillion annually on physical assets (capital expenditures or capex)—$3.5 trillion more than current spending. This increase equals half of global corporate profits and a quarter of 2020’s total tax revenue.
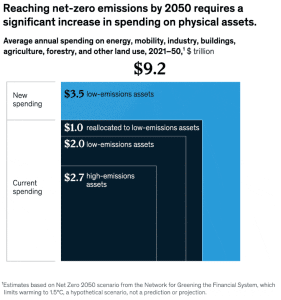
- The $3.5 trillion annual spending for energy and land-use systems represents a 60% rise from current levels. By 2050, that amount will total around $275 trillion.
The figure includes a shift from fossil fuels to renewable energy sources and a move towards zero-emission vehicles.
With expected economic growth and current transition policies, the additional spending may drop to $1 trillion annually. However, the next decade is crucial, with spending front-loaded and impacts varying across regions and industries.
The low-carbon transition requires immediate and substantial upfront investments, with capital spending peaking around 2026-2030 at about 9% of global GDP before declining, per McKinsey analysis. Early action is crucial to mitigate long-term risks and costs associated with delayed efforts.
The Financial Toll of Climate Risks
While clean energy investments offer financial opportunities, the physical impacts of climate change also come with significant costs. S&P Global Sustainable1 estimates that the world’s largest companies (in the S&P Global 1200 index) could face $25 trillion in cumulative costs by 2050. This figure includes:
- $4.5 trillion in lost revenue from business interruptions.
- $3.8 trillion in higher operating costs.
- $16.5 trillion in property damages and extra capital expenses.
These costs are tied to climate hazards like extreme heat, water stress, droughts, and flooding. Extreme heat alone accounts for 58% of the projected costs, while water stress and drought contribute 21% and 11%, respectively.
Sector-Specific Impacts
Utilities, energy, financial services, and communication companies will bear the largest financial burdens due to climate risks. These sectors are particularly vulnerable to extreme heat, water shortages, and droughts.
It’s worth noting that these costs are based on companies in the S&P Global 1200 index, which includes about 1,200 large firms from regions like North America, Europe, Asia, and Latin America. Together, these companies own nearly 3.5 million physical assets.
- The estimated $25 trillion in costs by 2050 represents 74% of total revenue and 31% of the total market value of these companies in 2024.
The Long-Term Benefits of Achieving Net-Zero Goals
Investing in low-carbon technologies and renewable energy can significantly reduce the physical impacts of climate change. For example, while achieving net-zero emissions by 2050 won’t drastically lower climate costs for S&P Global 1200 companies by mid-century, it could save them $15 trillion in cumulative costs by 2099 compared to a business-as-usual scenario.
Expanding these savings to the global economy shows an even greater benefit. Reducing emissions and transitioning to renewable energy can help avoid the worst climate impacts and minimize future costs.
Furthermore, the World Economic Forum noted that the investment goals, though represent a significant increase, are not impossible to achieve. According to WEF, McKinsey’s estimate of $9.2 trillion in annual capex highlights the challenge.
According to the IEA, the global economy invests $1.4 trillion annually in clean energy and related infrastructure. With existing policies, this figure could rise by $2.5 trillion, leaving an annual investment gap of $5.3 trillion.

Redirecting $3.7 trillion from brown infrastructure—such as high-emission oil, gas, cement, and steel industries—to green energy projects could substantially close this gap. The remaining $1.6 trillion needed would represent just 2% of global GDP annually.
While ambitious, this transition is achievable with strategic shifts in financial priorities, paving the way for a sustainable and low-carbon global economy. By acting swiftly, the world can reduce future climate risks and unlock the vast potential of a net-zero energy future.
- READ MORE: Trump’s Tariffs and Climate Rollbacks: How 2025 is Shaking Copper Markets and Clean Energy Goals
The post What’s Behind the $53 Trillion Energy Investment Needed for Net Zero? appeared first on Carbon Credits.
Carbon Footprint
China Cuts Battery Export Rebates, Sending Lithium Prices Up and Boosting NILI’s Role in Global Lithium Supply
Disseminated on behalf of Surge Battery Metals Inc.
Global lithium markets are reacting to a major policy change in China. Beijing announced it will phase out VAT export rebates on battery products. The move caused a surge in lithium-related material prices and caught the attention of producers, buyers, and investors worldwide.
This change is more than a short-term lithium price spike. It may shift global lithium supply chains. Companies that relied heavily on Chinese exports now need to think about alternative sources. Non-Chinese producers, especially in stable countries, could gain a competitive advantage.
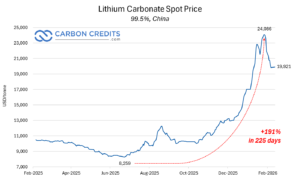
China’s rebate rollback affects how battery makers plan production and exports. Some companies may sell more lithium at home or adjust prices for overseas shipments. This policy highlights that government rules can shape the lithium market just as much as supply and demand.
Global Supply Chains Feel the Shock
China has long been the leader in battery-grade lithium production and battery manufacturing. Export rebates made Chinese batteries and lithium products cheaper for global buyers. Removing these rebates changes the economics for Chinese companies.
One short-term effect may be less lithium available for export. Companies could focus on domestic sales or reduce shipments abroad due to higher costs. Buyers in other regions may need to seek new suppliers or invest in local production.
This shows that geopolitics and policy now influence lithium markets heavily. Global buyers are increasingly aware of supply risks caused by policy changes. As a result, companies with high-quality lithium projects in politically stable countries are likely to become more important.
NILI: A Stable Bet in Uncertain Times
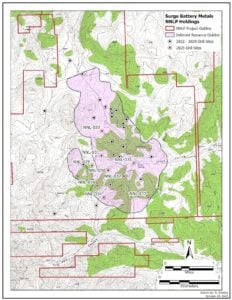
Surge Battery Metals (TSX-V: NILI | OTCQX: NILIF) is in a strong position to benefit from these changes. Its flagship project, the Nevada North Lithium Project (NNLP), is located in a mining-friendly U.S. region. The project has access to roads, power, skilled labor, and regulatory clarity, which reduce risks for development.
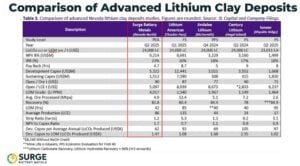
Unlike areas where policies can change quickly, Surge Battery Metals offers a stable, high-quality lithium source. Early exploration at Nevada North shows lithium clay grades of up to 8,070 ppm, considered high for clay-based deposits.
More notably, ongoing metallurgical tests show the project could operate at competitive costs and deliver strong financial returns. This makes NILI ready to meet the growing demand from electric vehicles (EVs), grid storage, and other industrial applications.
China’s export policy change increases the strategic importance of projects like Nevada North. Buyers who want a secure supply of lithium may turn to projects in stable regions. Surge Battery Metals is well-positioned to fill that role.
Strategic Advantages Beyond Location
Surge is also building a strong team to advance the project. Recent executive hires bring experience from the battery supply chain, including sourcing lithium for automakers. This expertise helps NILI form strong partnerships and prepare for commercial production.
With China cutting export rebates, some buyers may face higher costs or delays. NILI’s Nevada project can provide a reliable alternative. This is especially important for North American battery makers and EV companies that want supply security close to home.
The project’s economic potential is strong. Preliminary assessments indicate Nevada North could produce tens of thousands of tonnes of lithium carbonate equivalent (LCE) per year, 86,300.
The project is now moving toward a Pre-Feasibility Study targeted for completion in late 2026, with engineering led by global firm Fluor Corporation.
The project also benefits from favorable operating costs, US$5,243/t LCE, and the potential to expand its resource base through continued drilling. Surge recently strengthened this position with new drill results from Nevada North.
The company reported a 30.6-meter intercept grading 4,196 ppm lithium from surface in a 640-meter step-out hole to the southeast. This wide step-out confirms that strong lithium grades extend beyond the current resource boundary.
In infill drilling, Surge also reported 116 meters averaging 3,752 ppm lithium, including 32.1 meters grading 4,521 ppm near surface. This confirms the presence of a strong, high-grade core within the deposit.
These results highlight the scale and growth potential of the project. These factors make NILI a strategically important player in the global lithium market.
Key advantages that position Surge Battery Metals strategically in the market today:
- NILI’s 100% owned NNLP: 20,000+ acres prime Nevada clay – grades rival brine peers.
- Recent Wins: Oct 2025 BLM plan filed; Q1 2026 drilling planned.
- Investor Edge: TSX-V NILI up 25% post-China news – early positioning pays.
SEE MORE: Lithium Prices Climb Again in 2026, Sending Stocks Upward
The Bigger Picture: Supply Chain Security Matters
The lithium market is changing. In the past, supply and demand drove prices and investment decisions. Today, policy, geopolitics, and supply chain security are just as important. China’s export rebate rollback shows how quickly government decisions can affect global markets.
Companies with projects in stable, well-regulated regions are becoming more valuable. Investors and battery makers are looking for high-quality lithium resources that can provide a consistent supply without the risk of sudden policy changes. NILI’s Nevada North project fits this need.
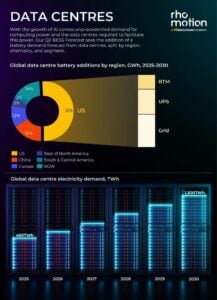
The market is also paying more attention to long-term demand trends. Beyond EVs, lithium is needed for industrial storage systems, AI data centers, and grid-scale energy storage.
Benchmark’s insights show that data centre electricity demand will rise sharply. Battery energy storage systems (BESS) will be crucial for ensuring power reliability as data centre capacity expands. The growing need for BESS will boost long-term demand for lithium storage. This reinforces lithium projects like NILI’s Nevada North, which can help meet future energy storage needs for expanding data centers.
Long-Term Implications for Investors and Industry
The Nevada North Lithium Project offers high-grade lithium in a politically stable region, with strong infrastructure and skilled labor. The company is positioning itself to meet rising demand from both EVs and other battery markets.
The policy shift in China highlights this strategic importance. With reduced incentives for Chinese exports, buyers are looking for alternative sources. NILI provides a safe, reliable, and high-quality supply, making it a strong partner for battery manufacturers in North America and beyond.
The company’s focus on commercial readiness further strengthens its position. Experienced executives and industry veterans are helping NILI form partnerships and prepare for eventual production. This approach ensures that Nevada North is not just a resource but a fully integrated solution for the lithium supply chain.
NILI in the New Supply Chain Era
For investors, projects like NILI offer exposure to high-grade resources in stable jurisdictions. For battery manufacturers, Nevada North represents a secure supply chain option that can reduce dependence on any single country or region.
China’s policy change is a reminder that supply chain risk matters in the lithium market. Investors, manufacturers, and policymakers are increasingly focused on reliable and diversified sources of lithium.
For anyone looking for safe, high-quality lithium, Surge Battery Metals is a company to consider. As global supply chains adjust to policy changes, the lithium junior is well-positioned to take advantage of new opportunities and strengthen its role in the lithium market.
Live Lithium Spot Price
DISCLAIMER
New Era Publishing Inc. and/or CarbonCredits.com (“We” or “Us”) are not securities dealers or brokers, investment advisers, or financial advisers, and you should not rely on the information herein as investment advice. Surge Battery Metals Inc. (“Company”) made a one-time payment of $75,000 to provide marketing services for a term of three months. None of the owners, members, directors, or employees of New Era Publishing Inc. and/or CarbonCredits.com currently hold, or have any beneficial ownership in, any shares, stocks, or options of the companies mentioned.
This article is informational only and is solely for use by prospective investors in determining whether to seek additional information. It does not constitute an offer to sell or a solicitation of an offer to buy any securities. Examples that we provide of share price increases pertaining to a particular issuer from one referenced date to another represent arbitrarily chosen time periods and are no indication whatsoever of future stock prices for that issuer and are of no predictive value.
Our stock profiles are intended to highlight certain companies for your further investigation; they are not stock recommendations or an offer or sale of the referenced securities. The securities issued by the companies we profile should be considered high-risk; if you do invest despite these warnings, you may lose your entire investment. Please do your own research before investing, including reviewing the companies’ SEDAR+ and SEC filings, press releases, and risk disclosures.
It is our policy that information contained in this profile was provided by the company, extracted from SEDAR+ and SEC filings, company websites, and other publicly available sources. We believe the sources and information are accurate and reliable but we cannot guarantee them.
CAUTIONARY STATEMENT AND FORWARD-LOOKING INFORMATION
Certain statements contained in this news release may constitute “forward-looking information” within the meaning of applicable securities laws. Forward-looking information generally can be identified by words such as “anticipate,” “expect,” “estimate,” “forecast,” “plan,” and similar expressions suggesting future outcomes or events. Forward-looking information is based on current expectations of management; however, it is subject to known and unknown risks, uncertainties, and other factors that may cause actual results to differ materially from those anticipated.
These factors include, without limitation, statements relating to the Company’s exploration and development plans, the potential of its mineral projects, financing activities, regulatory approvals, market conditions, and future objectives. Forward-looking information involves numerous risks and uncertainties and actual results might differ materially from results suggested in any forward-looking information. These risks and uncertainties include, among other things, market volatility, the state of financial markets for the Company’s securities, fluctuations in commodity prices, operational challenges, and changes in business plans.
Forward-looking information is based on several key expectations and assumptions, including, without limitation, that the Company will continue with its stated business objectives and will be able to raise additional capital as required. Although management of the Company has attempted to identify important factors that could cause actual results to differ materially, there may be other factors that cause results not to be as anticipated, estimated, or intended.
There can be no assurance that such forward-looking information will prove to be accurate, as actual results and future events could differ materially. Accordingly, readers should not place undue reliance on forward-looking information. Additional information about risks and uncertainties is contained in the Company’s management’s discussion and analysis and annual information form for the year ended December 31, 2025, copies of which are available on SEDAR+ at www.sedarplus.ca.
The forward-looking information contained herein is expressly qualified in its entirety by this cautionary statement. Forward-looking information reflects management’s current beliefs and is based on information currently available to the Company. The forward-looking information is made as of the date of this news release, and the Company assumes no obligation to update or revise such information to reflect new events or circumstances except as may be required by applicable law.
The post China Cuts Battery Export Rebates, Sending Lithium Prices Up and Boosting NILI’s Role in Global Lithium Supply appeared first on Carbon Credits.
Carbon Footprint
Fervo Energy’s $421M Breakthrough and The Rise of Geothermal Power for Clean Electricity

A major new investment is bringing geothermal energy back into focus. Fervo Energy has secured $421 million to build and expand its Cape Station geothermal project in Utah. The deal marks one of the largest recent financings in the U.S. geothermal sector.
This move comes at a time when energy systems are changing fast. Demand for reliable, carbon-free power is rising. Solar and wind are growing quickly, but they depend on the weather. Geothermal offers a different advantage. It provides steady electricity, day and night.
Fervo’s project shows how this technology is starting to scale. It also highlights a broader shift in clean energy markets. David Ulrey, Chief Financial Officer at Fervo Energy, said:
“Non-recourse financing has historically been considered out of reach for first-of-a-kind projects. Cape Station disrupts that narrative. With proven oil and gas technology paired with AI-enabled drilling and exploration, robust commercial offtake, operational consistency, and an unrelenting focus on health and safety, we have shown that EGS [enhanced geothermal systems] is a highly bankable asset class.”
A Major Investment in Next-Generation Geothermal
Fervo’s $421 million financing includes a mix of debt and credit support. The package is designed to fund the construction and early operations of the Cape Station project.
RBC Capital Markets is the coordinating lead arranger, working with Barclays, BBVA, and HSBC, with additional support from J.P. Morgan, Bank of America, and Sumitomo Mitsui Trust Bank’s New York branch.
Sean Pollock, Managing Director at RBC Capital Markets, remarked:
“As demand for firm, clean, affordable power accelerates, EGS is set to become a core energy asset class for infrastructure lenders. Fervo is pioneering this step change with Cape Station, a vital contribution to American energy security that RBC is proud to support.”
The project is located in Utah and is expected to become one of the largest EGS in the United States. Its initial phases could reach hundreds of megawatts of capacity, with long-term plans to scale up to 2 gigawatts (GW).
Conventional and EGS in the U.S.
This is a significant size. A 1 GW power plant can supply electricity to hundreds of thousands of homes, depending on usage levels. At full build-out, Cape Station could rank among the largest clean energy facilities in the country.
Fervo’s approach uses advanced drilling methods adapted from the oil and gas sector. These techniques allow developers to access deep heat resources that were once too difficult to reach. This expands the potential for geothermal energy beyond traditional locations.
From Niche to Necessary: Geothermal’s Small Share but Large Potential
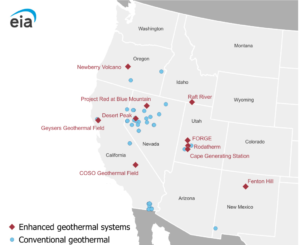
The United States currently has about 2.7 gigawatts (GW) of conventional geothermal capacity, per the US Energy Information Administration. This is only 0.2% of total U.S. summer generating capacity, which refers to the maximum power available during peak demand in summer.
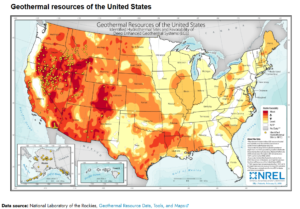
The potential for EGS is much larger. The U.S. Geological Survey estimates that 135 GW of power could be developed from EGS in the Great Basin alone.
Other estimates suggest that up to 150 GW of cost-effective geothermal capacity could be built in the coming decades, depending on market conditions and technological progress.
- In 2023, the National Laboratory of the Rockies estimated that about 90 GW of EGS capacity could be economically developed across the United States by 2050.
The small share reflects past limitations. Traditional geothermal projects require natural underground reservoirs of hot water or steam. These are only found in certain regions.
Technology Is Unlocking New Geothermal Resources
However, new technologies are changing that. Enhanced geothermal systems can create artificial reservoirs by injecting water into hot rock formations. This makes geothermal viable in many more areas.
The key to geothermal growth lies in innovation. Traditional geothermal systems are limited by geography. Enhanced systems aim to remove that constraint.
Fervo uses horizontal drilling and hydraulic stimulation. These methods are similar to those used in shale oil and gas production. They allow wells to reach deeper and hotter rock formations.
The company has already tested this approach. Its pilot project, known as Project Red, produced about 3.5 megawatts (MW) of continuous electricity. It also showed strong flow rates, which are critical for long-term performance.
Scaling up from pilot to commercial size is the next step. Cape Station represents that transition. If successful, it could prove that enhanced geothermal systems can operate on a large scale. This would open the door for wider adoption across the United States and other countries.
Why 24/7 Clean Energy Is in High Demand
Electricity demand is rising across the United States and globally. This is driven by electrification, population growth, and new industries.
At the same time, the energy system is shifting toward renewables. Solar and wind are now among the fastest-growing sources of electricity. However, these sources are variable. Solar only produces power during the day. Wind output can change with weather conditions.
This creates a need for stable energy sources that can run at all times. Geothermal meets this need. It provides baseload power, meaning it can operate continuously without interruption.
Other low-carbon baseload options include nuclear and hydropower. Geothermal adds another layer to this group, especially in regions where other options are limited.
As renewable energy expands, the value of steady power is increasing. This trend is driving interest in geothermal projects.
Investment Trends Support Geothermal Growth
Fervo’s funding reflects a broader shift in energy investment. Clean energy technologies are attracting increasing amounts of capital.
The company has raised about $1.5 billion in total funding since its founding in 2017. This includes equity investments and project-level financing.
Government policy is also playing a role. The U.S. Inflation Reduction Act provides tax credits and incentives for clean energy projects, including geothermal. These incentives help reduce project costs and improve returns for investors.
At the same time, utilities and large energy users are seeking long-term clean power contracts. This creates stable revenue streams for projects like Cape Station.
Global energy investment trends show continued growth in renewables, including geothermal. The International Energy Agency reports that clean energy investment is expected to exceed $2 trillion annually in the coming years, with solar leading but other technologies gaining support.
Geothermal is still a small part of this total today. However, its role could expand as the need for reliable clean energy increases, reaching nearly $3 trillion by 2050.
A New Role for Geothermal in the Energy Transition
Fervo’s $421 million project highlights a shift in how energy systems are evolving. The focus is no longer only on adding renewable capacity. It is also about building a stable and balanced grid.
Geothermal can help fill gaps left by solar and wind. It provides continuous, carbon-free electricity that supports grid reliability. This makes it useful for a range of applications, including:
- Powering cities and industrial operations.
- Supporting renewable-heavy grids.
- Reducing dependence on fossil fuel backup.
If enhanced geothermal systems continue to scale, they could become a key part of the clean energy mix. Fervo’s project is still in its early stages, but it represents a broader trend. Energy markets are starting to value not just clean power, but also consistent power.
As this shift continues, geothermal may move from a niche resource to a core component of the energy transition.
- READ MORE: Google Taps Earth’s Heat in 150MW Geothermal Deal with Ormat Technologies to Power Data Centers
The post Fervo Energy’s $421M Breakthrough and The Rise of Geothermal Power for Clean Electricity appeared first on Carbon Credits.
Carbon Footprint
Climate Impact Partners Unveils High-Quality Carbon Credits from Sabah Rainforest in Malaysia

The voluntary carbon market is changing. Buyers are no longer focused only on large volumes of cheap credits. Instead, they want projects with strong science, long-term monitoring, and clear proof that carbon has truly been removed from the atmosphere. That shift is drawing more attention to high-integrity, nature-based projects.
One project now gaining that spotlight is the Sabah INFAPRO rainforest rehabilitation project in Malaysia. Climate Impact Partners announced that the project is now issuing verified carbon removal credits, opening access to one of the highest-quality nature-based removals currently available in the global market.
Restoring One of the World’s Richest Rainforest Ecosystems
The project is located in Sabah, Malaysia, on the island of Borneo. This region is home to tropical dipterocarp rainforest, one of the richest forest ecosystems on Earth. These forests store huge amounts of carbon and support extraordinary biodiversity. Some dipterocarp trees can grow up to 70 meters tall, creating habitat for orangutans, pygmy elephants, gibbons, sun bears, and the critically endangered Sumatran rhino.
However, the forest within the INFAPRO project area was not intact. In the 1980s, selective logging removed many of the most valuable tree species, especially large dipterocarps. That caused serious ecological damage. Once the key mother trees were gone, natural regeneration became much harder. Young seedlings also had to compete with dense vines and shrubs, which slowed the forest’s recovery.
To repair that damage, the INFAPRO project was launched in the Ulu-Segama forestry management unit in eastern Sabah.
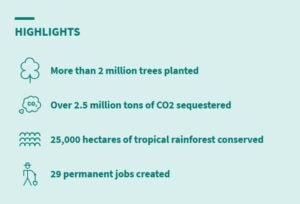
- The project has restored more than 25,000 hectares of logged-over rainforest.
- It was developed by Face the Future in cooperation with Yayasan Sabah, while Climate Impact Partners has supported the project and helped bring its credits to market.
Why Sabah’s Carbon Removals are Attracting Attention
What makes Sabah INFAPRO different is not only the size of the restoration effort. It is also the way the project measured carbon gains.
Many forest carbon projects issue credits in annual vintages based on year-by-year growth estimates. Sabah INFAPRO followed a different path. It used a landscape-scale monitoring system and waited until the forest moved through its strongest natural growth period before issuing removal credits.
- This approach gives the credits more weight. Rather than relying mainly on short-term annual estimates, the project measured carbon sequestration over a longer period. That helps show that the forest delivered real, sustained, and measurable carbon removal.
The scientific backing is also unusually strong. Since 2007, the project has maintained nearly 400 permanent monitoring plots. These plots have allowed researchers, independent auditors, and technical specialists to observe the full growth cycle of dipterocarp forest recovery. The result is a large body of field data that supports carbon calculations and strengthens confidence in the credits.
In simple terms, buyers are not just being asked to trust a model. They are being shown years of direct forest monitoring across the project landscape.
Strong Ratings Support Market Confidence
Independent assessment has also lifted the project’s profile. BeZero awarded Sabah INFAPRO an A.pre overall rating and an AA score for permanence. That places the project among the highest-rated Improved Forest Management, or IFM, projects in the world.
The rating reflects several important strengths. First, the project has very low exposure to reversal risk. Second, it has a long and stable operating history. Third, its measured carbon gains align well with peer-reviewed ecological research and independent analysis.
These points matter in today’s market. Buyers have become more cautious after years of debate over the quality of some forest carbon credits. As a result, they now look more closely at durability, transparency, and third-party validation. Sabah INFAPRO’s rating helps answer those concerns and makes the project more attractive to companies looking for credible carbon removal.
The project is also registered with Verra’s Verified Carbon Standard under the name INFAPRO Rehabilitation of Logged-over Dipterocarp Forest in Sabah, Malaysia. That adds another level of market recognition and verification.
A Wider Model for Rainforest Recovery
Sabah INFAPRO also shows why high-quality nature-based projects are about more than carbon alone. The restoration effort supports broader ecological recovery in one of the world’s most important rainforest regions.
Climate Impact Partners said it has worked with project partners to restore degraded areas, run local training programs, carry out monthly forest patrols, and distribute seedlings to support rainforest recovery beyond the project boundary. These efforts help strengthen the wider landscape and expand the project’s environmental impact.
That broader value is becoming more important for buyers. Companies increasingly want projects that support biodiversity, ecosystem health, and local engagement, along with carbon removal. Sabah INFAPRO offers that mix, making it a stronger fit for the market’s shift toward higher-integrity credits.
The post Climate Impact Partners Unveils High-Quality Carbon Credits from Sabah Rainforest in Malaysia appeared first on Carbon Credits.

Climate-Fueled Wildfires and Dust Storms Drove Up Air Pollution Around the World Last Year
Australia must not follow dystopian US-style data centre path of Big Tech overreach and emissions blow out

Disinformation: The Currency of the Trump Administration
-
Greenhouse Gases7 months ago
Guest post: Why China is still building new coal – and when it might stop
-
Climate Change7 months ago
Guest post: Why China is still building new coal – and when it might stop
-

 Greenhouse Gases2 years ago
嘉宾来稿:满足中国增长的用电需求 光伏加储能“比新建煤电更实惠”
-
Climate Change2 years ago
Bill Discounting Climate Change in Florida’s Energy Policy Awaits DeSantis’ Approval
-

 Climate Change2 years ago
嘉宾来稿:满足中国增长的用电需求 光伏加储能“比新建煤电更实惠”
-
Climate Change Videos2 years ago
The toxic gas flares fuelling Nigeria’s climate change – BBC News
-

 Carbon Footprint2 years ago
US SEC’s Climate Disclosure Rules Spur Renewed Interest in Carbon Credits
-

 Renewable Energy5 months ago
Sending Progressive Philanthropist George Soros to Prison?