
Climate change was responsible for just over one-third of the simultaneous soya bean crop failures across Argentina, Brazil and the US in 2012, according to a new attribution study.
The research, published in Communications Earth & Environment, analyses the impact of hot and dry extreme weather that hit the three countries in 2012.
Although soya beans are an important crop for global food supplies most often in the form of animal feed – their production is concentrated in just three countries, leaving them susceptible to weather-related disruption.
Using climate and crop models, the researchers determine what the yield of the crop would have been in a world without warming.
They find that the impact of climate change – through warmer temperatures and drier soils – accounted for 35% of the yield reduction in 2012.
Furthermore, they warn, the impacts of similar events will only become stronger as the world continues to warm.
One researcher, who was not involved in the study, tells Carbon Brief that the novel application of existing methods in the study is “new and noteworthy”.
Soya bean shock
Soya is one of the “big four” staple crops – along with maize, rice and wheat – that together comprise almost 65% of global calories consumed and 45% of the world’s planted farmlands.
In 2021, the world produced nearly 365m tonnes of soya beans. Less than 4% of this harvest fed humans directly, with the vast majority of it being processed into animal feed, vegetable oil or biofuel.
Just three countries – Argentina, Brazil and the US – grow nearly three-quarters of the world’s supply of soya beans, the study says. The concentration of production in these three countries “makes the global soybean supply vulnerable to regional production shocks” – and especially those due to extreme weather events, the authors write.
Such was the case in 2012, when hot and dry extremes across the Americas caused a 10% drop in global production. This production drop was accompanied by record-high price spikes.
The strength of the 2012 simultaneous failure was a primary reason for studying it, despite the fact that the event happened more than a decade in the past, says lead author Dr Raed Hamed, a climate scientist at Vrije Universiteit Amsterdam.
Another reason is that the selected soya-growing regions have well-understood links to El Nino-Southern Oscillation (ENSO), the large-scale climate pattern in the Pacific Ocean that influences global weather patterns and crop yields.
The low yield in 2012 came at the end of a three-year La Niña event. La Niña is the “cold phase” of ENSO, marked by cooler temperatures in the Pacific Ocean, but it is known to cause hotter- and drier-than-normal conditions in south-eastern South America and the US, respectively. According to the US National Oceanic and Atmospheric Administration, the 2012 La Niña was the third-warmest such event on record.
The charts below show the annual global production of soya as absolute totals (left) and relative to a baseline adjusted for the long-term production trend over 1980-2014 (right).

Soya storylines
In order to tease out the effects of climate change on the 2012 growing season, the researchers use a “storyline” approach.
Many attribution studies take a “probabalistic” approach, running climate models both with and without warming thousands of times to determine how climate change affected the duration, likelihood or intensity of an event.
By contrast, the storyline approach imposes a fixed atmospheric circulation – in this case, the 2012 La Niña event – on top of three different levels of warming: a pre-industrial world, the factual 2012 world and a world that has warmed by 2C. Hamed explains:
“So we remove the question of how likely it is, but we say: ‘Given a similar event in a warmer climate, what would the impact be like?’”
This approach was necessary, Hamed says, because “there is a big question mark” around how further warming will impact ENSO and, in particular, the atmospheric circulation.
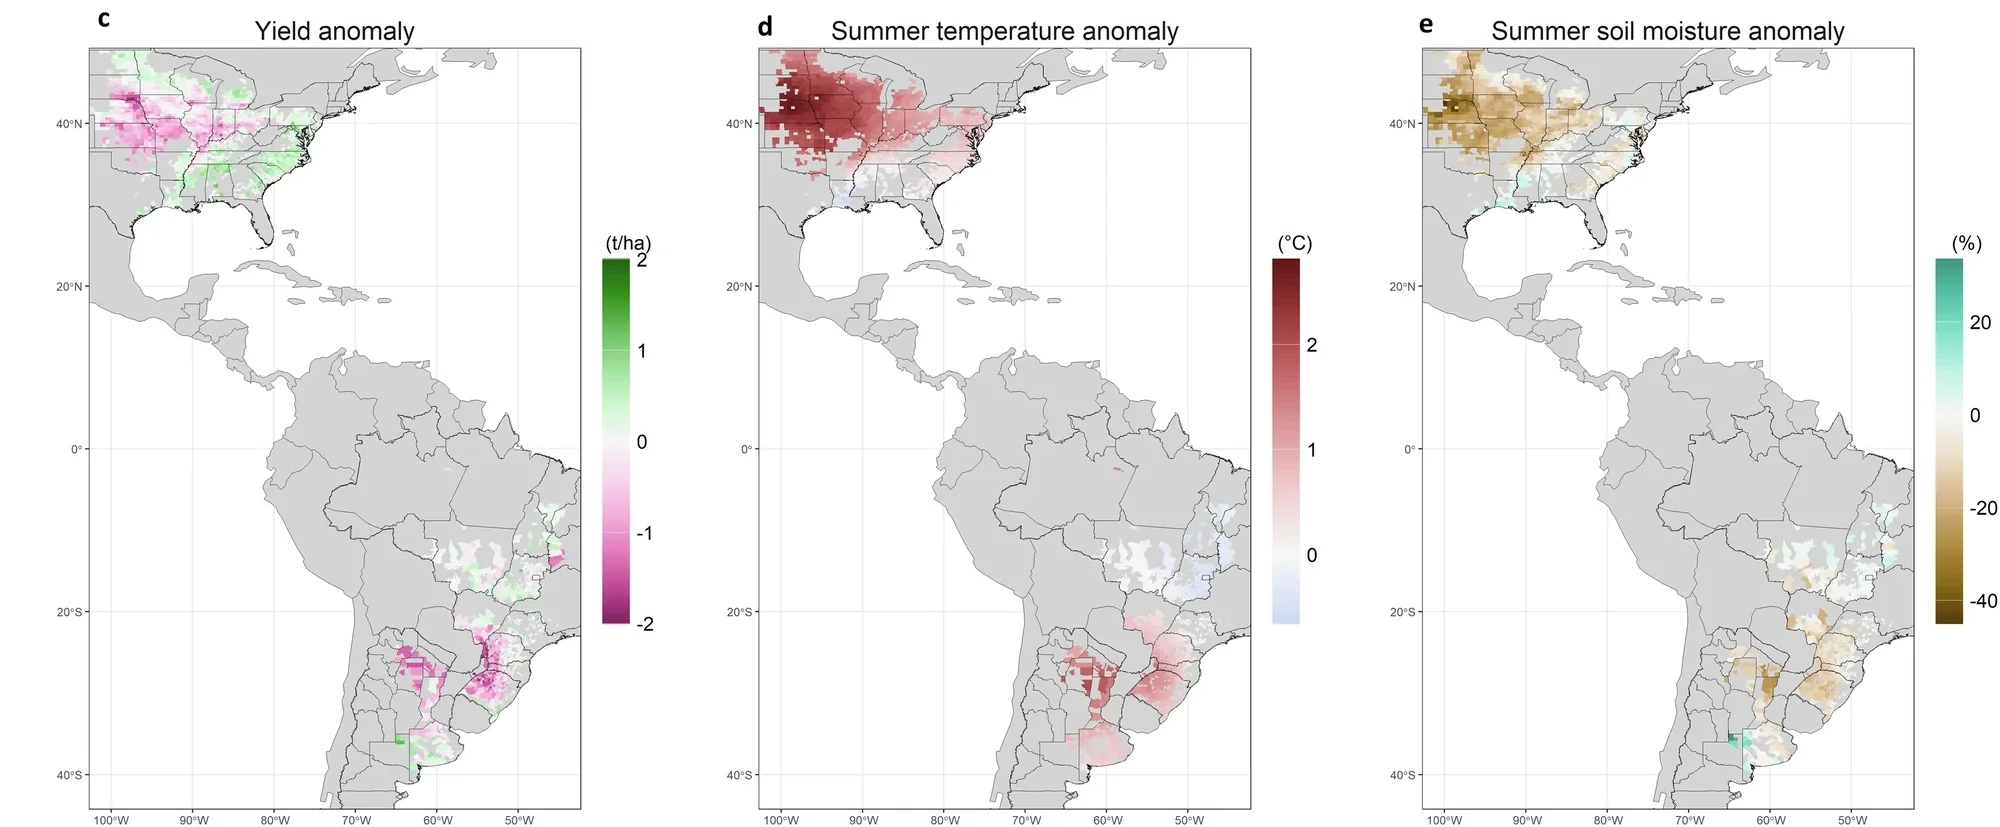
Then, the researchers use the temperature and soil moisture outputs from each warming scenario to calculate the soya bean yield in three major growing regions: the US, central Brazil and south-eastern South America, which encompasses parts of Brazil and Argentina. By comparing the actual yield changes in 2012 to those from the pre-industrial model runs, they quantify how much of the lower yield can be attributed to climate change.
They find that, overall, climate change – in the form of warmer temperatures and drier soils – was responsible for 35% of the “production deficit” during the 2012 failure.
However, the impact of the hot-and-dry event differed significantly between regions. In the US, warming caused a 3.5% decrease in production, compared to a world with no climate change, while in south-east South America, production fell by 222%. In central Brazil, climate change actually improved production by 14%.
While this type of approach is not necessarily “novel”, the “application is new and noteworthy”, says Dr Dáithí Stone, a climate scientist at New Zealand’s National Institute of Water and Atmospheric Research. Stone, who was not involved in the study, adds:
“Soya bean is one of the [main] staple crops on the planet and one that’s very much growing in demand. So it’s very important and there are susceptibilities. We do have these sensitivities, these risks, if we have production concentrated in these three areas.”
Future yields
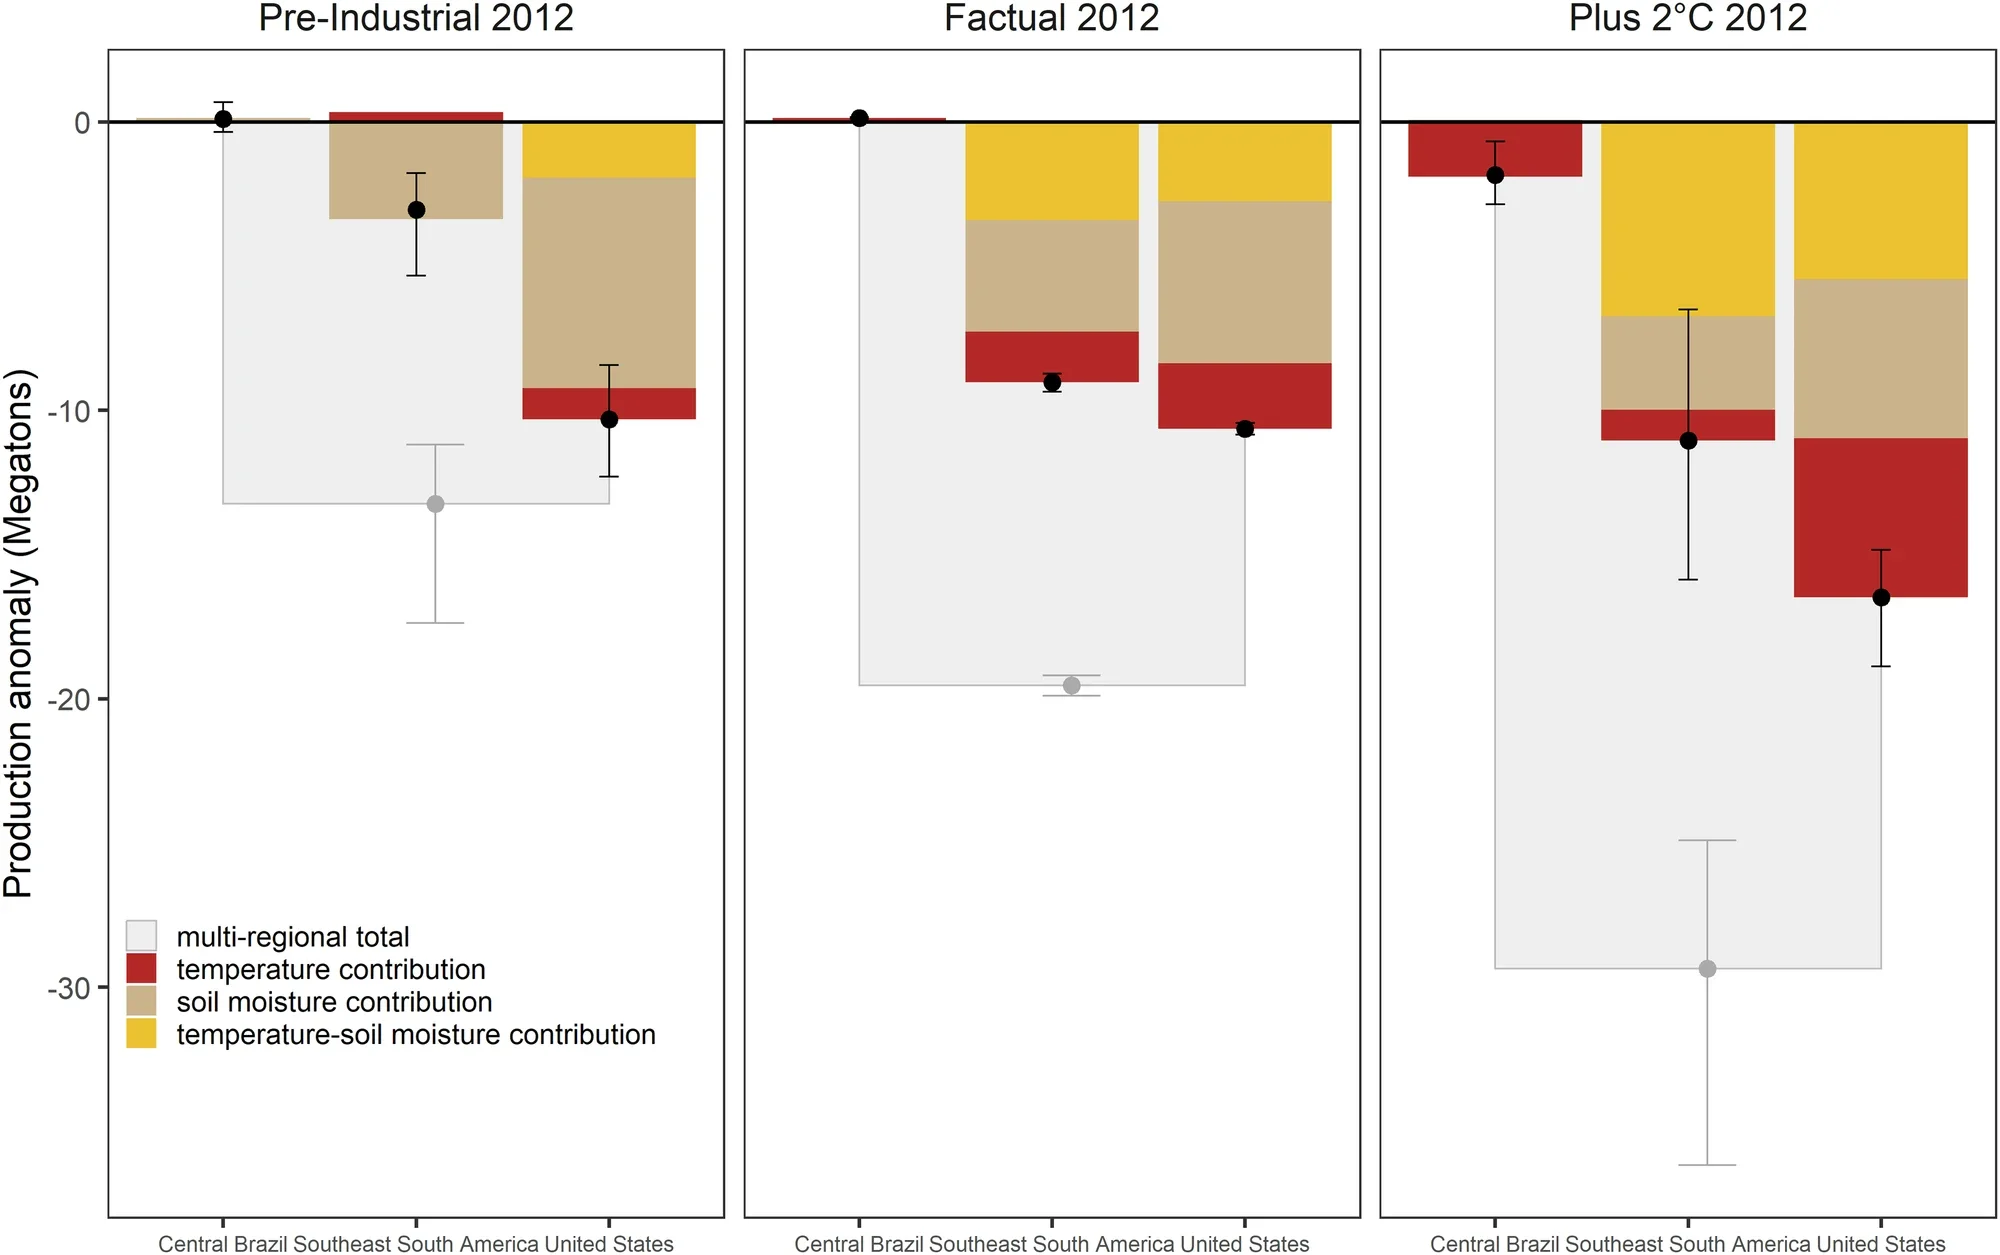
In addition to comparing the event to one in a pre-industrial climate, the researchers use the same approach to project the potential impacts of the same event occurring in a world with 2C of warming above pre-industrial temperatures.
While the effects of the 2012 event were mainly concentrated in the south-east South America region, the impacts are felt in each of the three regions. Furthermore, at higher temperatures, the impact of the interactions between temperature and soil moisture becomes more significant, particularly in the south-east South America region.
The chart below shows the soya bean production anomaly for each region under (left to right) the pre-industrial climate, the actual climate in which the event occurred and the climate with 2C of warming.
The “simple” setup of the analysis means there are many caveats to the study, Hamed says. For example, there is no consideration of adaptation, such as the possibility of farmers planting a larger area or implementing an irrigation system.
It also does not consider future improvements to technology and yields. (Global soya bean yield has been steadily climbing since the 1960s, although, Stone points out, “you can only increase the yield so much”.)
Stone tells Carbon Brief:
“These sorts of studies which look at the impacts of extreme weather in the context of climate change are very useful.
“The impacts of climate change tend to be in these extreme events. They’re the things that stress test us normally, so they’re stress testing us more. And so understanding these events and how their impacts cascade down the system as well…is becoming increasingly important as we enter a warmer world.”
The post ‘One-third’ of 2012 soya crop failure in the Americas was due to climate change appeared first on Carbon Brief.
‘One-third’ of 2012 soya crop failure in the Americas was due to climate change
Climate Change
After a Slow Start on Climate, Zohran Mamdani Faces Scrutiny Over Parks Budget and Environmental Promises
Climate-conscious New Yorkers hope the mayor hasn’t forgotten them.
During his New York City mayoral campaign, Zohran Mamdani courted votes from environmentalists. He promised to expand green spaces in public schools and equip them with renewable energy, to meet the demands of the city’s building electrification laws and to increase investments in city parks.
That would be American ratepayers—i.e., you.
From our collaborating partner Living on Earth, public radio’s environmental news magazine, an interview by Jenni Doering with Katharine Kollins, the president of Southeastern Wind Coalition.
Who Loses in the Trump Administration’s $1 Billion ‘Deal’ to Abandon Offshore Wind?
County officials have said they will eventually close the incinerator, located in a predominantly Black community. Advocates want a concrete plan.
Minneapolis activists are escalating a decades-long fight by going on a hunger strike to demand that local officials shut down a polluting trash incinerator.
Minneapolis Activists Launch Hunger Strike to Protest Polluting Trash Incinerator

After a Slow Start on Climate, Zohran Mamdani Faces Scrutiny Over Parks Budget and Environmental Promises
Who Loses in the Trump Administration’s $1 Billion ‘Deal’ to Abandon Offshore Wind?
Minneapolis Activists Launch Hunger Strike to Protest Polluting Trash Incinerator
-
Climate Change8 months ago
Guest post: Why China is still building new coal – and when it might stop
-
Greenhouse Gases8 months ago
Guest post: Why China is still building new coal – and when it might stop
-

 Greenhouse Gases2 years ago
嘉宾来稿:满足中国增长的用电需求 光伏加储能“比新建煤电更实惠”
-
Climate Change2 years ago
Bill Discounting Climate Change in Florida’s Energy Policy Awaits DeSantis’ Approval
-

 Climate Change2 years ago
嘉宾来稿:满足中国增长的用电需求 光伏加储能“比新建煤电更实惠”
-
Climate Change Videos2 years ago
The toxic gas flares fuelling Nigeria’s climate change – BBC News
-

 Renewable Energy6 months ago
Sending Progressive Philanthropist George Soros to Prison?
-

 Carbon Footprint2 years ago
US SEC’s Climate Disclosure Rules Spur Renewed Interest in Carbon Credits