

Google announced a major new project: it will support a U.S. power plant outfitted with carbon-capture and storage (CCS) technology. The plant, owned by Broadwing Energy in Decatur, Illinois, will capture about 90% of its CO₂ emissions. The tech giant agreed to buy most of the electricity the plant produces.
By backing this plant, Google aims to help build a reliable, low-carbon power source for its data centers in the U.S. Midwest. It also hopes to speed up the use of CCS technology globally.
The Science of Trapping Carbon: How CCS Works
CCS stands for carbon capture and storage. It involves three main steps:
- Capture: Pulling CO₂ from a power plant or factory.
- Transport: Moving the CO₂, often via pipelines.
- Store: Injecting the CO₂ deep underground where it can’t escape.
This technology is especially important for power plants that burn natural gas or coal. It is also key for factories in heavy industries, like steel and cement, which produce large emissions.
Global experts such as the International Energy Agency (IEA) and the Intergovernmental Panel on Climate Change (IPCC) say CCS will play a major role in reaching climate goals.
Google’s deal highlights this role. By linking a power plant deal to its own data center needs, the company is showing how big tech can strengthen the clean energy transition.
Inside Google’s Illinois CCS Project
The Illinois plant will be a natural 5gas power facility built by Broadwing Energy. It will capture up to 90% of the CO₂ it produces. Google will buy the bulk of its electricity output.
The plant is sized at more than 400 megawatts (MW). It will include advanced equipment and a large carbon-capture unit. The deal was announced by Google and infrastructure partner I Squared Capital (through its affiliate Low Carbon Infrastructure).
Google said the project will feed power to its data centers in the region, help reduce emissions, and make clean “firm power” (power available around the clock) more affordable. This is important because many renewable sources like wind and solar have variable output.
Google stated:
“Today we’re excited to announce a first-of-its-kind corporate agreement to support a gas power plant with CCS. Broadwing Energy, located in Decatur, Illinois, will capture and permanently store approximately 90% of its CO2 emissions. We hope it will accelerate the path for CCS technology to become more accessible and affordable globally, helping to increase generating capacity while enabling emission reductions.”
How Big is the CCS Market?
The CCS market has grown rapidly. One estimate values it at $8.6 billion in 2024, with a projected annual rate of 16% through 2034. At that pace, the market could reach $51.5 billion by 2034.
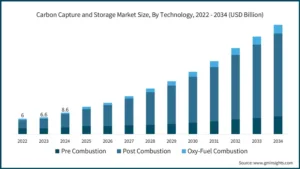
Another estimate places the market size in 2024 at $3.68 billion, with growth to $5.61 billion by 2030. The power generation sector is a major part of the market. One report says 37% of the market was from power generation in 2024.
For data centers and tech companies like Google, CCS offers reliable low-carbon power. Given that global data center emissions may reach 2.5 billion tons of CO₂ through 2030, major tech firms are under pressure to decarbonize.
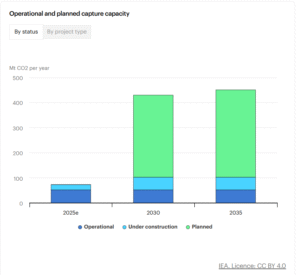
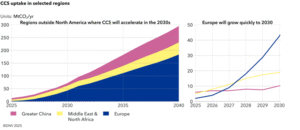
Experts also project that global CCS capacity will quadruple, reaching around 430 million tonnes of CO₂ per year from today’s 50 million tonnes. Investments of about $80 billion are expected over the next five years. North America and Europe currently lead, holding roughly 80% of growth projects, while China and other regions also scale up.
CCS currently addresses only 6% of the emissions needed for net-zero by mid-century. Experts still see it as key for hard-to-decarbonize industries like cement, steel, and hydrogen production.
Breaking New Ground in Clean Firm Power
This is the first time a major tech company has agreed to buy electricity from a power plant using CCS at this commercial scale in the U.S.
The deal brings several important benefits:
- Google secures “firm” power for its data centers, reducing risks from intermittent renewable supply.
- CCS gives a path to cut emissions from fossil fuel plants rather than shutting them down entirely.
- It creates a business model for future CCS deals, making the technology more accessible and scalable.
For Google, the deal advances its goal of running on clean energy and especially 24/7 carbon-free power by 2030. For the broader industry, it sends a signal that large corporations support CCS and are willing to back it financially.
Hurdles Ahead for Carbon Capture
Despite the promise, CCS still faces hurdles. The upfront cost is high, and many projects require government incentives or strong contracts to make economic sense.
Another challenge is scale. According to a 2024 study, CCS capacity by 2030 may reach only 0.07–0.37 gigatonnes (Gt) CO₂ per year, which is just a small part of what’s needed to meet climate goals.

For Google’s project and others like it to succeed, they will need strong regulation, clear carbon pricing, and reliable storage sites. Also, transparency and long-term monitoring are critical to ensure the CO₂ stays underground.
The Illinois plant is a start. If it runs successfully, it could spawn many more projects in power generation and industry. Corporations, utilities, and governments may replicate the model.
The Big Picture: From Data Centers to Decarbonization
Tech companies are building ever-larger data centers to fuel artificial intelligence, cloud computing, and global connectivity. This drives huge electricity demand. Google’s CCS deal shows one way to manage that demand while cutting carbon.
CCS combined with clean power can help sectors that cannot easily switch to renewables. Power plants that run on natural gas or industries like cement and steel may use CCS to reduce emissions.
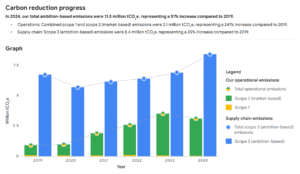
For Google, the new deal helps it reach its sustainability targets, supports its data-center operations, and sets an example for other firms. The chart below shows the company’s emission reduction progress. For the climate, it offers a template for building low-carbon power systems at scale.
Final Thoughts: A Pivotal Moment for Clean Power
Google’s agreement signals a shift: clean, firm power is becoming a business reality, not just a promise. By backing a CCS-enabled gas power plant, Google is aligning business needs with carbon reduction goals.
The global CCS market is expanding fast. Estimates show billions of dollars flowing into the technology. But scaling remains challenging — cost, policy, and geology all play a role.
If the Illinois plant succeeds, it may influence how corporations, utilities, and governments design power systems in the future. It could help unlock CCS as one of the tools in the broader energy transition toolbox.
The post Google Invests in First Carbon Capture to Power AI and Cut Emissions appeared first on Carbon Credits.

Google, Meta, and McKinsey & Company have made a major move in corporate climate action. They signed a long-term deal to remove carbon from the air in Appalachia. The project is run by Living Carbon and focuses on restoring forests on degraded lands. Under this deal, the companies will remove 131,240 tonnes of CO₂ over the next ten years.
A New Deal for Climate
The effort targets a much larger problem. Across the United States, about 1.6 million acres of abandoned mine land remain damaged by past mining. These lands often have poor soil, erosion, toxic metals, and invasive species that block natural regrowth.
In addition, around 30 million acres of degraded agricultural land could be restored through reforestation. Appalachia is one of the hardest-hit regions due to decades of coal mining.
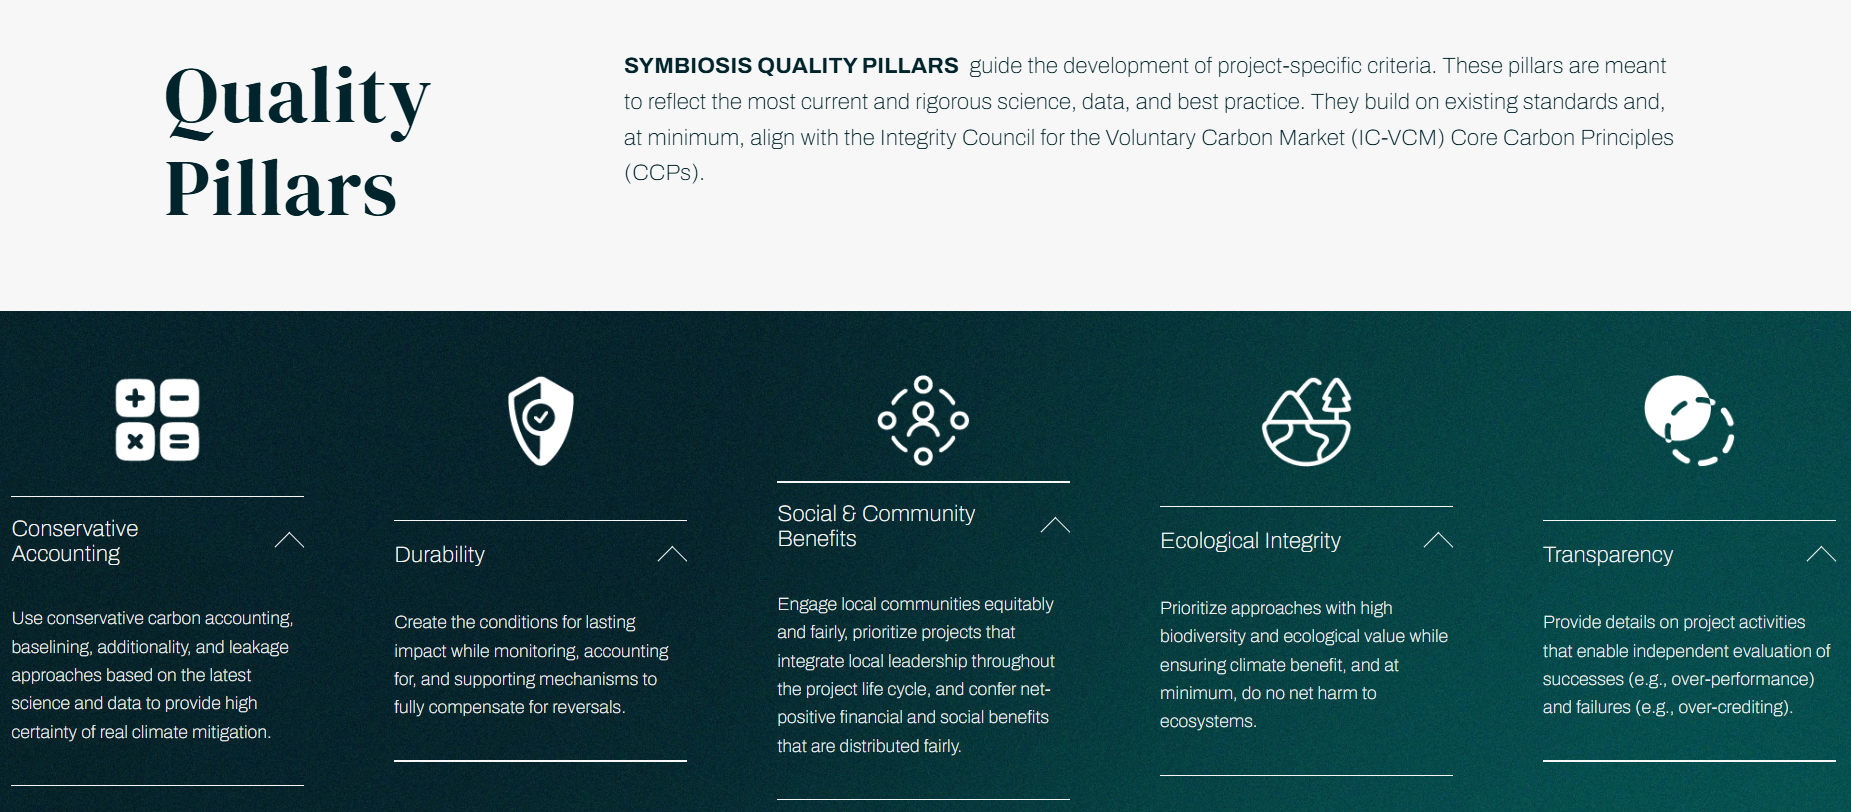
The deal is backed by the Symbiosis Coalition, a group of buyers that funds high-quality carbon removal projects. The coalition is an advance market commitment (AMC) launched in 2024 by Google, Meta, Microsoft, and Salesforce.
The group has pledged to contract up to 20 million tonnes of carbon removal credits by 2030. This commitment aims to create strong market demand and support the growth of high-impact, science-based restoration projects that can help advance global climate goals.
The agreements they have give developers a steady demand. They also help unlock financing and allow projects to scale.
Symbiosis selected the Appalachian project after a strict review process. It looked at data, field conditions, and long-term risks. The group follows key standards such as durability, transparency, ecological integrity, and community impact. This helps ensure that every credit represents real and measurable carbon removal.
Julia Strong, Executive Director of the Symbiosis Coalition, remarked:
“Our support of Living Carbon reflects our belief that effective nature-based carbon removal requires both strong science and solid execution. Their project stands out for its rigor and for its thoughtful and scalable approach shaped around the needs of local communities, ecosystems, and economies in Appalachia.”
Why Appalachia Matters: From Coal Hubs to Carbon Heroes
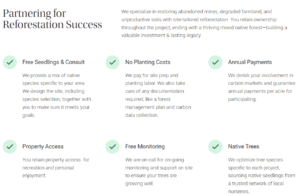
The Appalachia region, in the eastern United States, was once a center of coal mining. Today, many of these lands remain unused and degraded. Living Carbon is working to restore them by planting native hardwood and pine trees on former mine sites and damaged farmland.
The project uses a mix of careful site preparation, invasive species control, and strategic planting. This helps trees grow in areas where nature cannot easily recover on its own. The goal is not just to plant trees, but to rebuild entire ecosystems and support long-term carbon storage.
The benefits go beyond carbon removal. Restoring forests improves soil health, water quality, and biodiversity. Native trees help rebuild habitats for local plants and wildlife. These changes can also reduce erosion and improve land stability over time.
The project also creates real economic value. Landowners earn lease payments from land that was once unproductive. Local workers are hired for planting and land restoration.
-
In some cases, old mining equipment is reused to support ecological recovery. This helps turn former industrial sites into productive carbon sinks.
Community engagement is a key part of the project. Living Carbon works closely with landowners, local groups, and government agencies. This helps build long-term support and ensures the project fits local needs. Strong local partnerships also improve the chances that the forests will be maintained over time.
The project stands out for its strong science and clear execution plan. It uses careful monitoring and conservative estimates to ensure carbon removal is real. It also applies new methods for tracking results, including advanced baselines and lifecycle analysis.
This type of approach shows that high-quality nature-based carbon removal can deliver more than climate impact. It can restore ecosystems, support local economies, and scale across similar regions. In places like Appalachia, it offers a way to turn damaged land into a long-term climate solution.
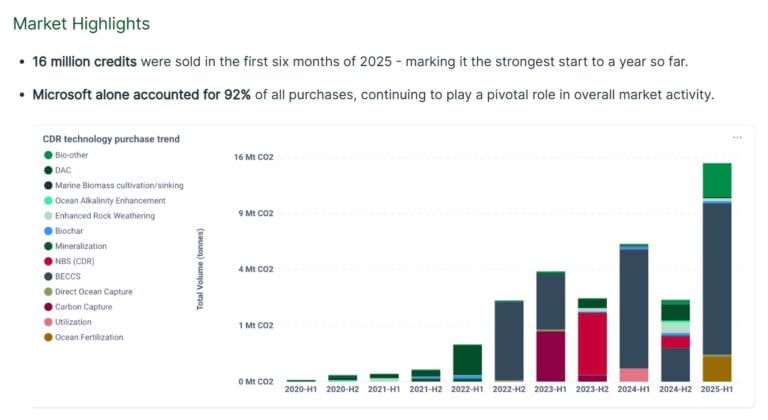
Big Business Bets on Carbon Credits
More corporations are now buying carbon removal credits to meet climate goals. For example, Microsoft bought 45 million tonnes of carbon removal in fiscal year 2025. This is nearly double the amount from 2024 and nine times what they bought in 2023.
These purchases are part of a broader climate strategy. Companies are combining emissions reductions with long-term removal commitments. Durable carbon removal credits, which permanently store CO₂, are becoming more important. Businesses feel pressure to deal with emissions that they cannot completely eliminate.
A major supporter of these deals is Frontier, launched in 2022 by Stripe, Alphabet (Google’s parent company), Meta, Shopify, and McKinsey Sustainability. Frontier wants to boost early demand and funding for promising carbon removal technologies.
The company does this through long-term purchase agreements. Its initial goal was $1 billion in purchases by 2030, sending a strong signal to the market about future demand.
By 2025, Frontier signed contracts for various technologies. These include bioenergy with carbon capture and storage (BECCS), direct air capture (DAC), and enhanced weathering. Several contracts are worth tens of millions of dollars. These agreements help developers survive the early “valley of death,” when financing is hardest to secure.
Market Trends: From Niche to Necessity
The carbon removal market is still small compared with global climate goals, but it is evolving quickly. Industry forecasts say that demand for durable carbon removal credits might hit 100 million tonnes of CO₂ each year by 2030.
This growth is fueled by corporate commitments and government purchases. This is roughly double the supply currently announced, showing a large gap between demand and delivery.
Globally, carbon removal is still a tiny fraction of what is needed. Scientific assessments show that to meet the Paris Agreement, carbon removal needs to increase. By 2050, it should reach 7–9 billion tonnes of CO₂ each year. This is about 4,000 times more than what we do now.

Market projections show strong growth in the next decade. A report by Oliver Wyman and the UK Carbon Markets Forum estimates that the global carbon removal market could grow from $2.7 billion in 2023 to $100 billion per year by 2030–2035, provided policies and standards evolve to support it.
Local and Global Wins
The Appalachia project highlights how carbon removal can benefit both the climate and communities. Restoring degraded lands improves water filtration, soil health, and wildlife habitats. Communities also gain jobs and income through forest management.
Nature-based projects, including reforestation and forest management, currently dominate removal activity. However, they do not offer the same permanence as engineered removals like BECCS or DAC, which store carbon for centuries or longer. Still, both approaches are necessary to scale the carbon removal market.
From Milestones to Market Momentum
The Google, Meta, and McKinsey deal is a milestone for corporate climate action. Long-term agreements help projects secure funding and expand. They also send strong signals to developers and investors. These deals can shift the market from short-term offsets to long-term, permanent carbon removal solutions.
The industry must grow significantly to meet global climate targets. Expanding beyond early adopter companies is essential. Continued policy support, strong standards, and wider sector participation will help scale removals.
In the next decade, how fast carbon removal technologies grow and the amount of credits produced will be key to achieving net-zero goals. Deals like the Appalachia reforestation project are early steps in building a foundational, long-term carbon removal industry.
The post Google, Meta and McKinsey Lead Carbon Removal Boom and Turn Appalachia Green appeared first on Carbon Credits.
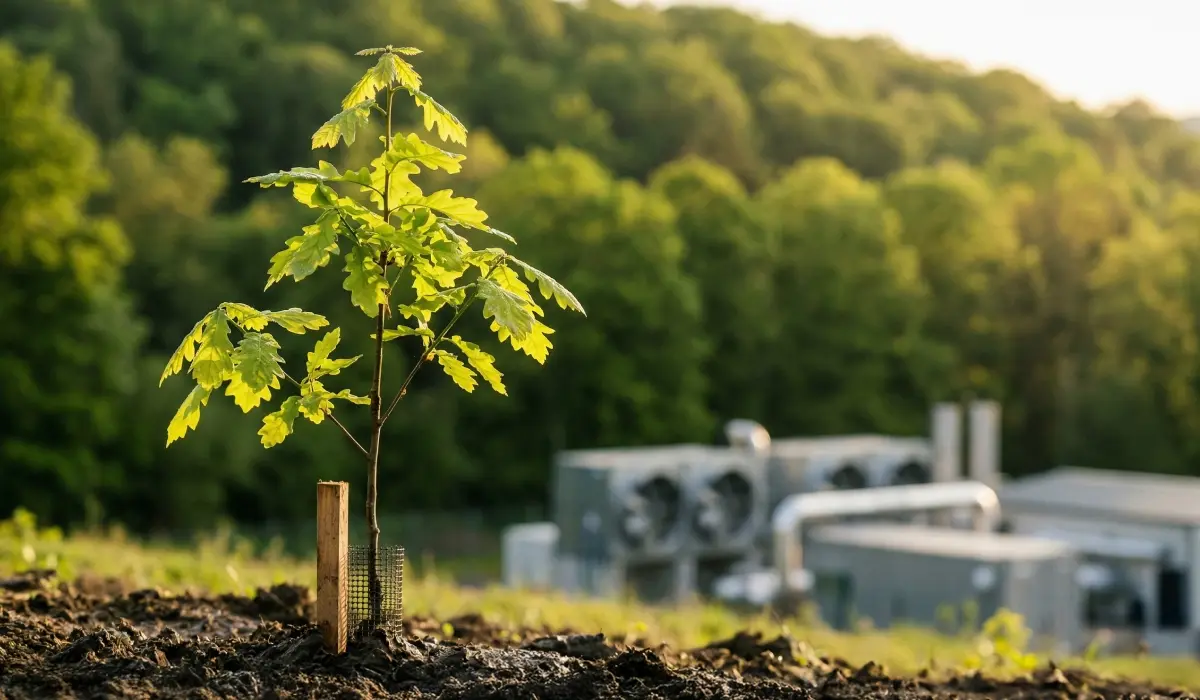
The sustainability landscape is increasingly complex. More and more carbon-capture solutions are entering the market, and innovation is a constant thread running through the carbon market. With more possibilities, buyers are faced with more considerations than simply offsetting carbon. In this sphere, two main directions are taking shape—nature-centred or tech-focused.
![]()

Nasdaq has backed one of the first carbon removal credit deals licensed under European Union rules. The project is based in Stockholm and is designed to generate high-quality carbon removal credits under a formal EU framework.
This marks a key shift. For years, carbon markets have relied on voluntary standards with mixed credibility. Now, the European Union has developed a regulated system to define what counts as a valid carbon removal. This move aims to build trust and attract large investors into a market that is still in its early stages.
The deal shows growing interest from major companies. It also reflects rising demand for reliable ways to remove carbon from the atmosphere.
Inside the Stockholm Carbon Removal Project
The removal project is run by Stockholm Exergi. It uses a process called BECCS, or bioenergy with carbon capture and storage. This method burns biomass, such as wood waste and agricultural residues, to produce heat and electricity. At the same time, it captures the carbon dioxide released and stores it underground.
The captured CO₂ will be transported and stored deep beneath the North Sea in rock formations. Over time, it will turn into solid minerals. This makes the carbon removal long-lasting and more secure than many nature-based solutions.
The facility is expected to start operating in 2028. Once active, it will generate carbon removal credits that companies can buy to balance their remaining emissions.
Beccs Stockholm is one of the world’s largest carbon removal projects. In its first ten years, the project could remove about 7.83 million tonnes of CO₂ equivalent. This makes it a key tool for helping the European Union reach climate neutrality by 2050.
The project also aims to scale carbon removal by building a full CCS value chain in Northern Europe and supporting a growing market for negative emissions credits.
This project is important because it is one of the first to follow the EU’s new carbon removal certification rules. These rules define how carbon removal should be measured, verified, and reported. They also aim to reduce risks like double-counting and weak accounting.
EU Certification: Building Trust in a Fragile Market
The European Commission has introduced a framework, also called Carbon Removals and Carbon Farming (CRCF) Regulation, to certify carbon removal activities. This includes technologies like BECCS, direct air capture with carbon storage, and biochar.
The goal is to create a trusted system that investors and companies can rely on. It also established the first EU-wide certification framework for carbon farming and carbon storage in products, not just removals.
Until now, the voluntary carbon market (VCM) has faced criticism. Concerns about transparency and “greenwashing” have made some companies cautious. Many buyers want stronger proof that credits represent real and permanent carbon removal.
The EU framework tries to solve this problem. It sets clear rules for:
- Measuring how much carbon is removed.
- Verifying results through independent checks.
- Ensuring long-term storage of CO₂.
This structure may help standardize the market. It could also make carbon removal credits easier to compare and trade across borders. The Commission states that the goal of having the framework is:
“to build trust in carbon removals and carbon farming while creating a competitive, sustainable, and circular economy.”
Corporate Demand Is Growing—but Still Limited
Large companies are starting to invest in carbon removal. However, the market remains small compared to what is needed.
One major buyer is Microsoft. It currently holds about 35% of all global carbon removal credits, making it a dominant player in the market. In fact, it is responsible for 92% of purchased removal credits in the first half of 2025.
Other companies, including Adyen, a Dutch payments provider, have also joined the Stockholm project. These early buyers aim to secure a future supply of high-quality carbon credits as demand grows.
Ella Douglas, Adyen’s global sustainability lead, said in an interview with the Wall Street Journal:
“This project does exactly that [“catalytic impact” to the VMC] while also building key market infrastructure in collaboration with the European Commission.”
Still, many firms remain cautious. Carbon removal technologies are often expensive and not yet proven at a large scale. Some companies also worry about reputational risks if projects fail to deliver real climate benefits.
This creates a gap. Demand is rising, but the supply of trusted credits is still limited.
- SEE event: Carbon Removal Investment Summit 2026
A Market Set for Rapid Growth
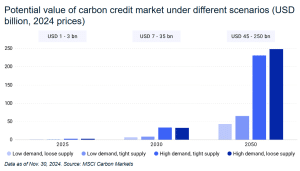
Despite these challenges, the long-term outlook for carbon removal is strong. Estimates suggest the market could reach $250 billion by mid-century, according to MSCI Carbon Markets.
Several factors drive this growth:
- First, global climate targets require large-scale carbon removal. The Intergovernmental Panel on Climate Change estimates that the world may need to remove around 10 billion metric tons of CO₂ per year by 2050 to limit warming.
- Second, many companies have set net-zero goals. These targets often include removing emissions that cannot be avoided, especially in sectors like aviation, shipping, and heavy industry.
- Third, new regulations are pushing companies to disclose and manage emissions more clearly. This increases demand for credible carbon solutions.
However, the current supply falls far short of what is needed. Only a small share of the required carbon removal credits has been developed or sold so far.
Balancing Removal and Emissions Cuts
While carbon removal is gaining attention, experts stress that it cannot replace emissions reductions. Removing carbon from the atmosphere is often more expensive and complex than avoiding emissions in the first place.
Groups like the European Environmental Bureau warn that over-reliance on credits could delay real climate action. They argue that companies should set separate targets for reducing emissions and for removing carbon.
The EU framework reflects this concern. It treats carbon removal as a tool for addressing residual emissions, not as a substitute for cutting pollution at the source. This distinction is important. It helps ensure that carbon markets support, rather than weaken, overall climate goals.
From Concept to Market Infrastructure
The Stockholm project marks a turning point for carbon removal. It shows how rules, strong verification, and corporate backing can bring structure to a fragmented market.
With support from players like Nasdaq, carbon removal is moving closer to becoming a mainstream financial asset. At the same time, the European Union’s certification system is setting the foundation for a more credible and scalable market.
The path ahead remains complex. Technologies must scale. Costs must fall. Trust must grow. But the direction is clear.
Carbon removal is no longer a niche idea. It is becoming a key part of the global climate economy, with the potential to shape investment flows for decades to come.
The post Nasdaq Invests in First EU-Certified Carbon Removal Credits from Stockholm Exergi appeared first on Carbon Credits.


-
Climate Change8 months ago
Guest post: Why China is still building new coal – and when it might stop
-
Greenhouse Gases8 months ago
Guest post: Why China is still building new coal – and when it might stop
-

 Greenhouse Gases2 years ago
嘉宾来稿:满足中国增长的用电需求 光伏加储能“比新建煤电更实惠”
-
Climate Change2 years ago
Bill Discounting Climate Change in Florida’s Energy Policy Awaits DeSantis’ Approval
-

 Climate Change2 years ago
嘉宾来稿:满足中国增长的用电需求 光伏加储能“比新建煤电更实惠”
-
Climate Change Videos2 years ago
The toxic gas flares fuelling Nigeria’s climate change – BBC News
-

 Renewable Energy5 months ago
Sending Progressive Philanthropist George Soros to Prison?
-

 Carbon Footprint2 years ago
US SEC’s Climate Disclosure Rules Spur Renewed Interest in Carbon Credits