

For years, wind energy has symbolized the clean energy transition. Towering turbines onshore and offshore have driven significant progress in reducing carbon emissions. However, recent setbacks in the global offshore wind industry have raised concerns about its future.
Rising costs, delayed projects, and shifting investment priorities force governments and companies to reassess their ambitious wind energy targets. While countries like China continue dominating the sector, others, including the United States and European nations, struggle to keep pace.
Profit vs. Progress: Why Energy Giants Are Scaling Back Offshore Ambitions
The offshore wind sector faces mounting challenges, with profitability concerns leading to significant withdrawals. Most recently, five energy companies, including Shell and Lyse, pulled out of Norway’s first large-scale floating offshore wind tender. The project, slated for 1.5 GW of capacity, has been deemed too risky due to profitability, timelines, and industrial maturity concerns.
Norway’s government capped state support at NOK 35 billion (EUR 3 billion), which critics argue is insufficient to attract large-scale investments. Energy Minister Terje Aasland defended the cap, stating it would be enough to launch 500 MW of floating wind capacity.
However, energy companies like Fred. Olsen Seawind and Hafslund have opted out, citing Norway’s restriction on mainland-only connections, which limits the profitability of exporting energy to other countries.
This follows a pattern seen elsewhere in Europe, where rising costs and regulatory constraints are driving companies to reconsider offshore wind projects. Denmark’s Ørsted, a global leader in renewables, has also exited several offshore wind opportunities, highlighting broader challenges within the sector.
Skyrocketing Costs Blow Offshore Wind Goals Off-Course
Globally, the offshore wind industry is grappling with escalating costs.
- Over the past two years, the average cost of offshore wind projects has risen by 30% to 40%, reaching $230 per megawatt-hour (MWh). This is more than 3x the cost of onshore wind, placing significant pressure on developers.
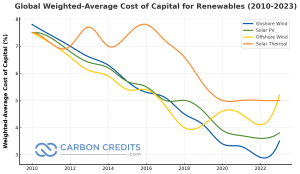
Inflation, supply chain disruptions, and high interest rates have further exacerbated the financial strain.
Equinor, a leading player in renewable energy, recently withdrew from offshore wind projects in Vietnam, Spain, and Portugal, citing unsustainable costs. Paal Eitrheim, Equinor’s head of renewables, noted that:
“It’s getting more expensive, and we think things are going to take more time.”
- RELATED: The “Northern Lights” Shines: Shell, Equinor, and TotalEnergies JV Powers the Norway CCS Project
Similarly, Shell, another energy giant, is scaling back its offshore wind ambitions. Shell sold its stakes in projects across Massachusetts, South Korea, Ireland, and France, signaling a strategic retreat from leading offshore developments. A company’s spokesperson stated in an email to S&P Global:
“While we will not lead new offshore wind developments, we remain interested in offtakes where commercial terms are acceptable and are cautiously open to equity positions if there is a compelling investment case.”
Shell CEO Wael Sawan admitted that the company lacks the competitive advantage to generate material returns in renewable generation. This sentiment is echoed by other oil majors like BP.
The withdrawal of these energy giants underscores a fundamental shift in priorities, with many companies now favoring onshore renewables like solar and wind, which are less affected by rising costs and regulatory hurdles. These challenges come at a time when global governments have set lofty targets for offshore wind energy.
Global Shortfalls and Missed Targets
Governments around the world have pinned their hopes on offshore wind as a key driver of the clean energy transition. The International Renewable Energy Agency (IRENA) initially projected a need to increase global offshore wind capacity from 73 GW to 494 GW by 2030 to meet climate goals.
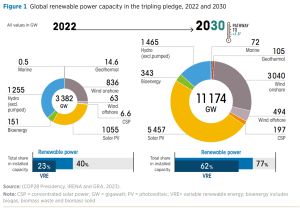
- However, revised estimates now suggest the industry will fall short by one-third, delaying this milestone until after 2035.
The U.S. Offshore Wind Dilemma
The U.S. offshore wind industry, for instance, is at a crossroads. The country aimed to install 30 GW of offshore wind by 2030 but has less than 200 MW operational as of mid-2024.
Despite federal support through tax credits and lease auctions, the sector faces significant challenges. The outgoing administration of President Joe Biden issued permits for 15 GW of projects and held six lease sales. However, the recent election of President-elect Donald Trump raises concerns about future policy support, as his campaign promised to dismantle the industry’s progress.
Carl Fleming, a renewable energy policy advisor, noted that market conditions alone make it unlikely for the U.S. to meet its 2030 goals, regardless of political leadership. Delays in project approvals and a lack of supply chain investment have hindered progress. Analysts predict the country will achieve less than half of its target due to these challenges.
The European Wind Shortfall
Europe, which currently accounts for 40% of global offshore wind capacity, is also falling behind. Rising costs and lengthy approval processes have slowed progress.
Nations like the UK, Germany, and the Netherlands are projected to meet only 60% to 70% of their 2030 targets. Even Norway, a country with abundant wind resources, is struggling to attract developers due to perceived risks and limited support mechanisms.
Future auctions will require far larger investments to meet the targets, putting additional pressure on developers and governments alike.
Rebecca Williams, deputy CEO of the Global Wind Energy Council, expressed cautious optimism, stating that with the right policies, targets remain achievable. However, delays and financial constraints make it increasingly unlikely that Europe will meet its goals within the set timelines.
China’s Offshore Wind Boom
While Western markets struggle, China continues to dominate the offshore wind sector.
- In 2023, China accounted for more than half of the world’s new offshore wind installations, adding 6.3 GW of capacity.
The country’s state-owned enterprises benefit from low financing costs, subsidies, and locally produced components, enabling rapid deployment.
China’s dominance is expected to grow further, with annual installations projected to reach 16 GW over the next few years. However, the country’s closed market limits opportunities for international developers to participate or benefit from its advancements.
The Winds of Change: Adapting to a Shifting Energy Landscape
Remarkably, a recent market development suggests renewed enthusiasm. Energy giants BP and JERA have partnered to create JERA Nex BP, a $6 billion joint venture aimed at becoming one of the world’s largest offshore wind developers. Combining their existing assets, the venture boasts a potential net generating capacity of 13 GW.
BP CEO Murray Auchincloss emphasized the company’s “capital-light” growth approach, while JERA CEO Yukio Kani highlighted offshore wind’s critical role in the energy transition.
With 1 GW of current capacity, 7.5 GW in development, and 4.5 GW of secured leases, this collaboration seems to bring back confidence in offshore wind’s role in the energy transition.
Ultimately, the offshore wind industry is facing significant headwinds, but it remains a vital part of the clean energy transition. The current challenges highlight the need for governments and developers to adapt, innovate, and collaborate to ensure wind energy remains viable.
China’s rapid progress offers valuable lessons on the benefits of state support and localized manufacturing, while the struggles in Western markets underscore the importance of addressing financial and regulatory barriers.
The question is not whether offshore wind will survive but how it can evolve to meet the demands of a rapidly changing energy landscape.
- FURTHER READING: Sweden’s 100 GW Offshore Wind Power Ambition: Unlocking a Renewable Energy Powerhouse
The post Gone with the Wind: Is This the End for Wind Energy? appeared first on Carbon Credits.

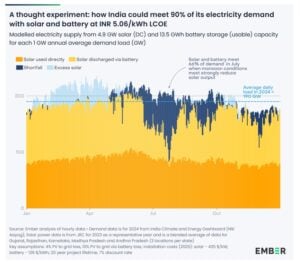


The post Solar Plus Batteries Can Meet 90% of India’s Electricity Needs, Says Ember appeared first on Carbon Credits.
Carbon Footprint
Bioleaching Breakthrough in Canada: How MIRARCO’s Pilot Facility Turns Mine Waste into Critical Minerals
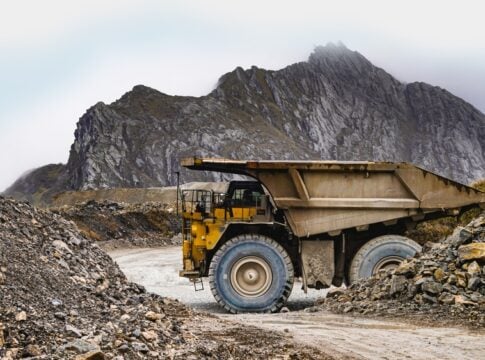
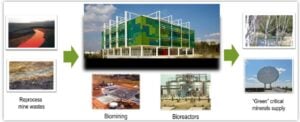
A new wave of innovation is reshaping how the mining industry approaches waste. CBC News, Canada, reported that researchers in Sudbury, northern Ontario, are developing a bacteria-based technology called bioleaching, which uses naturally occurring microbes to extract valuable metals such as nickel, cobalt, and copper from old mine tailings.
Led by MIRARCO Mining Innovation, the team recently opened a pilot facility in October 2025 to scale up this process, aiming to transform mining waste into a source of critical minerals while cutting emissions, reducing environmental risks, and unlocking billions of dollars in untapped resources.
Sudbury Moves Toward Commercial Bioleaching
Sudbury has a long history of mining, leaving behind massive piles of tailings—the leftover rock and sediment from ore extraction. These materials still hold billions of dollars’ worth of metals, but until now, recovering them was difficult, energy-intensive, and expensive. The bioleaching technology changes that. By using bacteria that naturally digest minerals, scientists can release metals from waste rock without relying on harsh chemicals or high temperatures.
According to Nadia Mykytczuk, CEO of MIRARCO, the new pilot facility represents a shift toward sustainable mining. She precisely mentioned that,
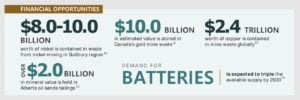
In Sudbury alone, the tailings contain $8 billion to $10 billion worth of nickel. With this facility, we are shaping a new era of mining innovation—one that focuses on clean technology, critical minerals, and preparing the workforce of tomorrow.
The facility connects research, industry, and community partners, creating a hub for applied research in bioleaching and bioprocessing.
Before moving to the new facility, MIRARCO operated within Laurentian University, and the long-standing partnership continues. The pilot center allows researchers to handle larger samples of mine waste and test how bioleaching works at a scale closer to industrial operations. This is essential for proving that the process can be commercially viable in Canada.
Bioleaching Breakthrough: Turning Tailings into Critical Minerals
- The process starts by grinding the mine tailings and mixing them with a nutrient-rich liquid. Scientists then introduce specialized bacteria into the mixture.
- These microbes feed on the minerals, producing chemical reactions that dissolve metals into the liquid.
- The resulting slurry moves through a series of reactors, where the process continues, and metals are eventually collected in a liquid form.
Early experiments are promising. Scientists at MIRARCO have noted that the process can recover 98–99 percent of nickel from the tested tailings. The value surpasses traditional methods that often leave large amounts of valuable minerals behind.
In separate research, scientists are growing and refining the bacteria. Different microbes target specific minerals. Some thrive in acidic conditions, ideal for breaking down sulfide tailings, while others focus on iron oxides or silicate rocks.
This flexibility allows scientists to extract not only common metals like nickel and copper but also rare earth elements and lithium, which are critical for batteries and renewable energy technology.
Environmental and Carbon Benefits
Traditional metal extraction uses energy-intensive methods, including high-temperature processing, chemical treatments, and heavy machinery. This approach produces substantial carbon emissions and generates more waste. Bioleaching operates at ambient temperature and pressure, reducing energy use by an estimated 30–40 percent.
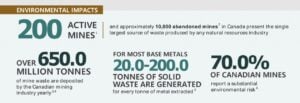
It also tackles the challenge of storing mining waste. Canada produces around 650 million tons of mine tailings every year. Much of this material sits in ponds behind dams, which can be unstable and pose long-term environmental risks.
Significantly, tailings may generate acid or release metals into the environment, and dam failures can have serious consequences. The 2014 Mount Polley mine tailings dam failure incident in British Columbia is a stark reminder of these dangers.
By turning tailings into a source of metals, bioleaching reduces the volume of waste requiring storage, cutting both environmental risk and the legacy costs of old mining sites.
Overcoming Challenges
While promising, the technology is not without hurdles. Processing tailings can be costly, and the bacteria require careful monitoring and specific growth conditions. Scaling up from pilot operations to full commercial production will also need investment in infrastructure and specialized equipment.
Environmental experts, such as MiningWatch Canada, note that tailings can behave unpredictably. They may chemically react over time or shift physically, posing stability concerns. Effective containment and monitoring are critical to ensure the process remains safe at larger scales.
Despite these challenges, researchers are optimistic. Early pilot studies indicate that the bacterial method could recover 65–80 percent of minerals left behind by conventional processing. This is a significant improvement that makes further investment worthwhile.
Fueling Canada’s Clean Energy Future
The technology comes at a crucial time. Global demand for critical minerals is rising as electric vehicles, wind turbines, and solar panels become more widespread. Canada has identified 31 minerals essential for the energy transition, but many are currently imported from regions with supply risks. Bioleaching offers a way to unlock domestic resources while reducing dependence on imports.
The process could provide materials for electric vehicle batteries, grid infrastructure, and industrial applications. Lithium and cobalt can power EVs, rare earth elements like neodymium and dysprosium support wind turbines and other clean energy systems, and copper and nickel are essential for electrical grids.
By recovering these from tailings, Canada could strengthen its supply chains while reducing environmental impact.
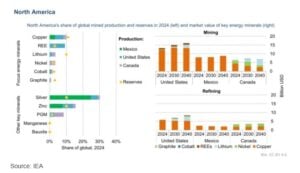
By 2040, the IEA expects the value of North America’s energy minerals to grow to around USD 30 billion for mining and USD 14 billion for refining. Mining growth will mainly come from copper in the United States and Mexico, and from lithium and nickel in Canada.
For refining, the region could make up about 4% of the global market, led by copper and lithium refining in the United States and copper and nickel refining in Canada.
Moving Toward Commercial Deployment
MIRARCO aims to transition from pilot testing to full-scale operations in the next two to three years. Globally, bioleaching is already in use at around 30 mining sites, but Canada has yet to deploy it commercially. The pilot facility in Sudbury is helping bridge that gap by testing continuous processing and demonstrating commercial viability.
Government support is also playing a key role. CBC further highlighted that funding through Canada’s Clean Technology Program and provincial innovation grants is helping advance research and development. The technology aligns with national goals to position Canada as a global leader in sustainable critical minerals production by 2030.
Overall, industry analysts predict bioextraction could become commercially viable within three to five years for specific minerals, with broader adoption following as operational experience grows.
The post Bioleaching Breakthrough in Canada: How MIRARCO’s Pilot Facility Turns Mine Waste into Critical Minerals appeared first on Carbon Credits.
Carbon Footprint
Thacker Pass Is Being Built: Here Is Why That Is the Best News NILI Investors Have Heard All Year.

Disseminated on behalf of Surge Battery Metals.
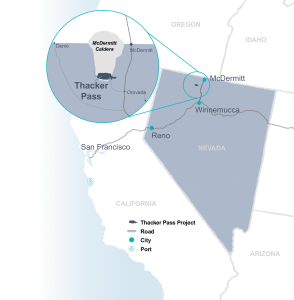
Lithium Americas (LAC) has officially broken ground at Thacker Pass, Nevada. The project is advancing toward its first production target in 2028. LAC CEO Jonathan Evans said in the company’s news release that the project should be mechanically complete by the end of 2026. Commissioning will happen through 2027, with commercial production starting in 2028.
For investors watching Nevada clay lithium, this milestone is more than an update. It’s a market signal that could change the investment landscape.
De-Risking the Clay Lithium Category
For years, clay-based lithium has faced a single recurring objection: “It has never been done at a commercial scale.” Unlike brine or hard-rock lithium, sedimentary clay deposits presented a technological and operational unknown. Investors and lenders were cautious, capital costs were higher, and early-stage projects struggled to secure financing.
Thacker Pass changes that narrative. Once LAC makes battery-grade lithium carbonate from sedimentary clay at a commercial scale, it reduces risks for the whole category. Projects in Nevada now have clear proof that clay-based lithium can be mined and processed effectively.
The historical precedent is instructive. In Chile’s Atacama region, the first brine lithium projects proved the chemistry and cost-effectiveness of large-scale lithium extraction. Later projects attracted capital more easily and on better terms. This created a ripple effect, speeding up the region’s lead in global lithium supply.
Thacker Pass is playing that same role for sedimentary clay. Its success is not just a win for LAC. It marks a key milestone for the whole Nevada clay lithium sector, including the Nevada North Lithium Project (NNLP) of Surge Battery Metals (TSX-V: NILI | OTCQX: NILIF).
Understanding the Technical Landscape
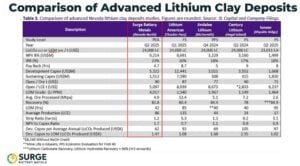
Thacker Pass Phase 1 has lithium levels of 1,500–2,500 ppm. They plan to extract it using sulfuric acid leaching to create battery-grade lithium carbonate. The project is important both geographically and operationally.
It features a large pit, a big processing facility, and integrated infrastructure. This covers access roads, water supply management, and energy sources that meet Nevada’s rules.
While Thacker Pass shows commercial viability, it is crucial to note that NNLP and Thacker Pass are not technically the same. NNLP employs a different beneficiation approach and reagent chemistry to optimize recovery.
NNLP: The Higher-Grade, Next-Generation Project
Thacker Pass shows clay lithium on a large scale. NNLP positions itself as the next evolution of this asset class, with clear geological advantages:
- Grade: NNLP averages 3,010 ppm lithium, significantly higher than Thacker Pass Phase 1 material. Recent drilling results show that step-out drilling found a 31-meter intercept with 4,196 ppm lithium from surface. This gives NNLP a potential extraction advantage.
- Strip Ratio: NNLP’s 1.16:1 strip ratio is among the lowest in the sedimentary clay peer group. This indicates that it has favorable material movement requirements relative to ore recovered.
- Operating Costs: NNLP’s estimated OPEX is US$5,097/t LCE, lower than Thacker Pass guidance of ~US$6,200/t C1. It suggests that it has competitive economic positioning within the peer group.
Both projects produce battery-grade lithium carbonate using sulfuric acid leaching. However, each method is customized for the specific geology of the project. NNLP is not a copy of Thacker Pass. Rather, it is a next-generation clay project designed to leverage lessons learned while improving key parameters.
Moreover, infill drilling showed a steady, thick, high-grade core. It included intercepts like 116 meters at 3,752 ppm Li and 32 meters at 4,521 ppm Li. These results support future resource expansion. They also highlight the project’s scale, quality, and technical readiness as it prepares for a Pre-Feasibility Study.
- SEE MORE: Surge Battery Metals Strengthens Nevada North With High-Grade Expansion and Infill Success
Why Category De-Risking Matters for Investors
In emerging resource sectors, de-risking is often more valuable than the resource itself. Projects that validate a new extraction method or commodity unlock several market advantages:
- Lower financing risk: Investors are more willing to fund projects once proof of concept exists.
- Improved capital terms: Lending rates and equity expectations can improve when technology and economics are validated.
- Accelerated project development: Developers can move faster, reduce contingencies, and focus on optimization rather than proving viability.
Thacker Pass’s progress effectively removes the “first-mover risk” from sedimentary clay projects. NNLP has higher grades, near-surface mineralization, and competitive OPEX. Now, it can be assessed on its own merits, not on doubts about large-scale clay processing.
Strategic Significance in the U.S. Lithium Market
The timing of Thacker Pass’s construction and NNLP’s development aligns with broader policy and market trends. Lithium is a critical input for electric vehicles, grid-scale storage, and advanced defense technologies. The U.S. government has emphasized domestic lithium production as a strategic priority.
In March 2025, President Trump signed an executive order called “Immediate Measures to Increase American Mineral Production.” This order directs federal agencies to speed up permitting and support domestic projects. It also aims to lessen dependence on foreign supply chains for critical minerals.
Projects like Thacker Pass and NNLP benefit from this policy. They provide secure domestic sources that boost the lithium supply chain.
Nevada is central to this strategy. Its clay deposits are among the largest and best in the U.S. They provide a stable base for domestic lithium production, which supports electrification goals and helps reduce reliance on imports.
Thacker Pass’s progress also sends a signal beyond the Nevada clay sector. It demonstrates that investors and capital markets are willing to back sedimentary clay projects at scale. That validation reduces perceived risk for future projects. It also speeds up permitting and development timelines as well as strengthens valuation metrics.
NNLP, with its superior grade and shallower resource, stands to benefit disproportionately. It is no longer constrained by questions of category viability. It can now be evaluated based on its geological quality, operational efficiency, and potential returns.
NNLP’s advantages, combined with the category de-risking effect of Thacker Pass, position it as a next-generation investment opportunity in Nevada’s clay lithium space.
Looking Ahead: Domestic Lithium’s Role in Energy Transition
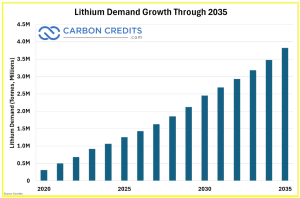
Lithium demand is set to grow rapidly as electric vehicles, battery storage, and renewable systems expand. Securing a high-quality, domestic supply is critical to maintaining U.S. leadership in clean energy technology.
Thacker Pass proves that commercial-scale sedimentary clay lithium is achievable. NNLP demonstrates the potential for even higher efficiency and superior economics within the same category. Together, these projects show how local resources can support the energy transition while providing compelling investment opportunities.
NNLP’s higher grades, near-surface mineralization, low strip ratio, and competitive OPEX position it as a leading asset within a now-validated category.
For NILI investors, the message is clear: the clay lithium category is no longer theoretical, and NNLP is positioned to capitalize on the proof-of-concept success. The best news of the year is here—and it’s grounded in both science and strategy.
DISCLAIMER
New Era Publishing Inc. and/or CarbonCredits.com (“We” or “Us”) are not securities dealers or brokers, investment advisers, or financial advisers, and you should not rely on the information herein as investment advice. Surge Battery Metals Inc. (“Company”) made a one-time payment of $90,000 to provide marketing services for a term of three months. None of the owners, members, directors, or employees of New Era Publishing Inc. and/or CarbonCredits.com currently hold, or have any beneficial ownership in, any shares, stocks, or options of the companies mentioned.
This article is informational only and is solely for use by prospective investors in determining whether to seek additional information. It does not constitute an offer to sell or a solicitation of an offer to buy any securities. Examples that we provide of share price increases pertaining to a particular issuer from one referenced date to another represent arbitrarily chosen time periods and are no indication whatsoever of future stock prices for that issuer and are of no predictive value.
Our stock profiles are intended to highlight certain companies for your further investigation; they are not stock recommendations or an offer or sale of the referenced securities. The securities issued by the companies we profile should be considered high-risk; if you do invest despite these warnings, you may lose your entire investment. Please do your own research before investing, including reviewing the companies’ SEDAR+ and SEC filings, press releases, and risk disclosures.
It is our policy that information contained in this profile was provided by the company, extracted from SEDAR+ and SEC filings, company websites, and other publicly available sources. We believe the sources and information are accurate and reliable but we cannot guarantee them.
CAUTIONARY STATEMENT AND FORWARD-LOOKING INFORMATION
Certain statements contained in this news release may constitute “forward-looking information” within the meaning of applicable securities laws. Forward-looking information generally can be identified by words such as “anticipate,” “expect,” “estimate,” “forecast,” “plan,” and similar expressions suggesting future outcomes or events. Forward-looking information is based on current expectations of management; however, it is subject to known and unknown risks, uncertainties, and other factors that may cause actual results to differ materially from those anticipated.
These factors include, without limitation, statements relating to the Company’s exploration and development plans, the potential of its mineral projects, financing activities, regulatory approvals, market conditions, and future objectives. Forward-looking information involves numerous risks and uncertainties and actual results might differ materially from results suggested in any forward-looking information. These risks and uncertainties include, among other things, market volatility, the state of financial markets for the Company’s securities, fluctuations in commodity prices, operational challenges, and changes in business plans.
Forward-looking information is based on several key expectations and assumptions, including, without limitation, that the Company will continue with its stated business objectives and will be able to raise additional capital as required. Although management of the Company has attempted to identify important factors that could cause actual results to differ materially, there may be other factors that cause results not to be as anticipated, estimated, or intended.
There can be no assurance that such forward-looking information will prove to be accurate, as actual results and future events could differ materially. Accordingly, readers should not place undue reliance on forward-looking information. Additional information about risks and uncertainties is contained in the Company’s management’s discussion and analysis and annual information form for the year ended December 31, 2025, copies of which are available on SEDAR+ at www.sedarplus.ca.
The forward-looking information contained herein is expressly qualified in its entirety by this cautionary statement. Forward-looking information reflects management’s current beliefs and is based on information currently available to the Company. The forward-looking information is made as of the date of this news release, and the Company assumes no obligation to update or revise such information to reflect new events or circumstances except as may be required by applicable law.
Disclosure: Owners, members, directors, and employees of carboncredits.com have/may have stock or option positions in any of the companies mentioned: .
Carboncredits.com receives compensation for this publication and has a business relationship with any company whose stock(s) is/are mentioned in this article.
Additional disclosure: This communication serves the sole purpose of adding value to the research process and is for information only. Please do your own due diligence. Every investment in securities mentioned in publications of carboncredits.com involves risks that could lead to a total loss of the invested capital.
Please read our Full RISKS and DISCLOSURE here.
The post Thacker Pass Is Being Built: Here Is Why That Is the Best News NILI Investors Have Heard All Year. appeared first on Carbon Credits.

Solar Plus Batteries Can Meet 90% of India’s Electricity Needs, Says Ember
Bioleaching Breakthrough in Canada: How MIRARCO’s Pilot Facility Turns Mine Waste into Critical Minerals
Iran Energy Shock Tests Limits of Trump’s Vision of US Energy Dominance
-
Climate Change8 months ago
Guest post: Why China is still building new coal – and when it might stop
-
Greenhouse Gases8 months ago
Guest post: Why China is still building new coal – and when it might stop
-

 Greenhouse Gases2 years ago
嘉宾来稿:满足中国增长的用电需求 光伏加储能“比新建煤电更实惠”
-
Climate Change2 years ago
Bill Discounting Climate Change in Florida’s Energy Policy Awaits DeSantis’ Approval
-

 Climate Change2 years ago
嘉宾来稿:满足中国增长的用电需求 光伏加储能“比新建煤电更实惠”
-
Climate Change Videos2 years ago
The toxic gas flares fuelling Nigeria’s climate change – BBC News
-

 Renewable Energy6 months ago
Sending Progressive Philanthropist George Soros to Prison?
-

 Carbon Footprint2 years ago
US SEC’s Climate Disclosure Rules Spur Renewed Interest in Carbon Credits