

Gold mining is not only energy-intensive but is also challenging. Miners weigh various factors like geology, ore grades, depth, and transport distances which could potentially turn into challenges as well. However, as the world is transitioning to sustainability, gold fields are significantly considering reliable energy supply and management not just for power operations but also for reducing emissions.
The gold mining industry as a whole has a clear path to decarbonization that aligns with the Paris Agreement. They aim to cut absolute emissions by 50% and net emissions by 30% on their journey to net zero by 2050.
S&P Global Commodity Insights recently launched a gold emissions curve that showed, in 2024 emissions were lower than the 2021 baseline. It revealed:
“329 primary gold mines emitted greenhouse gases at an average rate of 792 kilograms of CO2 equivalent per paid ounce of gold (kgCO2e/oz Au) produced, 39 kgCO2e/oz Au. The emissions are lower than in 2021.”

Tackling Scope 1 and Scope 2 Gold Emissions
The report further illustrated that Since 2021, Scope 1 and Scope 2 emissions per ounce of gold produced have steadily declined. The overall progress was a result of renewable adoption for electricity generation, operational improvements, and technological upgrades in on-site operations. In this regard, many gold mining companies turned to power purchase agreements and carbon offsets in their decarbonization strategy,
However, addressing Scope 1 emissions still remains a challenge. This is because they are related directly to mining operations like equipment use, fuel consumption, and diverse on-site processes.
- Scope 1 emissions increased by 0.68 million metric tons of CO₂ equivalent between 2021 and 2023.
Conversely, scope 2 emissions are easier to mitigate and have shown remarkable improvements. They are associated with purchased electricity, heating, cooling, and steam, and have shown notable improvements.
- In 2023, Scope 2 emissions accounted for 39% of total emissions, down from 41% in 2021.
- Scope 2 emissions dropped by 1.32 million metric tons with the 2021 baseline despite the increase in gold production by 2.1 million ounces.

Top 3 Low Emitter Gold Mines
Lundin Gold’s Fruta del Norte
Lundin Gold Inc., based in Vancouver, British Columbia, is a Canadian mining company with a strong focus on sustainability and efficiency. The company 100% owns the Fruta del Norte gold mine in southeast Ecuador, which has been producing gold since late 2019.
Known for its low carbon emissions, high-grade output, and cost efficiency, Fruta del Norte is among the most environmentally responsible and productive gold mines globally. In 2023, it achieved an impressive production of 481,274 ounces of gold, making it one of South America’s largest gold producers.
The company holds 28 metallic mineral concessions and three construction material concessions in Ecuador’s Zamora Chinchipe province. As per its sustainability report,
- Lundin Gold maintains an industry-leading greenhouse gas (GHG) emissions intensity of just 0.08 tCO2e per ounce of gold produced. This makes the miner a top low-carbon gold producer.
The mine is powered by Ecuador’s national grid, which sources 81% of its energy from renewables. This is how it achieves significantly lower Scope 2 emissions.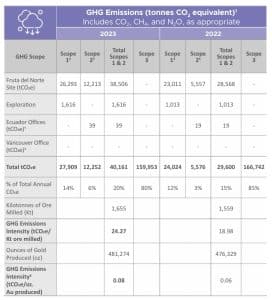 Source: Lundin Gold
Centerra Gold Inc.
In 2023, Centerra Gold Inc. achieved a 77% drop in emissions intensity at its Öksüt mine, despite production suspension in 2022 due to mercury detection. They resumed operations in 2023 and sold higher gold ounces after resuming operations in June 2023. A mercury abatement system was installed to restart the mine. This led to the production of 195,926 ounces of gold—the highest since 2020- and consequently, it cut down emissions.
As per their sustainability report,
- Global Scope 1 emissions totaled 107,384 metric tons of CO₂e in 2023. The company’s two main operating mines, Mount Milligan and Öksüt, accounted for 90,655 metric tons.
Mount Milligan reduced emissions by 7% due to shorter haulage distances and optimized pit sequencing, while Öksüt achieved a 21% decrease from temporary mining interruptions and improved haulage cycles.
- Global Scope 2 emissions totaled 33,790 metric tons of CO₂e in 2023, with 13,185 metric tons from Mount Milligan and Öksüt.
Despite a 7% rise in electricity use, emissions remained stable through efficient energy use. Notably, Scope 3 emissions, with purchased goods and services contributed to more than 50%.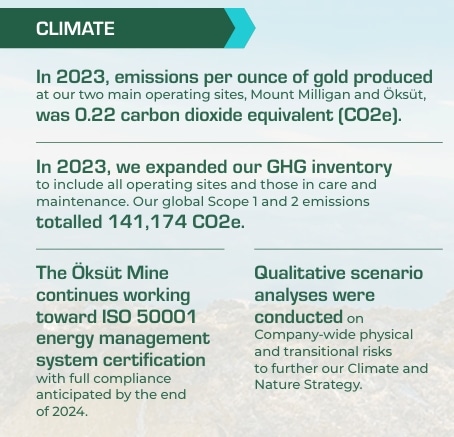
Source: Centerra-Gold
The company uses the Greenhouse Gas Protocol for emissions reporting and is exploring cost-effective decarbonization pathways to cut Scope 1 and Scope 2 emissions in the coming years. Additionally, it is evaluating opportunities to reduce scope 3 emissions.
Agnico Eagle Mines Ltd.
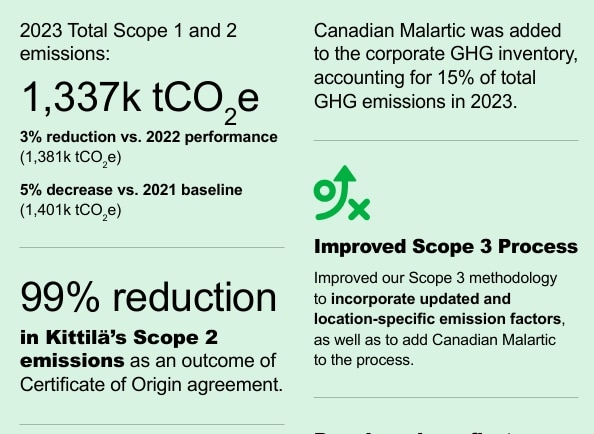
The Canada-based gold mining company, is the world’s third-largest gold producer, with operations in Canada, Australia, Finland, and Mexico. In 2023, the company achieved significant progress in reducing its emissions, particularly with its Kittila mine, which halved its Scope 2 emissions intensity. They achieved this by sourcing all of its grid electricity from zero-emission sources.
 Source: Agnico Eagle
In total, Agnico Eagle produced 3.44 million ounces of gold in 2023, and all 11 of its active operations outperformed the industry average for emissions per ounce of gold produced.
The company’s total Scope 1 and 2 emissions in 2023 were 1,337,000 tCO₂e, a 3% reduction from 2022 and a 5% decrease from the 2021 baseline.
The mining giant has robust plans to upgrade its technological innovation, decarbonization efforts, and its Energy and Greenhouse Gas Management Strategy. Its dedication to sustainability and emissions reduction underscores its leadership in responsible gold production.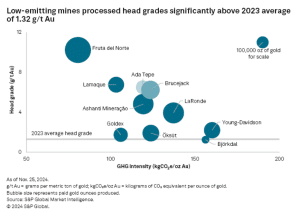
Other Players
For 2023, PJSC Polyus has fully offset its Scope 2 emissions since 2021 by sourcing renewable energy and acquiring carbon-free electric energy certificates from H2 Clean Energy LLC to cover 72,000 metric tons of CO₂e in 2023.
Additionally, Kinross Gold Corp. reduced its Scope 2 emissions intensity by 31% and Barrick Gold’s Nevada operations significantly cut 197,000 metric tons in 2023 with the 2020 baseline.
These reductions primarily came from renewable energy sources like hydroelectric and power purchase agreements to buy energy credits from solar power plants.
On the flip side, Sibanye Stillwater had the highest emission footprint…
The S&P Global report also highlighted that among all gold mines, South African mines have record-high emissions. And Sibanye Stillwater’s Cooke operation topped the list. It recorded a massive amount of 9,980 kg CO₂e per ounce of gold in 2023. The mine relies heavily on electricity from South Africa’s coal-based grid and processes low-grade historic tailings through two plants, Cooke and Ezulwini.
Outside South Africa, Pueblo Viejo in the Dominican Republic ranked second, with 3,236 kg CO₂e per ounce of gold in 2023, indicating a 25% rise from 2022. Emissions intensity increased due to a 22% drop in production, lower head grades, and reliance on diesel-powered plants.
Gold’s Role in a Sustainable Future
Gold plays a key role in modern technologies and the shift to a low-carbon economy. Its inclusion in investment portfolios also boosts resilience against climate risks, solidifying its status as a sustainable asset in global finance.
The gold mining industry is aligning with sustainability goals by cutting its carbon footprint while increasing production. This balance highlights better energy efficiency, cleaner technologies, and improved operational strategies.
The post Gold Emissions Trends: Who Are the Top 3 Low Emitters? appeared first on Carbon Credits.
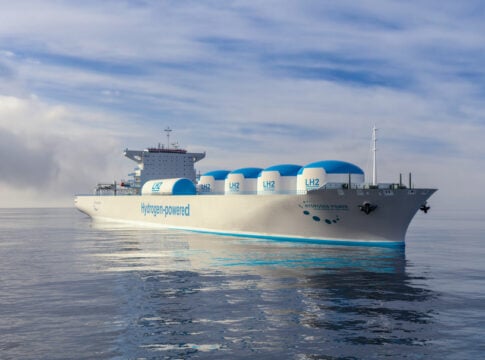
Japan has taken a major step in clean shipping. A consortium led by Japan Engine Corporation and Kawasaki Heavy Industries has successfully tested the world’s first hydrogen-fueled main engine for a large commercial vessel.
This engine is designed for deep-sea cargo ships, not just small vessels. That makes it a key milestone. Most earlier hydrogen ship projects focused on ferries or short routes.
The 3% Problem: Shipping’s Emissions Challenge
The engine is a low-speed, two-stroke design. This is the standard for large ocean-going ships. It can run mainly on hydrogen fuel. In tests, it achieved about 95% hydrogen use at full load, showing stable performance.
The engine will be installed on a 17,500-deadweight-ton multipurpose vessel. The ship is expected to be delivered in 2027. It will then undergo a three-year demonstration period starting in 2028.
Shipping is a major source of global emissions. The sector produces about 2–3% of global greenhouse gas emissions, based on data from the International Maritime Organization (IMO).
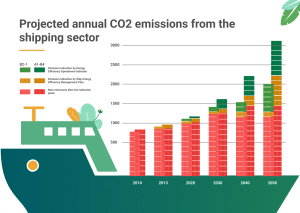
Most ships today use heavy fuel oil or marine diesel. These fuels produce high emissions. As global trade grows, shipping emissions could increase without new solutions.
Hydrogen is one option. When used as a fuel, it produces no carbon dioxide at the point of use. This makes it attractive for long-term decarbonization.
However, scaling hydrogen for large ships has been difficult. Key challenges include fuel storage, engine design, and safety. Japan’s latest engine test shows that progress is being made.
How Hydrogen Engines Work in Large Vessels
Hydrogen-powered ships can use fuel cells or combustion engines. Japan’s new system uses combustion. This means hydrogen burns inside the engine, similar to diesel. This approach allows easier integration with existing ship systems. It also reduces the need for full redesigns of vessels.
The engine uses liquid hydrogen fuel and advanced injection systems. Engineers have focused on stable combustion and material strength. Hydrogen burns faster than traditional fuels, so precision is critical.
The project includes partners such as Mitsui O.S.K. Lines (MOL), Onomichi Dockyard, and ClassNK. These groups support design, safety checks, and future operations.
The move is part of Japan’s Green Innovation Fund. The Ministry of Economy, Trade, and Industry has funded the program with about 2 trillion yen to help the country reach carbon neutrality by 2050.
Japan’s Net Zero Strategy and Hydrogen Push
This hydrogen engine project fits into Japan’s broader climate strategy. The country has pledged to reach net-zero greenhouse gas emissions by 2050. This goal was announced by former Prime Minister Yoshihide Suga in 2020.
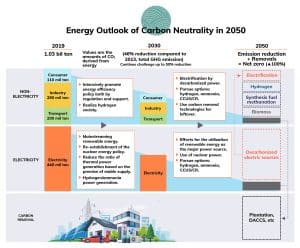
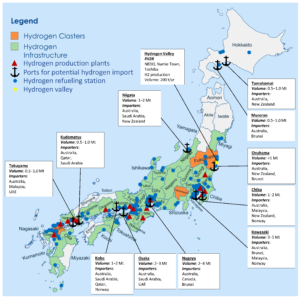
Japan sees hydrogen as a key part of its energy transition. Under its Basic Hydrogen Strategy, the government aims to expand hydrogen use across power, transport, and industry.
Japan plans to increase its hydrogen supply to 20 million tonnes per year by 2050, up from much lower current levels. The country is also investing in hydrogen imports, storage, and infrastructure.
Shipping plays a major role in this plan. Japan depends heavily on imports of energy and raw materials. Decarbonizing shipping is important for both climate and energy security.
- RELATED: Maritime Decarbonization: Japanese Shipping Giant NYK Partners with 1PointFive for DAC Credits
Projects like the hydrogen engine help link domestic policy with global action. They support Japan’s goal to build a full hydrogen value chain, from production to transport and end use.
Current Hydrogen Ferries in Operation
Japan has already started using hydrogen-powered ferries on real routes. One example is the Hanaria. This hybrid ship uses hydrogen fuel cells, lithium-ion batteries, and biodiesel. It began service in Kitakyushu in April 2024.
The ship can cut carbon dioxide emissions by 53% to 100% compared to regular vessels. It was built for a unit of Mitsui O.S.K. Lines and uses fuel cell technology developed with parts from Toyota.
Another example is the Mahoroba, built by Iwatani Corporation. This is a zero-emission hydrogen catamaran that can carry up to 150 passengers. It started commercial service in April 2025, transporting visitors to the Osaka-Kansai Expo.
In October 2025, the Tokyo Metropolitan Government agreed to bring the vessel to Tokyo Bay. It is expected to start operating there in fiscal year 2026. It will support environmental education and international events.
Japan has also invested in hydrogen transport systems. One example is the Suiso Frontier, which was launched to carry liquefied hydrogen across long distances. These efforts show that Japan is not only testing technology but also building the systems needed to scale hydrogen use globally.
From Ferries to Freighters: Scaling Hydrogen at Sea
Japan is part of a wider global shift. Many countries are testing hydrogen and other clean fuels for shipping.
For example, Norway launched the MF Hydra in 2023. Belgium introduced the Hydrotug 1 in 2024.
However, most of these vessels are small or operate on short routes. Japan’s project targets large cargo ships, which are more complex and more impactful for emissions.
Governments are also exploring hydrogen shipping corridors. These are planned routes where hydrogen-powered vessels can operate with proper fueling infrastructure. This global activity shows that hydrogen is moving from early testing to larger applications.
A $300B Hydrogen Market Meets Maritime Demand
The hydrogen economy is expanding quickly. Global demand is rising as industries look for low-carbon solutions.
Industry estimates suggest the global hydrogen market could exceed US$300 billion by 2030. Growth is driven by energy, transport, and industrial use.
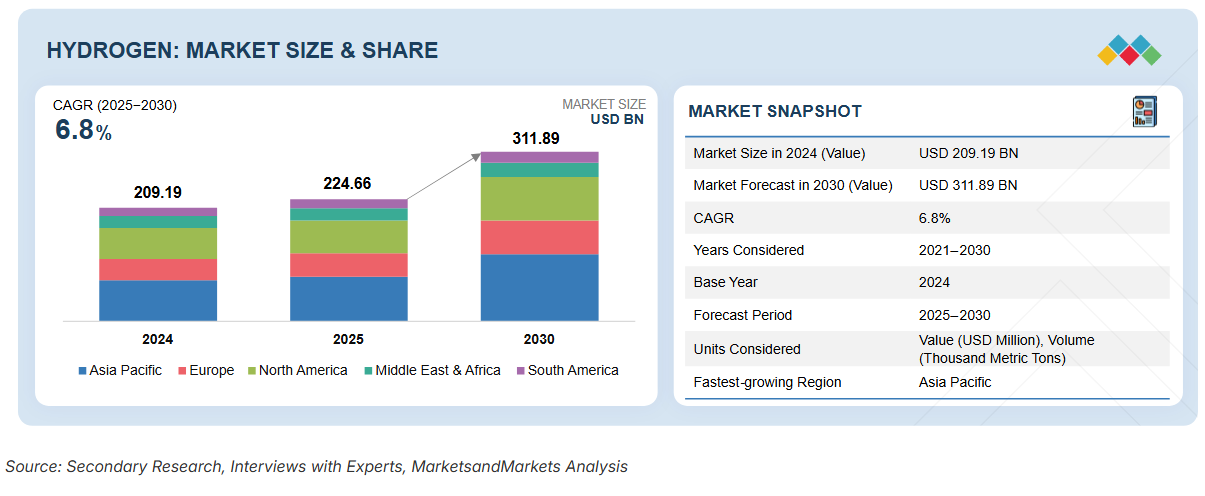
In shipping, hydrogen competes with other fuels like ammonia and methanol. Each has strengths and challenges. Hydrogen stands out for its zero carbon emissions at the point of use.
Cost, Storage, and Infrastructure Barriers
Still, hydrogen has limits. Several barriers remain before hydrogen ships become common:
- High costs compared to traditional fuels,
- Limited supply of green hydrogen,
- Lack of port infrastructure, and
- Strict safety requirements.
Despite these issues, investment is growing. Governments and companies are funding research, pilot projects, and infrastructure.
Japan’s demonstration project will help address those gaps. The planned three-year trial will provide real-world data on performance, safety, and costs. If successful, hydrogen engines could become a practical option for large vessels. This would help reduce emissions from global shipping.
Can Hydrogen Power the Future of Global Trade?
Japan’s hydrogen engine test marks a key moment for the shipping industry. It shows that hydrogen can power not only small vessels but also large commercial ships.
The link to Japan’s net-zero strategy makes this development even more important. It connects national policy with global climate goals.
The coming years will shape how fast hydrogen shipping grows. With strong policy support and continued innovation, hydrogen could play a major role in building a low-carbon maritime sector.
The post Japan Unveils First Hydrogen Engine for Large Ships appeared first on Carbon Credits.

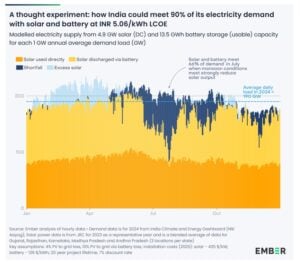

The post Solar Plus Batteries Can Meet 90% of India’s Electricity Needs, Says Ember appeared first on Carbon Credits.
Carbon Footprint
Bioleaching Breakthrough in Canada: How MIRARCO’s Pilot Facility Turns Mine Waste into Critical Minerals
A new wave of innovation is reshaping how the mining industry approaches waste. CBC News, Canada, reported that researchers in Sudbury, northern Ontario, are developing a bacteria-based technology called bioleaching, which uses naturally occurring microbes to extract valuable metals such as nickel, cobalt, and copper from old mine tailings.
Led by MIRARCO Mining Innovation, the team recently opened a pilot facility in October 2025 to scale up this process, aiming to transform mining waste into a source of critical minerals while cutting emissions, reducing environmental risks, and unlocking billions of dollars in untapped resources.
Sudbury Moves Toward Commercial Bioleaching
Sudbury has a long history of mining, leaving behind massive piles of tailings—the leftover rock and sediment from ore extraction. These materials still hold billions of dollars’ worth of metals, but until now, recovering them was difficult, energy-intensive, and expensive. The bioleaching technology changes that. By using bacteria that naturally digest minerals, scientists can release metals from waste rock without relying on harsh chemicals or high temperatures.
According to Nadia Mykytczuk, CEO of MIRARCO, the new pilot facility represents a shift toward sustainable mining. She precisely mentioned that,
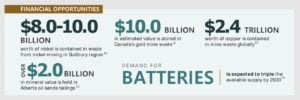
In Sudbury alone, the tailings contain $8 billion to $10 billion worth of nickel. With this facility, we are shaping a new era of mining innovation—one that focuses on clean technology, critical minerals, and preparing the workforce of tomorrow.
The facility connects research, industry, and community partners, creating a hub for applied research in bioleaching and bioprocessing.
Before moving to the new facility, MIRARCO operated within Laurentian University, and the long-standing partnership continues. The pilot center allows researchers to handle larger samples of mine waste and test how bioleaching works at a scale closer to industrial operations. This is essential for proving that the process can be commercially viable in Canada.
Bioleaching Breakthrough: Turning Tailings into Critical Minerals
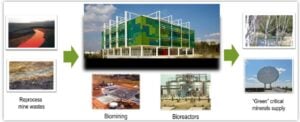
- The process starts by grinding the mine tailings and mixing them with a nutrient-rich liquid. Scientists then introduce specialized bacteria into the mixture.
- These microbes feed on the minerals, producing chemical reactions that dissolve metals into the liquid.
- The resulting slurry moves through a series of reactors, where the process continues, and metals are eventually collected in a liquid form.
Early experiments are promising. Scientists at MIRARCO have noted that the process can recover 98–99 percent of nickel from the tested tailings. The value surpasses traditional methods that often leave large amounts of valuable minerals behind.
In separate research, scientists are growing and refining the bacteria. Different microbes target specific minerals. Some thrive in acidic conditions, ideal for breaking down sulfide tailings, while others focus on iron oxides or silicate rocks.
This flexibility allows scientists to extract not only common metals like nickel and copper but also rare earth elements and lithium, which are critical for batteries and renewable energy technology.
Environmental and Carbon Benefits
Traditional metal extraction uses energy-intensive methods, including high-temperature processing, chemical treatments, and heavy machinery. This approach produces substantial carbon emissions and generates more waste. Bioleaching operates at ambient temperature and pressure, reducing energy use by an estimated 30–40 percent.
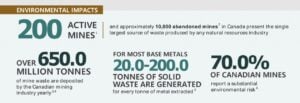
It also tackles the challenge of storing mining waste. Canada produces around 650 million tons of mine tailings every year. Much of this material sits in ponds behind dams, which can be unstable and pose long-term environmental risks.
Significantly, tailings may generate acid or release metals into the environment, and dam failures can have serious consequences. The 2014 Mount Polley mine tailings dam failure incident in British Columbia is a stark reminder of these dangers.
By turning tailings into a source of metals, bioleaching reduces the volume of waste requiring storage, cutting both environmental risk and the legacy costs of old mining sites.
Overcoming Challenges
While promising, the technology is not without hurdles. Processing tailings can be costly, and the bacteria require careful monitoring and specific growth conditions. Scaling up from pilot operations to full commercial production will also need investment in infrastructure and specialized equipment.
Environmental experts, such as MiningWatch Canada, note that tailings can behave unpredictably. They may chemically react over time or shift physically, posing stability concerns. Effective containment and monitoring are critical to ensure the process remains safe at larger scales.
Despite these challenges, researchers are optimistic. Early pilot studies indicate that the bacterial method could recover 65–80 percent of minerals left behind by conventional processing. This is a significant improvement that makes further investment worthwhile.
Fueling Canada’s Clean Energy Future
The technology comes at a crucial time. Global demand for critical minerals is rising as electric vehicles, wind turbines, and solar panels become more widespread. Canada has identified 31 minerals essential for the energy transition, but many are currently imported from regions with supply risks. Bioleaching offers a way to unlock domestic resources while reducing dependence on imports.
The process could provide materials for electric vehicle batteries, grid infrastructure, and industrial applications. Lithium and cobalt can power EVs, rare earth elements like neodymium and dysprosium support wind turbines and other clean energy systems, and copper and nickel are essential for electrical grids.
By recovering these from tailings, Canada could strengthen its supply chains while reducing environmental impact.
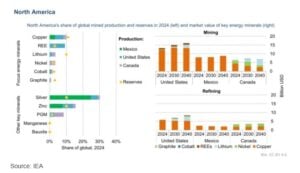
By 2040, the IEA expects the value of North America’s energy minerals to grow to around USD 30 billion for mining and USD 14 billion for refining. Mining growth will mainly come from copper in the United States and Mexico, and from lithium and nickel in Canada.
For refining, the region could make up about 4% of the global market, led by copper and lithium refining in the United States and copper and nickel refining in Canada.
Moving Toward Commercial Deployment
MIRARCO aims to transition from pilot testing to full-scale operations in the next two to three years. Globally, bioleaching is already in use at around 30 mining sites, but Canada has yet to deploy it commercially. The pilot facility in Sudbury is helping bridge that gap by testing continuous processing and demonstrating commercial viability.
Government support is also playing a key role. CBC further highlighted that funding through Canada’s Clean Technology Program and provincial innovation grants is helping advance research and development. The technology aligns with national goals to position Canada as a global leader in sustainable critical minerals production by 2030.
Overall, industry analysts predict bioextraction could become commercially viable within three to five years for specific minerals, with broader adoption following as operational experience grows.
The post Bioleaching Breakthrough in Canada: How MIRARCO’s Pilot Facility Turns Mine Waste into Critical Minerals appeared first on Carbon Credits.

-
Climate Change8 months ago
Guest post: Why China is still building new coal – and when it might stop
-
Greenhouse Gases8 months ago
Guest post: Why China is still building new coal – and when it might stop
-

 Greenhouse Gases2 years ago
嘉宾来稿:满足中国增长的用电需求 光伏加储能“比新建煤电更实惠”
-
Climate Change2 years ago
Bill Discounting Climate Change in Florida’s Energy Policy Awaits DeSantis’ Approval
-

 Climate Change2 years ago
嘉宾来稿:满足中国增长的用电需求 光伏加储能“比新建煤电更实惠”
-
Climate Change Videos2 years ago
The toxic gas flares fuelling Nigeria’s climate change – BBC News
-

 Renewable Energy6 months ago
Sending Progressive Philanthropist George Soros to Prison?
-

 Carbon Footprint2 years ago
US SEC’s Climate Disclosure Rules Spur Renewed Interest in Carbon Credits