

The global carbon market is undergoing a dramatic reset that could transform both supply and costs over the next 25 years. New projections from BloombergNEF (BNEF) suggest that carbon credit supply may grow 20- to 35-fold by 2050, creating one of the most significant financial mechanisms for funding decarbonization. But the shape of this future market hinges on integrity, governance, and the types of projects that ultimately win buyers’ trust.
While the long-term trajectory points upward, the road is being shaped by near-term shifts. From surging issuances to a rapid geographic rebalancing, the market reset is already redefining which sectors and regions are taking the lead.
Carbon Credit Costs Head Higher
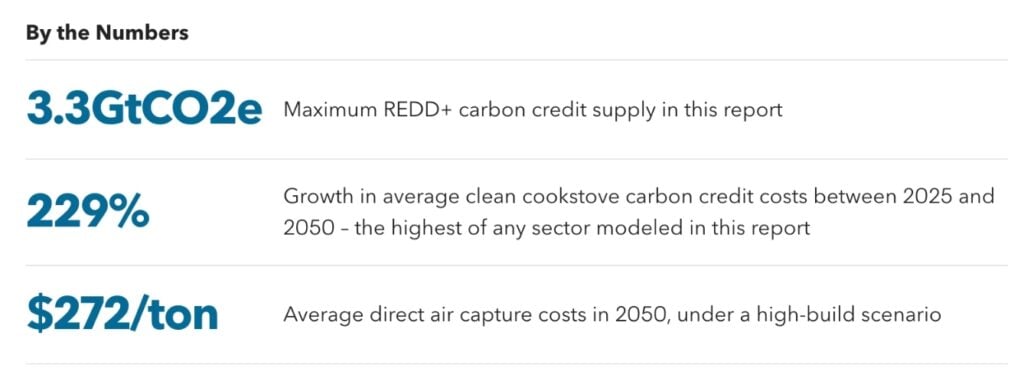
BNEF further points to steep increases in average costs as high-quality projects dominate. Prices could reach $60 per ton of CO₂e in 2030 and rise to $104 per ton in 2050 if technology-based removals, such as direct air capture (DAC), dominate the supply mix.
In scenarios where lower-quality credits flood the market, prices would remain significantly lower—just $69 per ton in 2050—but at the cost of weaker governance and reduced impact. This highlights the growing divide between volume-driven growth and integrity-driven supply.
Issuances Surge as Market Resets
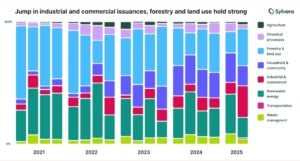
According to Sylvera, new credit creation has picked up pace. In Q2 2025, issuances reached 77 million credits, up 39% from Q1 and 14% higher than Q2 2024. This signals renewed confidence among project developers and buyers, with particular momentum in both traditional land-use projects and industrial breakthroughs.
Nature-Based Leaders Face New Competition
Forestry and Land Use projects still dominate, making up 31% of Q2 issuances. Within this group, Afforestation, Reforestation, and Revegetation (ARR) projects stood out. These credits averaged $24 each, reflecting higher implementation costs and buyers’ willingness to pay for premium, nature-based removals. For higher-rated ARR projects (BBB+), the premium stretched closer to $27, driven by limited supply.
Yet the real story this quarter was the surge in Industrial and Commercial projects, which jumped from 7.9% of issuances in H1 2024 to 19% in H1 2025. These include refrigerant recovery, methane capture from coal mines, and advanced industrial efficiency. Meanwhile, REDD+ projects rebounded strongly, climbing to 16% of Q2 issuances, their highest share since mid-2023.
This diversification shows the market moving beyond forests alone, with industrial innovation gaining ground.
North America Rises as Supply Hub
One of the most striking changes came from geography. North America more than doubled its share of issuances, rising from 21% in Q1 to 43% in Q2. This momentum made the American Carbon Registry (ACR) the top registry for the first time, accounting for 33% of all new credits.
It was followed by Gold Standard (25%) and Verra (21%), signaling a more competitive registry landscape. This shift reflects both investor appetite for high-integrity projects in North America and the region’s strong regulatory backdrop, which is creating demand for compliance-grade credits.
Cheap vs. Trusted: The Carbon Market’s Fork in the Road
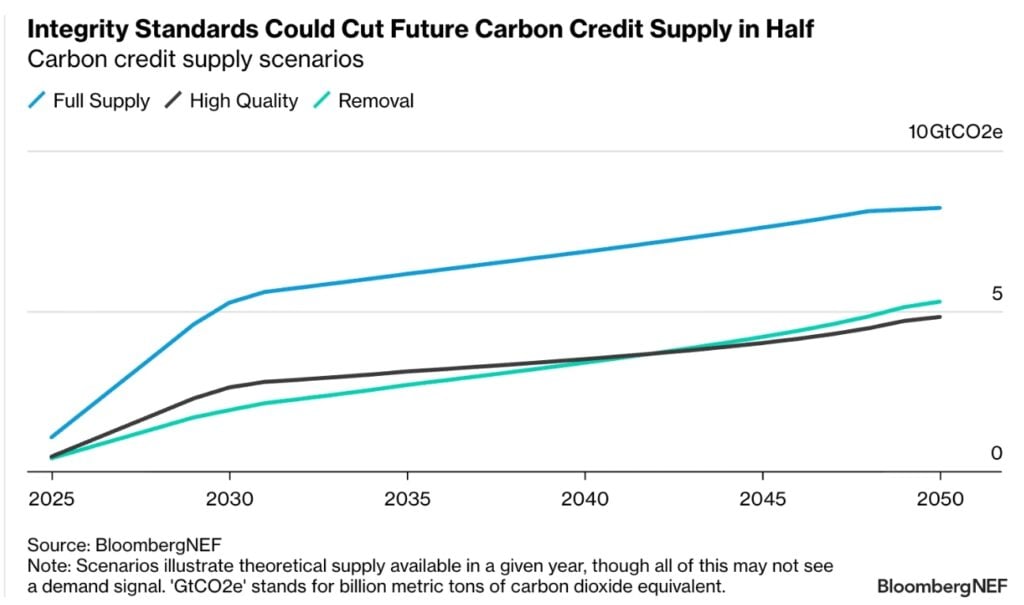
BNEF outlined the possible futures for the global carbon credit market. Carbon credit supply could follow three different paths, shaped by governance, investor trust, and project quality.
- High-Quality Scenario: If the market reset succeeds, supply reaches 2.6B tons in 2030 and 4.8B in 2050. The market stays smaller but centers on high-impact projects. Direct air capture (DAC) grows to 21% of supply by 2050, with prices averaging $104/ton.
- Full Supply Scenario: If governance fails, supply surges to 5.3B tons in 2030 and 8.2B in 2050. Most credits come from avoided deforestation and reforestation, about two-thirds of the total. Prices stay low at $69/ton, but quality concerns weaken trust.
- OTC Carbon Removal Scenario: This middle path sees bespoke deals growing 27 times since 2022. Supply hits 2B tons in 2030 and 5.3B in 2050. Bioenergy with carbon capture (BECCS) dominates, with prices at $98/ton by 2050.
The trade-off: Cheaper credits risk poor quality, while higher-cost, smaller markets could build the trust buyers want.
Buyers Pay Premium for Integrity
Even as average credit prices softened, buyers continued paying premiums for nature-based removal credits and high-rated projects. For instance, ARR credits rated BBB+ commanded roughly $27 each, compared to lower-rated alternatives.
This price differentiation shows that buyers—especially corporates seeking credible net-zero claims—are prioritizing quality over volume. Credits recognized in compliance systems or international frameworks also commanded higher prices, reflecting their stronger governance.
Carbon Pricing Expands Across Economies
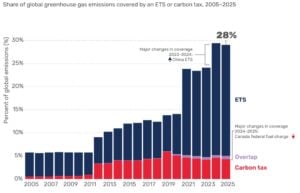
Alongside the voluntary market reset, government-led carbon pricing systems are expanding. As per the World Bank Group, by mid-2025, 43 carbon taxes and 37 emissions trading systems (ETSs) were in place, covering 28% of global emissions—up from 24% just a year earlier.
Several major moves drove this growth:
- China’s national ETS expanded beyond power to include cement, steel, and aluminum, adding 3 billion tons of coverage.
- Colombia broadened its carbon tax to include coal combustion.
Together, these expansions lifted global coverage to nearly 15 billion tons CO₂e, representing two-thirds of global GDP under a direct carbon price.
Power Sector Leads, Industry Joins In
The power sector continues to dominate carbon pricing. Over half of global power emissions—about 30% of global GHGs—are now priced. This matters because electrification of industry and transport can only deliver deep cuts if electricity itself is low-carbon.
Industry is catching up fast. Thanks to China’s ETS expansion, over 40% of industrial emissions are now covered, marking a major leap for one of the most carbon-intensive sectors.
Carbon Markets Channel Private Capital
Despite short-term price softening, demand remains resilient. Corporations remain the biggest buyers through voluntary and domestic compliance markets, viewing credits as essential for net-zero alignment. Global retirements rose in early 2025, driven by a spike in compliance demand.
This reflects carbon markets’ central role: channeling private capital into decarbonization projects while governments pursue broader policy goals like economic development, job creation, and fiscal stability.
The Political Economy of Pricing
The durability of carbon pricing depends not just on policy design but also on public sentiment and perceived fairness. Governments are balancing competing goals—emissions cuts, economic growth, and equity. As seen with China and Colombia, systems are being designed to ratchet up coverage and ambition over time, offering flexibility while building acceptance.
This political economy lens will be crucial as carbon pricing moves into harder-to-abate sectors like heavy industry and as middle-income economies such as Brazil, India, Indonesia, and Türkiye expand their systems.
Outlook: Carbon Market Integrity Over Volume
The global carbon market is no longer defined by raw volume. Instead, the reset since 2022 has pushed integrity to the forefront. Whether through nature-based solutions, industrial projects, or advanced removals, the projects that deliver measurable, durable impact will attract the highest demand and premiums.
What’s clear from BNEF’s forecast on carbon credits supply is that carbon markets will remain a cornerstone of climate finance, one where buyers, governments, and investors increasingly value quality over quantity.
The post Carbon Credits Supply to Skyrocket 35x by 2050 – But at What Price? appeared first on Carbon Credits.

EU carbon credit claims changed on 27 September 2026, the day the Directive (EU) 2024/825 began to apply across the European Union. The change is narrow. It changes how a company can talk about the credits it buys. A product can no longer be called neutral on the strength of compensation alone; however, every specific, evidenced statement about what a company measured, reduced, and funded stays fully available.

The post Promoting Improved Cooking Practices in Nigeria appeared first on Terrapass.



-
Climate Change1 year ago
Guest post: Why China is still building new coal – and when it might stop
-

 Greenhouse Gases2 years ago
嘉宾来稿:满足中国增长的用电需求 光伏加储能“比新建煤电更实惠”
-
Greenhouse Gases1 year ago
Guest post: Why China is still building new coal – and when it might stop
-

 Climate Change2 years ago
嘉宾来稿:满足中国增长的用电需求 光伏加储能“比新建煤电更实惠”
-

 Renewable Energy12 months ago
Sending Progressive Philanthropist George Soros to Prison?
-
Climate Change2 years ago
Bill Discounting Climate Change in Florida’s Energy Policy Awaits DeSantis’ Approval
-
Greenhouse Gases1 year ago
嘉宾来稿:探究火山喷发如何影响气候预测
-

 Climate Change2 years ago
Analysis: China’s CO2 falls 1% in Q2 2024 in first quarterly drop since Covid-19