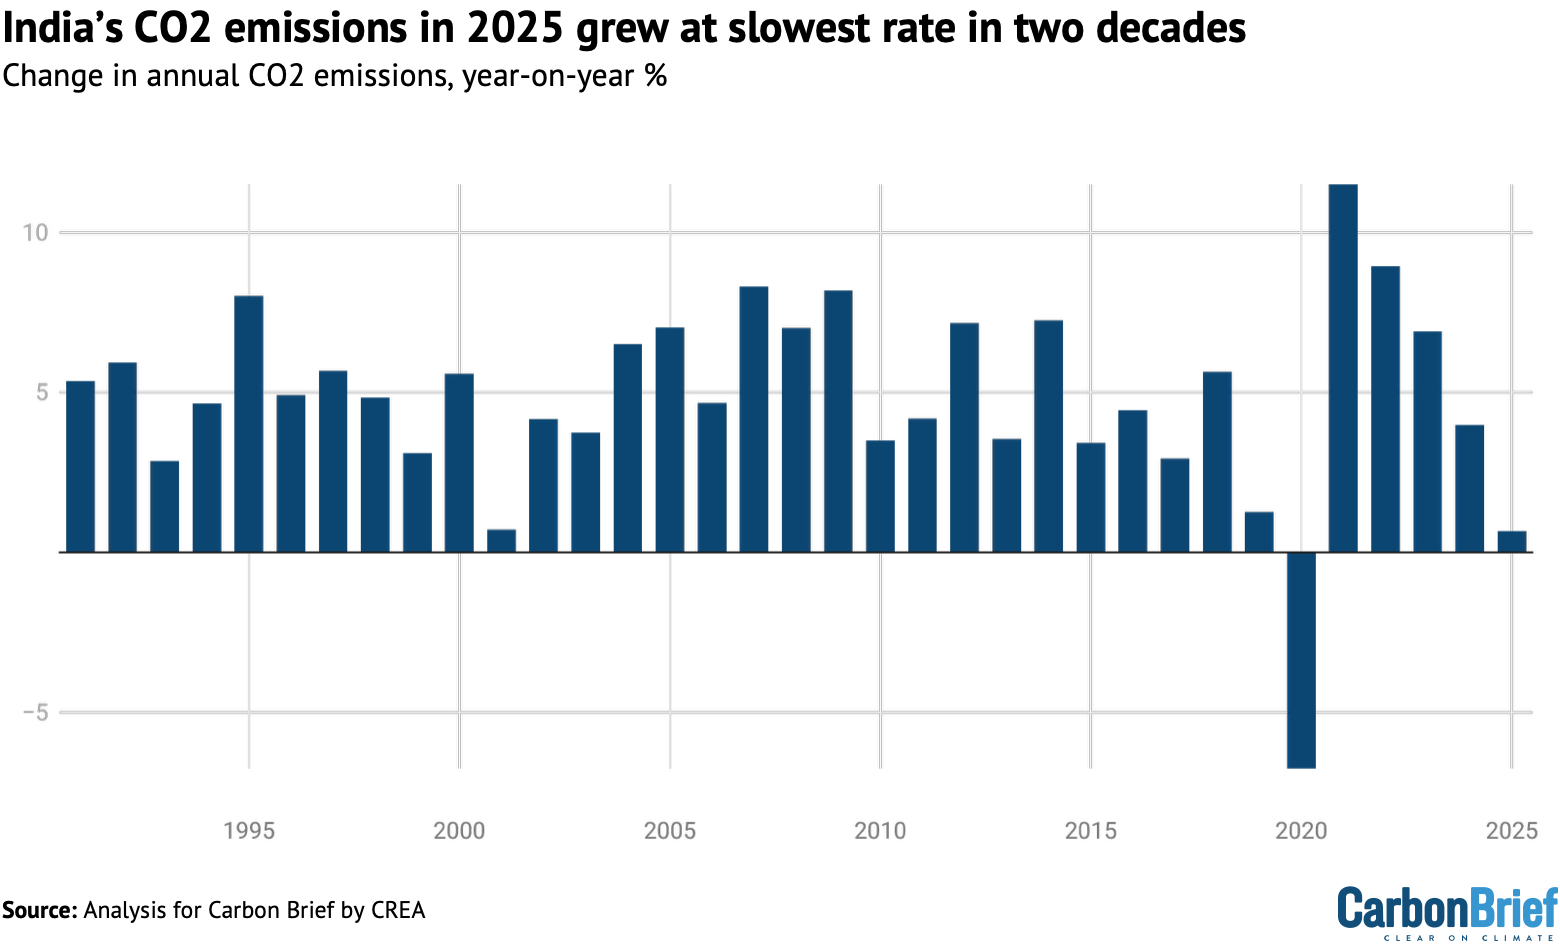
India’s carbon dioxide (CO2) emissions grew by 0.5% in the second half of 2025 and by just 0.7% in the year as a whole, the slowest rate in more than two decades.
This is a sharp slowdown from the growth of 4-11% in the preceding four years and marks the lowest rate of increase since 2001, excluding the impact of Covid in 2020.
This is the second in a new series of half-yearly analysis on India’s CO2 emissions from fossil fuels and cement, based on official data for fuel use, industrial production and power output.
Other key findings for 2025 as a whole include:
- Emissions in the power sector fell by 3.8% as record clean-energy growth combined with weak electricity demand.
- New clean-energy capacity in 2025 will add a record 90 terawatt hours (TWh) of electricity output each year, double the previous record set in 2024.
- The largest reductions in coal power were in the states leading on wind and solar.
- Oil demand grew by 0.4% and gas fell by 4%, far behind recent growth rates.
- Steel production surged by 8% and cement by 10%.
- In total, CO2 emissions went up slightly year-on-year, as increases from steel and cement outweighed the falls in gas demand and coal power.
- Consumption of imported coal at power plants fell by 20%, while gas imports fell by 6% and net oil imports were flat year-on-year, reducing India’s vulnerability to the impacts of the Iran war.
The analysis shows that India’s power sector is poised for a potential inflection point, where clean-energy additions can meet or exceed the growth in electricity demand.
If clean energy matches expectations, allowing this inflection point to take place, then coal-fired power output and the associated CO2 emissions would see sustained falls.
In addition, oil demand is falling in the petrochemical industry and is expected to slow down in the steel and cement sectors.
Despite these trends, which could signal a lasting slowdown in emissions, India is planning major expansions in its capacity for coal power, petrochemicals and coal-based steel.
The country’s Paris Agreement targets for 2035, which were published yesterday, did not reflect the potential for slower emissions increases or continued clean-energy growth.
The path of India’s CO2 emissions over the coming years depends on how it resolves these apparent contradictions regarding its future demand for fossil fuels.
Slowest growth since 2001
India’s CO2 emissions have been growing rapidly for decades, with annual increases averaging 4.9% per year since 1990 and 4-11% during 2021-24.
However, the recent pace of growth has been slowing down, as shown in the figure below. The 0.7% rise in 2025 was the slowest since 2001, excluding the impact of Covid in 2020.
Beneath the overall rise of just 0.7% in 2025, there were divergent trends in India’s key emitting sectors, with some seeing rapid rises in CO2 and others in historic decline.
This is shown in the figure below, which compares year-on-year changes in emissions during the first and second half of 2025 with the average for 2021-23.
Specifically, emissions fell by 3.8% year-on-year in the power sector, after the first drop in coal-power generation – outside Covid – since 1973. Oil products were more or less flat.
The small increase in 2025 overall was the result of strong growth from steel and cement.
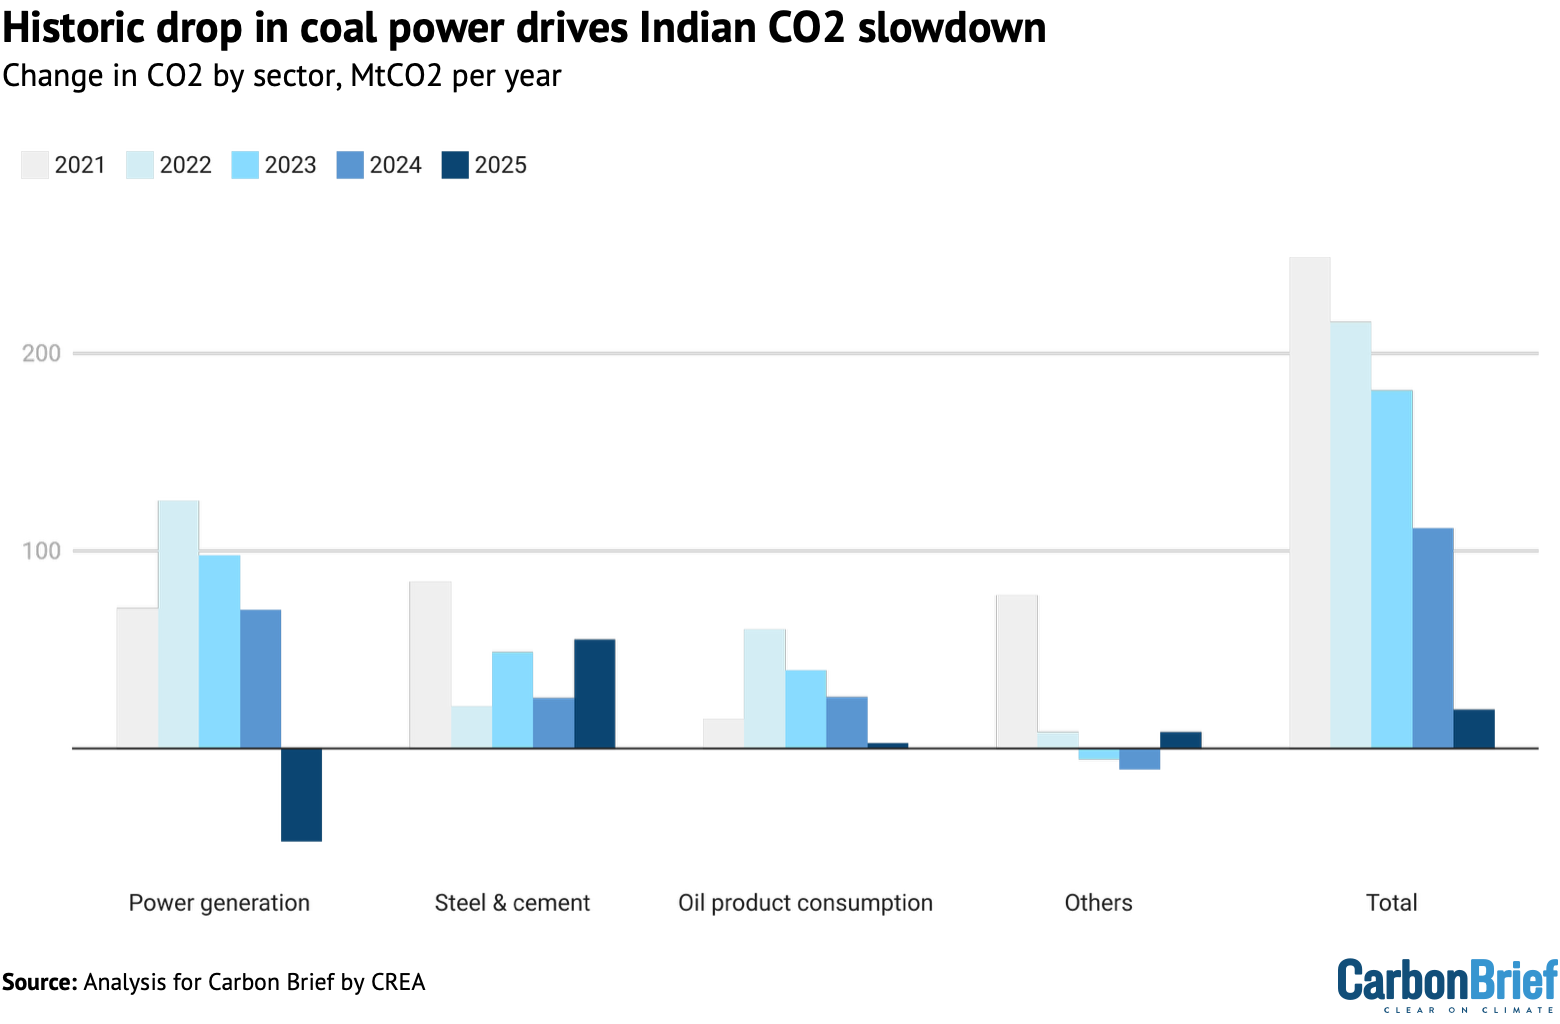
The fall in power-sector emissions is particularly notable, given it was the largest driver of emissions increases in 2021-2023, responsible for half of the total growth.
Across the sectors, the reductions and weak growth in fossil-fuel consumption eased India’s vulnerability to the recent price and supply disruptions taking place in the wake of the attacks on Iran by the US and Israel, as well as Iran’s subsequent retaliation.
Notably, India’s fossil-fuel imports were disproportionately affected by falling demand overall. For example, consumption of imported coal at power plants fell by 20% in 2025.
(Coal imports continued to fall in early 2026. However, the government is reported to be considering the use of an emergency clause that “would force coal power plants that run on imported coal to maximise output ahead of the summer season”, due to the impact of the Iran war on gas supplies.)
According to data from consultancy Kpler, gas imports fell 6% and net oil imports were flat, for the first time since the Covid-induced drop in 2020. The only rise in imports was of coal for steelmaking, which were up by 11% year-on-year in 2025.
Record clean-power growth
There were two key reasons why emissions fell in India’s power sector in 2025.
First, the country added 38 gigawatts (GW) of solar, 6.3GW of wind, 4.0GW of hydropower and 0.6GW of nuclear power in 2025.
The annual electricity generation from this new capacity, calculated based on the average capacity utilisation of each technology, amounts to 90 terawatt hours (TWh). This is twice as much as the clean generation added in 2024, which in itself was a record.
Power generation from solar grew by 30TWh and from wind by 20TWh in 2025, exceeding the 18TWh increase in total output. Hydropower also performed strongly due to high rainfall and capacity additions, with generation growing 21TWh.
Second, growth in total power demand slowed down from 7.4% in 2019-23 to 1% in 2025, which obviously played a major role in the fall in power-sector emissions.
The slow growth was due to both weather – with milder temperatures after 2024 heatwaves reducing the demand for air conditioning – and a more sustained slowdown in demand that had already started in late 2023 and was initially masked by the heatwaves. This slowdown in electricity demand is related to slower growth in industrial output and GDP.
Notably, the increase in clean-power generation from newly added capacity in 2025 was sufficient to cover demand growth of up to 5%. This means that power-sector emissions growth would have slowed down sharply, even if demand had not been flagging.
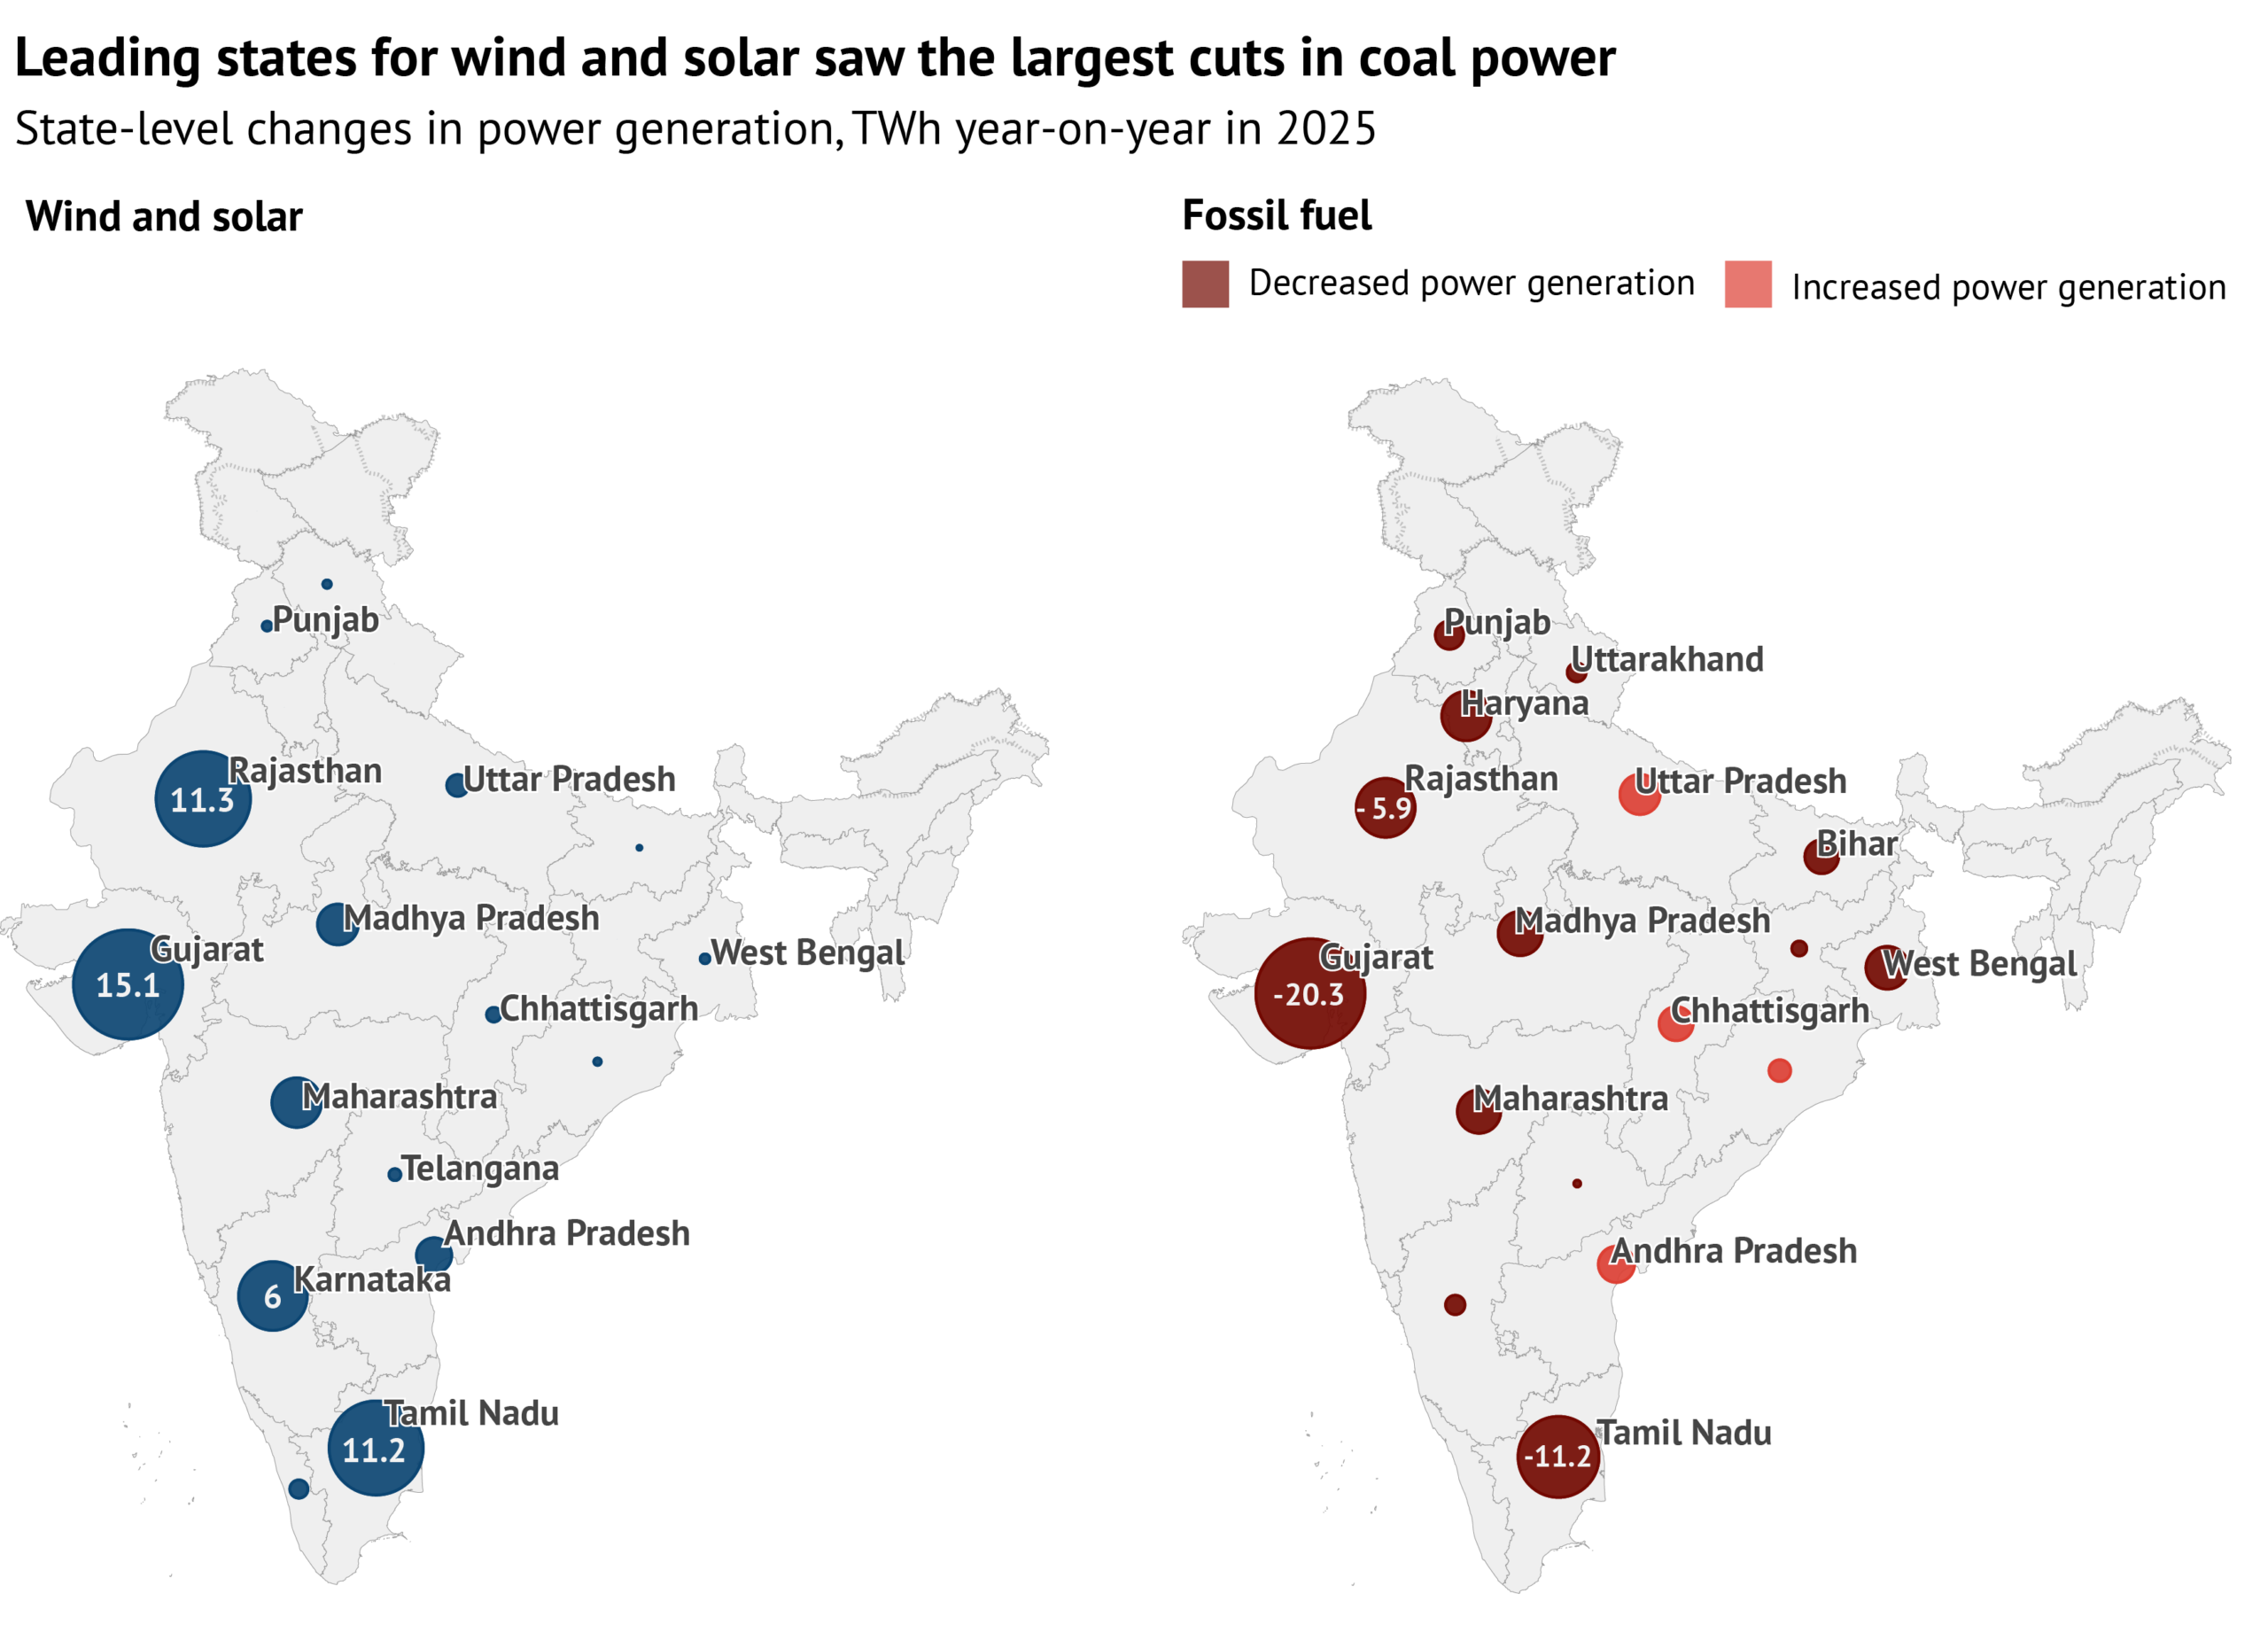
State-level analysis, shown in the figure below, emphasises the role of clean-energy growth in reducing fossil-powered generation.
The largest reductions in coal-fired power generation took place in Gujarat, Tamil Nadu and Rajasthan, the three states that also led the buildout of new solar and wind power.
Power demand is expected to pick up again, with Indian credit-rating agency ICRA projecting growth of 5.0-5.5% in the financial year starting in April 2026.
However, expected clean-energy additions should cover this level of growth.
BloombergNEF projects a 6% year-on-year increase in installed solar capacity in 2026. The government expects wind power capacity to reach 63GW by March 2027, a 10GW increase compared with the end of 2025, indicating a further acceleration of capacity additions compared with the 6GW added in 2025.
Indian utilities are also targeting the completion of construction on 6.8GW of new hydropower capacity, excluding pumped storage, and 1GW of nuclear capacity in 2026.
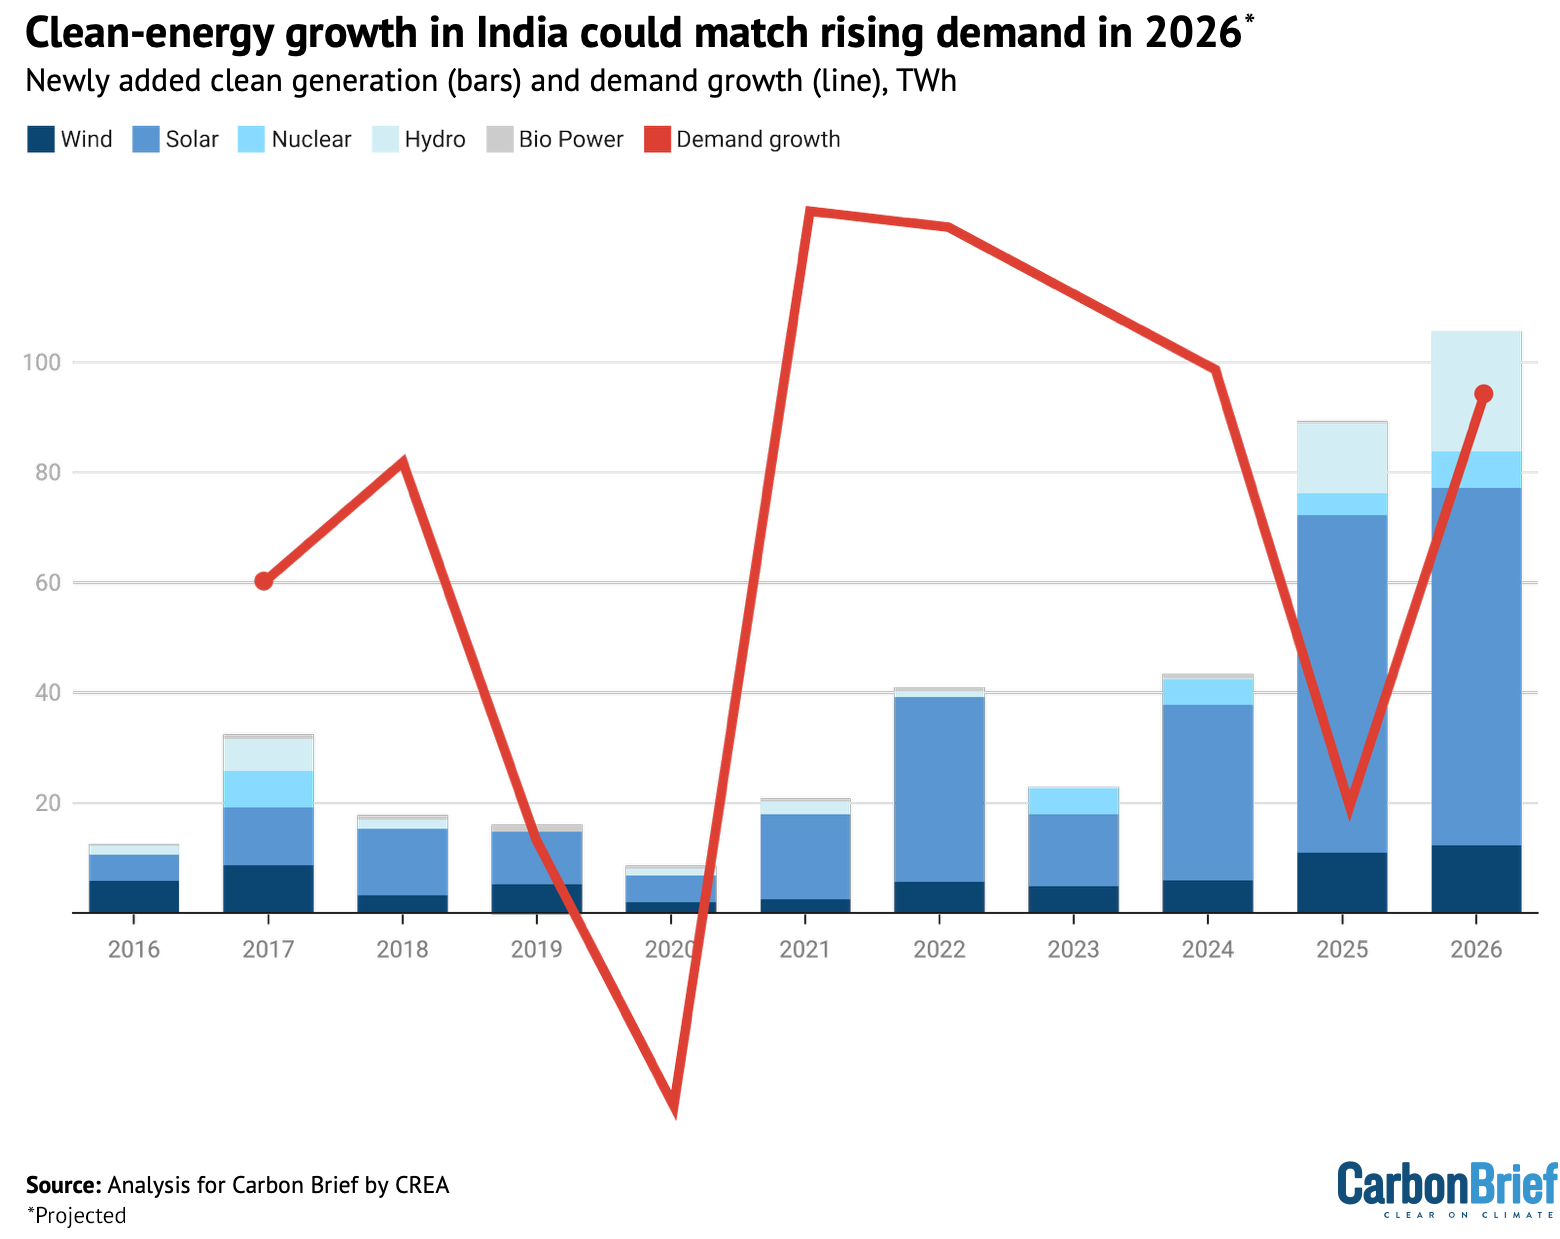
These capacity additions would deliver additional annual generation of more than 100TWh, enough to cover demand growth of up to 5.8%.
This means that India’s power sector could reach an inflection point this year, where clean-energy growth matches the expected average rise in demand, as shown below.
Over the next five years, ICRA forecasts annual average demand growth of 6.0 to 6.5%.
Yet India is also targeting 500GW non-fossil power generation capacity by the financial year 2029-2030. If achieved, this target would increase non-fossil power generation by enough to cover electricity demand growth of 6.6%, without needing to increase fossil-fuel generation, based on the Central Electricity Authority’s projected power generation.
If the actual growth rate for power demand is lower than this and if the non-fossil capacity target is still reached, then fossil-power generation – and the associated CO2 emissions – would fall in absolute terms from 2025 to financial year 2029-2030.
Battery energy storage is also increasingly affordable and will reduce the need for thermal power capacity in the system.
Oil slows on falling industrial demand
For oil demand, which slowed from 3.9% growth in 2024 to 0.4% in 2025, the key drivers came in the petrochemical and cement industry, where demand fell.
Specifically, demand fell for naphtha, petcoke and other oil products. Naphtha is used as chemical industry feedstock, while petcoke is used mainly in cement production.
Part of the fall in demand was due to an increase in India’s imports of plastics and precursors, which rose by 7% in volume terms, while exports fell.
The increase in imports came almost entirely from China, where the petrochemical industry is expanding, leading to complaints in India of price dumping. Mirroring the shift of plastics production to China, India began exporting large volumes of naphtha to the country.
India’s imports of nitrogen fertilisers also increased sharply, with most of the increase coming from China and Russia, while domestic production fell by 6% in April-September. Fertiliser production is the second-most important use of naphtha.
Petcoke use in cement production fell slightly, by 1%, even as cement production surged, as producers shifted to using more domestic coal in response to rising petcoke prices.
In the transport sector, petrol and diesel growth moderated in 2025, as the slow rebound to the pre-Covid trend in demand had finally played out. In addition, mobility was reduced in 2025 due to heavy monsoon rains in June to August.
Meanwhile, compressed natural gas (CNG) and electric vehicles also cut into the markets for passenger cars and light commercial vehicles, eating into petrol and diesel demand, respectively. EV sales grew 16% in 2025 and made up 8% of auto sales, helped by a reduction in the goods and services tax (GST) on EVs from 12% to 5%.
GST reform also reduced diesel consumption in a more surprising way, by eliminating the need for manual inspection of cargoes and cutting long wait-times at interstate border posts.
Diesel demand growth was also moderated by a government scheme to replace diesel irrigation pumps, which consume 5% of all diesel in the country, with solar-powered models.
Air pollution rules also played a role in some cities, including the capital Delhi. There, regulations on diesel vehicles resulted in a 13% reduction in sales from a year earlier, continuing the trend observed over the past two years.
Experts attribute lower sales of diesel vehicles to changes in consumer behaviour, following the long-standing ban on diesel vehicles older than 10 years and petrol models of more than 15 years in the wider Delhi National Capital Region (NCR), as well as a Supreme Court order in August 2025 that stressed the need for vehicles to comply with newer emissions rules.
Finally, aviation fuel demand growth slowed from 10% in 2024 to 3% in 2025, as the return to the pre-Covid trend in rising traffic leveled off.
The most immediate effect of the oil and gas crisis caused by the blockade of the Strait of Hormuz has been on the supply of liquified petroleum gas (LPG), which in India is used almost solely as cooking fuel.
Shortages have affected households, restaurants and industries. LPG consumption had grown by 6% year-on-year in 2025, in line with the longer-term trend, but is responsible for only 3% India’s CO2 emissions.
The crisis has reportedly also prompted a shift to cooking with electricity, with the sales of induction stoves reportedly surging.
Steel and cement continue to surge
The overall rise in India’s emissions in 2025 was driven by strong growth in output for steel and cement, which went up by 8% and 10%, respectively. The two sectors were responsible for 21% of India’s total CO2 emissions from fossil fuels and industrial processes in 2025.
India’s steel sector is more polluting than elsewhere, with the CO2 per unit of production – its emissions intensity – being more than 20% higher than the global average.
Two-thirds of steel is used for construction. Strong steel demand in 2025 reflected growth in new housing construction in earlier years, as the market was rebounding from the mid-2010s crash and the Covid pandemic. However, new project launches and sales both declined in 2025.
Domestic steel output growth was attenuated in the first half of the year by increases in steel imports from China, Japan and South Korea. This resulted in the government enacting a temporary blanket tariff in April 2025 for 200 days to curb imports.
As a result, steel output growth accelerated from 6% in January to May to 10% in the rest of the year. In November 2025, when the earlier temporary tariff expired, the government imposed new tariffs on a more targeted list of countries.
It imposed a three-year step-down tariff – 12% in the first year, 11.5% in year two and 11% in year three – to curb imports from China, Vietnam and Nepal, as these countries were found to exceed the thresholds for imports for various steel products.
In spite of the tariffs, the industry is struggling with weak profitability. Output growth has “led to a situation of oversupply”, according to ICRA, resulting in falling profitability and capacity utilisation, particularly at smaller mills, which account for 41% of total steel production.
Delays in construction and infrastructure projects are also weighing down on India’s steel demand, leading to rising inventories and falling prices. This is likely to affect the demand for steel, cement and bitumen in 2026.
Meanwhile, government initiatives could encourage a shift in the type and emissions intensity of steel production. State-backed schemes – particularly programmes to build affordable urban and rural housing – are significant steel demand drivers.
The Ministry of Steel is working on mandates for “green steel” in public procurement as part of a broader Green Steel Mission aimed at decarbonising the sector.
The policy is expected to require government agencies and publicly funded projects to buy lower-emission steel, creating demand for greener production.
Power could be nearing an inflection point
The sharp slowdown in India’s overall CO2 emissions growth has now lasted 18 months, making it increasingly likely that it is not just a blip.
Electricity demand growth slowed down sharply in 2025, which could be taken to imply that the lower growth in CO2 last year was mainly down to fluctuations in power demand.
However, clean-energy growth in 2025 was large enough to have stabilised emissions in the power sector, even if demand growth had been at historical rates.
Now, power-sector emissions could be about to reach an inflection point, with clean-energy additions projected to overtake average rate of electricity demand growth in 2026, for the first time. This already happened in 2025 in Gujarat, Rajasthan and Tamil Nadu, the highly populated states leading solar and wind development.
If clean-energy growth rates continue and if demand growth stays at expected levels, then clean energy will cover all of the growth in electricity demand. This would mean that electricity generation from fossil fuels would level off or decline.
Given that the power sector was the largest driver of emissions increases in 2021-2023, peaking coal-fired power generation and emissions from the sector would have a major impact on India’s overall fossil-fuel consumption and emissions.
The other significant emitting sector where emissions have been falling in India is the petrochemical industry.
In contrast, the steel industry has continued to increase output, even though it is struggling with profitability and concerns about overcapacity, while demand for steel and cement is expected to cool down this year due to lower growth in construction volumes.
Despite these trends, the country is planning for a major expansion of all of these industries. The government plans to add 85GW of new coal-fired power capacity over the next seven years. The country is also targeting $1tn of investment in the petrochemical industry by 2040, a 50% increase in steel production capacity from 2025 to 2031 and a 25% increase in cement production capacity in the three years from 2026 to 2028.
The planned investment in steelmaking is overwhelmingly coal-based capacity. This will increase the sector’s reliance on metallurgical coal, which is almost entirely imported, as well as running against government ambitions to increase lower-carbon steelmaking.
India’s Cabinet approved new 2035 climate pledges for the country yesterday. The targets are a reduction in carbon intensity – the emissions per unit of GDP – of 47% from 2005 level by 2035 and a non-fossil energy share of 60% in power generation capacity.
The 60% target would already be achieved by 2030, under the Central Electricity Authority’s recent projections. The carbon-intensity target would allow the country’s CO2 emissions growth to accelerate in the next 10 years, compared with the preceding decade, even as the recent clean-energy growth suggests that a substantial slowdown is possible.
If GDP growth averages 7.8%, the rate needed to meet India’s 2047 economic goals, then CO2 emissions could increase at 6% per year from 2025 to 2035 while still meeting the carbon-intensity target, compared with less than 4% growth from 2015 to 2025.
India’s energy and emissions trajectory over the next 5-10 years will depend heavily on how these apparent contradictions are resolved. This is particularly true in the power sector, where clean energy and storage are already set to cover future growth.
About the data
This analysis is based on official monthly data for fuel consumption, industrial production and power generation from different ministries and government institutes.
Coal consumption in thermal power plants is taken from the monthly reports downloaded from the National Power Portal of the Ministry of Power. The data is compiled for the period January 2019 until June 2025. Power generation and capacity by technology and fuel on a monthly basis are sourced from the NITI data portal.
Coal use at steel and cement plants, as well as process emissions from cement production, are estimated using production indices from the index of eight core industries released monthly by the Office of Economic Adviser, assuming that changes in total fossil fuel use follow production volumes.
These production indices were used to scale fuel use by the sectors in 2022. To form a basis for using the indices, monthly coal consumption data for 2022 was constructed for the sectors using the annual total coal and petcoke consumption reported in IEA World Energy Balances and monthly production data in a paper by Robbie Andrew, on monthly CO2 emission accounting for India. Monthly petcoke consumption was available from the Petroleum Planning and Analysis Cell, and coal consumption by the cement industry was calculated by subtracting petcoke use from total fossil fuel use.
Annual cement process emissions up to 2024 were also taken from Robbie Andrew’s work and scaled using the production indices. This approach better approximated changes in energy use and emissions reported in the IEA World Energy Balances, than did the amounts of coal reported to have been dispatched to the sectors, showing that production volumes are the dominant driver of short-term changes in emissions.
For other sectors, including aluminium, auto, chemical and petrochemical, paper and plywood, pharmaceutical, graphite electrode, sugar, textile, mining, traders and others, coal consumption is estimated based on data on despatch of domestic and imported coal to end users from statistical reports and monthly reports by the Ministry of Coal, as consumption data is not available.
Coal consumption by “captive” coal power plants – those supplying power to industrial sites, not to the public electricity network – was calculated based on capacity changes from Global Energy Monitor, assuming constant utilisation, as utilisation has been very stable year-to-year, as calculated from Central Electricity Authority data.
The difference between coal consumption and dispatch is stock changes, which are estimated by assuming that the changes in the amount of coal stored at end user facilities mirror those at coal mines, with end user inventories excluding power, steel and cement assumed to be 70% of those at coal mines, based on comparisons between our data and the IEA World Energy Balances.
Stock changes at mines are estimated as the difference between production at and dispatch from coal mines, as reported by the Ministry of Coal.
Coal consumption is estimated in two ways, for sectors beyond power, steel and cement. Consumption of domestic coal in these other sectors is taken from the monthly reports by the Ministry of Coal. Their consumption of imported coal is estimated from the total imports of thermal coal reported by consultancy Kpler, by subtracting demand for imports at coal-power plants. The basis for this assumption is that steel and cement industries use little imported thermal coal, according to Ministry of Coal data.
Product-by-product consumption data for petroleum products, as well as gas use by sector, is from the Petroleum Planning and Analysis Cell of the Ministry of Petroleum and Natural Gas.
As the fuel dispatch and consumption data is reported as physical volumes – such as tonnes or litres – calorific values are taken from IEA’s World Energy Balance and CO2 emission factors from 2006 IPCC Guidelines for National Greenhouse Gas Inventories.
Calorific values are assigned separately to different fuel types, including domestic and imported coal, anthracite and coke, as well as to petrol, diesel and several other oil products.



The post Analysis: India’s CO2 emissions in 2025 grew at slowest rate in two decades appeared first on Carbon Brief.
Analysis: India’s CO2 emissions in 2025 grew at slowest rate in two decades

Three countries have been named by the Paris Agreement’s compliance committee for failing to submit a nationally determined contribution (NDC) and repeatedly snubbing offers of help with their climate plans.
After months of internal debate over whether to identify serial non-responders, the Paris Agreement’s Implementation and Compliance Committee (PAICC) named the three countries which have failed to engage with it over their NDCs on Friday.
It named Democratic Republic of Congo, Senegal and North Korea in a footnote of its annual report, adding that it decided to name them “with a view to facilitating engagement”, adding that representatives of the three nations had been invited to its meeting in early 2027 “with the purpose of identifying any challenges and constraints”.
“The Committee noted the importance of Parties engaging with the Committee in a timely manner, while noting that some delays may be due to the national capabilities and circumstances of the Parties”, the report said.
-
Under US pressure, World Bank says it will back gas “where appropriate”
The US wants the World Bank to expand its gas support while climate campaigners are pushing for it to end – its head spoke this week of limited backing for the fossil fuel -
IPCC scientists vow to press on with climate reports despite political deadlock
After governments again failed to agree a timeline, nearly 120 IPCC authors pledged to complete their assessment on time and with full scientific rigour