


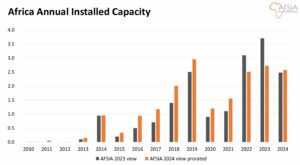
Africa is slowly stepping into the solar spotlight. According to the Africa Solar Industry Association (AFSIA) in 2024, the continent added 2.5 GW of new capacity, taking the total installed solar to 19.2 GWp. Yet, even with this growth, the divide between Africa and the rest of the world is still widening.
For decades, solar power has played a critical role across Africa—lighting rural homes, powering water pumps, running mini-grids, and keeping hospitals connected. Now, momentum is shifting from small-scale use to large-scale adoption. The question is no longer whether solar will expand, but how fast and how broadly it will spread.
China’s Solar Exports Drive Africa’s Growth
The clearest signal of Africa’s solar rise comes not from domestic capacity figures but from trade flows. According to new research, “The first evidence of a take-off in solar in Africa” by energy think tank Ember, in the 12 months ending June 2025, Africa imported 15,032 MW of solar panels from China—a 60% jump from the previous year.
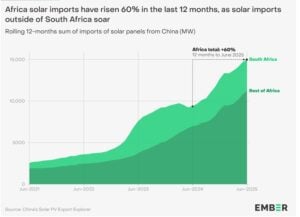
Notably, over the past two years, imports outside South Africa have nearly tripled, soaring from 3,734 MW in 2023 to 11,248 MW in 2025. This marks a structural shift: solar demand is no longer concentrated in a handful of markets but is spreading across the continent.
-
20 countries set new import records in the last year.
-
25 countries imported at least 100 MW, up from 15 the year before.
-
Countries such as Algeria, Zambia, Botswana, and Sudan experienced explosive growth, with imports increasing several times over.
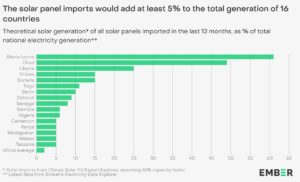
For countries with fragile electricity systems, the implications are enormous. In Sierra Leone, the panels imported in 2024 alone could supply 61% of the nation’s total 2023 electricity generation. In Chad, they could deliver nearly half of the annual demand.
Economics Now Favor Solar Over Diesel
The case for solar in Africa is no longer just environmental—it’s economic. Heavy reliance on diesel imports has left many countries vulnerable to price shocks and soaring fuel bills. Solar is fast becoming the cheaper, more resilient option.
In Nigeria, savings from avoiding diesel imports can pay off the cost of a solar panel in just six months. In several other countries, the payback is even quicker.
Despite the surge in solar imports, fossil fuels still dominate trade balances. In nine of the top ten solar panel importers, the value of imported refined petroleum outweighed solar panels by 30 to 107 times. This mismatch highlights the scale of opportunity: replacing even a fraction of fossil fuel imports with solar would transform energy security and economic resilience across Africa.
Installed Solar Capacity and The Concentration Challenge
While imports are spreading across the continent, installed capacity remains heavily concentrated. AFSIA says that of the 2.5 GW installed in 2024, a staggering 78% came from just two countries—South Africa and Egypt.
-
South Africa accounted for 50%.
-
Egypt added 29%, almost all from two mega-projects in Kom Ombo.
The dominance of these two nations reflects both their stronger policy frameworks and their ability to attract international finance. But it also underscores a challenge: outside of a few hotspots, large-scale solar development is still slow to take root.
Encouragingly, 2025 could change that narrative. A pipeline of landmark projects is now under construction in countries that have not traditionally led the solar charge. If delivered, these could shift the balance of Africa’s solar map in the coming years.
Utility-Scale Solar Makes a Comeback
After two years where commercial and industrial (C&I) projects led the way, utility-scale solar rebounded strongly in 2024, representing 72% of all new capacity.
This resurgence was powered by large, donor-backed projects, often financed by development finance institutions (DFIs) and built by international developers. National utilities, supported by governments, remain the primary off-takers.
Still, the C&I segment is far from disappearing. In South Africa, C&I accounted for 39% of new solar capacity, driven by both small embedded projects and larger wheeling initiatives that bypass strained grids.
By contrast, in Nigeria, weak transmission infrastructure makes utility-scale projects harder to sustain. Instead, C&I, residential rooftop systems, and mini-grids dominate the solar mix, with private companies and communities driving the transition from below.
Still China Remains Africa’s Solar Lifeline…
Africa’s solar boom would not be possible without China. In 2024, China produced 80% of the world’s solar panels and remains by far the largest exporter. Africa’s dependence on imports is heavy because local manufacturing capacity is still minimal.
-
Morocco has doubled its annual production to 1 GW.
-
South Africa maintains a similar capacity.
-
Egypt and Nigeria host small manufacturing lines, but volumes are limited.
Larger projects are in the works. Egypt will soon add significant capacity through EliTe Solar (3 GW in 2025), Sunrev Solar (2 GW in 2026), and a Masdar plant (4 GW, start date unannounced). These projects could eventually reduce Africa’s reliance on imports, but until then, Chinese exports remain the backbone of growth.
Solar’s Ripple Effects Across Economies
The Ember report further highlights that in 16 African countries, the solar panels imported in just one year could boost electricity generation by more than 5%. That is a game-changer for economies plagued by power shortages.
The shift also has profound fiscal consequences. Every dollar spent on solar reduces exposure to volatile global fuel prices, strengthens local currencies, and frees up budgets for critical investments in health, education, and infrastructure.
At a household and business level, distributed solar is breaking new ground. From small rooftop panels to mini-grids, decentralized systems are enabling energy access where traditional utilities have failed. For rural communities, that means lights in schools, refrigeration in clinics, and power for small businesses—building blocks for broader economic growth.
Is Africa’s Solar at a Crossroads?
The surge in imports shows that solar is no longer a niche or donor-driven sector in Africa. Instead, it is becoming a mainstream energy choice. The question now is whether governments can harness this momentum, ensure fair distribution, and scale up both infrastructure and financing to meet demand.
The risk is that growth remains uneven. If capacity stays concentrated in just a few countries, much of Africa could remain locked into fossil fuel dependence, missing out on the economic and social benefits of clean power.
But the opportunity is vast. With costs falling, technology advancing, and local manufacturing beginning to scale, Africa could leapfrog into a solar-powered future faster than many expect.
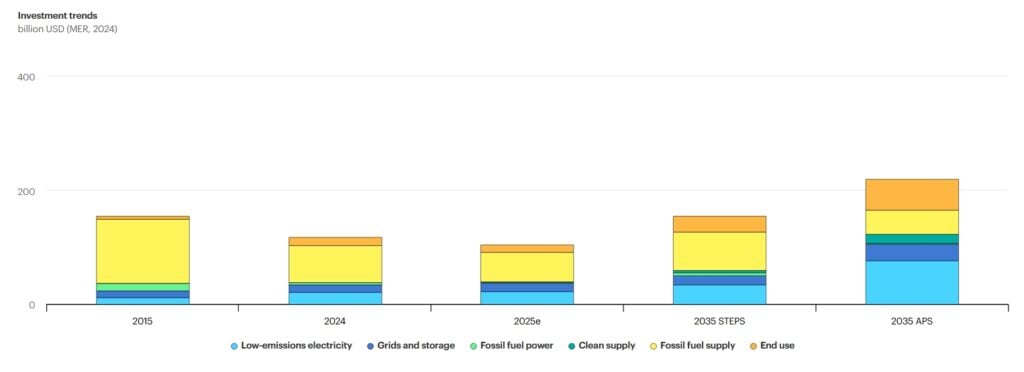
Yet, despite more than ~20 GW of installed capacity, the region still trails far behind the global curve. Concentration in South Africa and Egypt highlights both progress and fragility. To close the gap, policymakers must support broader adoption, attract investment beyond the usual markets, and accelerate local manufacturing.
If that happens, Africa’s energy future could change a lot. It might move from relying on expensive fossil fuels to a solar-driven system. This new system could provide power, stability, and growth all over the continent.
The post Africa’s Solar Imports from China Surge 60% in 2025, Pushing Clean Energy Goals appeared first on Carbon Credits.

I composed this essay over much of 2026, as I was writing Beyond Vogtle — my detailed study (co-authored with James Boucher) of U.S. nuclear costs from the 1980s post-Three Mile Island reactors to the Vogtle 3 and 4 units completed earlier in this decade. It traces my journey from nuclear power doubter to proponent.
My story is both general and personal: what was changing in the wide world of nuclear power, energy policy and climate; and how I viewed those changes. I hope this mode of story-telling resonates with a wide audience and also provide a backdrop to “Beyond Vogtle.”
It’s in three parts.

Detail from 1979 rally poster. Full poster appears below.
The first installment begins at the big Washington rally called to mark the Three Mile Island reactor accident, and covers the recession of nuclear dread, the advent of virtually always-on reactor operation, and nuclear’s status as the least carbon-emitting energy supply technology.
Installment #2 begins with the failure (to date) of carbon tax advocacy — “A Climate Cure No One Wanted” — and continues with the closure of Indian Point and the concurrent slow dissolve of my dream that renewable energy could do it all.
The third and final installment begins with a slight detour in which I contrast the appalling human damage from automobility with nuclear power’s increasingly remote dangers, and then return to energy policy with a fresh way to regard nuclear power’s potential contribution to decarbonizing U.S. grids.
Thank for reading. Enjoy. And be sure to look at Beyond Vogtle: What History Tells Us About the Cost of New Nuclear (yes, that’s the full title).
— C.K.
* * * * * * * * *
I’m pro-nuclear power. Big time.
I don’t just want the U.S. to keep running its 95 extant reactors. I want us to build more. Lots more. Hundreds.
I’m not alone. Public opinion is shifting toward nuclear power. But I came to that conclusion after spending years arguing the other side. From the mid-1970s to the late 1980s, I published a raft of critical analyses that got a good deal of public attention ― and even some traction within the nuclear industry itself. My core argument was that the cost of building nuclear plants was rising much faster than the costs of competing sources of energy. The main driver, I said, was a cascade of safety-requirement changes triggered by widespread fears of reactor accidents.

Here’s the full poster.
That work earned me a speaking spot at the massive May 6, 1979 rally in Washington demanding a halt to reactor construction in the wake of the March 28 meltdown at Three Mile Island in Pennsylvania. In the weeks before the rally, my research was cited in hundreds of news stories. At the Capitol, I stood alongside consumer advocate Ralph Nader, the leading figure in the U.S. antinuke movement; actress Jane Fonda, whose new film, “The China Syndrome,” had eerily foretold the Three Mile Island meltdown; and folk-rock icon Jackson Browne. I told the cheering throng that nuclear power was finished.
Cost overruns and canceled reactor projects were putting billions of dollars on the line, and I spent much of the next decade in courtrooms all over the country, explaining patiently to utility regulators why investors, not customers, should bear those losses. I eventually moved on to other public policy work, sparking big-city bicycling and helping bring congestion pricing to New York. But I kept watching nuclear power and the broader energy landscape. Over time, what I saw led me to turn from skeptic to supporter. Here’s why, in eight parts.
1. Fear and Dread Recede
Ask 100 random people today what “TMI” means, and at least 90 will say “Too Much Information.” Maybe one will mention the 1979 accident at Three Mile Island.
That’s a real shift.
The 1970s were commercial nuclear power’s first decade, and the Three Mile Island accident brought it to a terrifying close. Sixty hours into the slow-unfolding crisis, as fears grew that a “hydrogen bubble” in the reactor might explode and rupture the containment dome, CBS Evening News anchor Walter Cronkite captured the nation’s dread: “The world has never known a day quite like today. It faced the considerable uncertainties and dangers of the worst nuclear power plant accident of the atomic age. And the horror tonight is that it could get much worse.”[1]
The stricken reactor was eventually stabilized. But a combination of soaring costs and public apprehension brought an end to nuclear power’s rapid expansion in the United States.
Cronkite’s warning was about Three Mile Island itself, but it seemed to foreshadow more disasters to come. Yet since 1979, the U.S. nuclear industry has accumulated nearly 20 times as much reactor operating experience as it had built up in its entire history before the meltdown, without a sequel.[2] Like the dog that didn’t bark, this quiet fadeout of reactor calamities is an overlooked shift ― and it is prompting a rethink of long-held certitudes about nuclear power.
With each passing year there are fewer people who grew up with dread from Cold War-era A-bomb drills and weapons test fallout that got bundled into nuclear power. There are more young people like Zeke, a Brooklyn high-schooler who in 2019 went to Battery Park City to greet climate activist Greta Thunberg after her sail-powered trans-Atlantic voyage, but who this past May called fears about nuclear power “over-exaggerated.”[3] (Thunberg herself has said that Germany made a mistake by phasing out its nuclear plants, since it led to a sharp rise in coal-fired electricity.)
I’ve heard the same sentiment in hundreds of casual conversations over the past decade ― at climate rallies and on Trader Joe’s checkout lines, in California and in New York. These conversations suggest that the oppositional currents that once compelled federal nuclear regulators to keep piling on costly new safety requirements are losing force.
2. Permanent Peak Performance
Even before construction costs began to soar in the 1970s, nuclear power had another Achilles heel: spotty operating performance.
Throughout the 1970s and 1980s, the U.S. nuclear power sector struggled to maintain even a 60 percent “capacity factor” ― a measure of how much of a plant’s potential output it generates. That’s a dismal rate for equipment that’s expensive to build. I know this because I researched and wrote the first full-length study of shortfalls in U.S. nuclear plant performance, in 1976.[4]
That started to change in the mid-1980s. Plants finished safety upgrades required after Three Mile Island. The industry began sharing best practices ― and mistakes to avoid. Economic incentives helped too, as utility earnings became tied to how often plants actually ran.
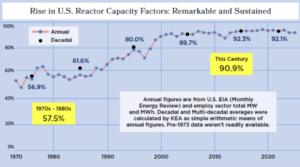
A remarkable turnaround, though seldom credited in climate and nuclear discourse.
The turnaround has been dramatic. Since 2000, U.S. nuclear plants have averaged 90 percent capacity factor ― a huge leap from the earlier 60 percent. In effect, downtime has dropped four-fold, from 40 percent of the time to just 10 percent. Repair jobs and retrofits that used to drag on are now precision-scheduled like the train heist in “Breaking Bad.”
The higher reliability brings a huge symbolic benefit. In the 1970s, U.S. reactors seemed to stumble from one fiasco to the next. In Alabama, a technician using a lit candle to locate an air leak started a fire that burned through a thousand cables and knocked two brand-new reactors offline for 19 months. At some ocean-cooled plants, saltwater corroded delicate heat-transfer tubes, forcing protracted repairs. Profits and industry morale took a beating, and nuclear power became a punchline on “The Simpsons.”
Those days are long past. Nuclear power, uniquely, has blossomed into both grid bulwark and climate hero. Thanks to those higher ― much higher! ― capacity factors, each nuclear plant now displaces 50 percent more carbon-emitting power generation than it used to.[5] In fact, at a 90 percent capacity factor, a kilowatt of nuclear power delivers double or triple the climate benefit of a kilowatt of wind power (which averages 30 to 40 percent capacity factor) and roughly five times that of solar (15 to 20 percent) ― a crucial distinction that’s often missing from gushing coverage of renewable energy.
3. Climate to the Fore
Nuclear power’s newfound operational mastery would matter much less but for the urgency of the climate crisis and the persistence of U.S. and global carbon emissions. Like wind and solar, nuclear power generates electricity without burning carbon.
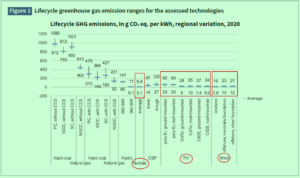
Squint to see that nuclear lifecycle greenhouse gas emissions range from 5.1 to 6.4 (in g CO2 equivalent per kWh); analogous range for solar-PV is 7.4 – 83.0; wind, 7.8 – 23.0. Source, Dinon et al., in report linked in this section’s second paragraph.
It is true that fossil fuels are implicated in nuclear power’s supply chain. Uranium mining uses petroleum, and enriching nuclear fuel requires electricity. But even counting upstream carbon, nuclear power’s climate footprint is smaller than that of wind, solar or hydropower, according to an authoritative 2022 analysis by a multinational team for the UN Economic Commission for Europe. (Their finding matched that of the similarly comprehensive 2018 report by the UN-chartered Intergovernmental Panel on Climate Change.[6])
That’s another big change. In nuclear power’s early years, uranium fuel enrichment was so energy-intensive that the three U.S. “gaseous diffusion” plants were said to consume 10 percent of all electricity used by American factories. But diffusion enrichment has given way to gas centrifuges and, more recently, laser isotopic separation ― methods that use 20 times less energy to isolate fissile U-235 from U-238.
The bottom line: kilowatt-hour for kilowatt-hour, nuclear-generated electricity is at least as effective as solar and wind at cutting climate pollution. Meanwhile, Hurricane Katrina, Superstorm Sandy, “heat domes” and wildfires, and, in August, the first Himalayan glacial collapse, have made once-hypothetical climate death and disruption a daily reality. More than rising electricity demand from A.I., it’s the climate crisis that’s driving renewed interest in nuclear power.
Click here for the second installment, Why I’m Pro-Nuke Now: Beginning.
[1] Quoted passage is from a local (PA) news site, though the an archived Channel 2 broadcast it cited is no longer on line.
[2] The sole “near-miss,” and a major one, was the 2002 discovery by operators at the Davis-Besse nuclear plant near Toledo, OH of extensive corrosion of the reactor vessel head — a vital barrier against loss of coolant and release of radiation. The U.S. General Accounting Office sternly rebuked the Nuclear Regulatory Commission for failing to identify and prevent the corrosion. See GAO, Nuclear Regulation: NRC Needs to More Aggressively and Comprehensively Resolve Issues Related to the Davis-Besse Nuclear Power Plant’s Shutdown, GAO-04-415, May 2004.
[3] In-person conversation at People’s Policy Conference at the New School for Social Research in New York, May 2, 2026.
[4] C. Komanoff, Power Plant Performance: Nuclear and Coal Capacity Factors and Economics (15 MB pdf), Council on Economic Priorities, 1976.
[5] Dividing today’s 90% uptime by the former 60% yields 1.50, indicating 50 percent more kilowatt-hours per kW.
[6] IPCC Annex III report, Technology-Specific Cost and Performance Parameters, 2018. See table on p. 1333.
This is the second part of a three-part post. It begins with the failure of carbon tax advocacy and continues with the closure of Indian Point and the concurrent dissolution of my dream that renewable energy could do it all. Part I, “Beginning,” started with the Three Mile Island accident and covered the decline of nuclear dread, the advent of splendidly reliable reactor operation, and nuclear’s climate-hero status. It’s available here. — C.K.
4. A Climate Cure No One Wanted
Nuclear fission, wind turbines, solar panels. Each is a kind of miracle, creating electricity from sunlight, air currents, or the splitting of atoms rather than by setting things on fire. But to economists focused on decarbonization, a greater miracle would have been the widespread adoption of carbon taxes, or, as some prefer to call it, a “price on carbon” — a fee added to fossil fuels’ market price based on their carbon content. Such a tax would shift incentives across the economy away from using fossil fuels, cutting production of the main greenhouse gas, carbon dioxide.
Economists trace the carbon tax idea to the early 20th century British economist Alfred Pigou and his conception of “externalities” ― social costs, like pollution, that aren’t reflected in market prices, and are dumped on communities “external to the process.” My interest dates to the early 1970s, when I was a fledgling environmental analyst in New York City government. I had a front-row seat as an ingenious “sulfur surcharge” eliminated the price advantage of dirty, high-sulfur fuel oil, foiling an eleventh-hour attempt by the oil industry to undercut a groundbreaking clean-air regulation.
Much later, in 2007, I co-founded the Carbon Tax Center, an organization built around the idea of taxing fossil fuels by their carbon content. We proposed a national carbon tax starting at $15 per ton of CO2 and rising in annual steps to $100 within a decade. Our modeling suggested that by then, the myriad changes driven by the financial rewards for burning less carbon would be cutting U.S. emissions by nearly a third ― far more than conventional energy-efficiency standards or clean-energy subsidies.
To be clear, this wasn’t an either-or choice. A carbon tax was unusual in that it reinforced nearly every other decarbonization measure rather than competing with it. But what really set carbon pricing apart was its reach. Carbon taxes would reward every action that reduced fuel use ― not just buying more fuel-efficient cars, but driving less overall; not just laws mandating energy-efficient buildings, but reforming zoning to let new homes be built in town instead of spreading into sprawl; and, in the power sector, switching from higher-carbon coal to lower-carbon gas and from gas to virtually zero-carbon solar, wind, and nuclear power.
A carbon tax would have worked something like New York’s congestion pricing program, which last year began charging drivers $9 a day to enter Manhattan south of 60th Street. Congestion pricing hits gridlock with a one-two punch. The first punch is the price itself: faced with the toll, enough car owners find driving no longer worth it, that traffic actually drops. The second punch is the steady stream of subway improvements funded from the toll revenue — station elevators, real-time train signals, new lines — which pull still more commuters out of cars. Just so, the “stick” of a price and the “carrot” of better alternatives reinforce each other.
I took part in the 20-year campaign that pushed congestion pricing across the finish line. Its advent — and survival — in Trump’s second term is heartening. But it also highlights, by contrast, how little headway has been made toward a U.S. carbon price.
That failure constitutes a tragically missed opportunity for nuclear power, given how much a $100-per-ton carbon price could strengthen its economics. Compared with burning natural gas, the dominant source of U.S. electricity today, a $100/ton CO2 price would give nuclear roughly the same competitive edge as shaving 40 percent off the cost to build new reactors. Or, put another way, that carbon price would be like doubling or tripling what gas-fired power plants pay for pipeline fuel — pushing prices back to pre-fracking scarcity levels.[7])
5. Losing Indian Point
In the spring of 2020, with the COVID-19 pandemic raging, my wife and I fled the city for our cabin in the Adirondacks. One morning I was outside the general store, loading groceries onto my bicycle, when my phone started buzzing. It was Dietmar Detering, someone I knew slightly as leader of the advocacy group Nuclear NY, calling from Queens. I picked up and said hello.
“You call yourself a climate activist,” Dietmar began, his voice sputtering with anger. “Indian Point is being taken apart, and you haven’t said a word to stop it. How dare you?”
 I vaguely knew that a 2017 deal ― pushed by the self-proclaimed environmental group Riverkeeper and brokered by then-Gov. Andrew Cuomo ― was about to shut down the Indian Point nuclear plant, located on the Hudson River 35 miles north of midtown Manhattan. The older of its two reactors unit would (literally) get the chop within a week; its twin would follow in a year. Both reactor vessels would be cut to pieces and their radioactive components chemically dissolved. Once that process began, there’d be no turning back.
I stood there holding my phone, stunned. A near-stranger was berating me! I would have hung up, but there was something raw in his voice that I couldn’t ignore. I don’t remember exactly what I said ― probably some version of “don’t blame me.” After all, the carbon tax I’d spent years advocating would have made Indian Point too valuable to shut down. Then I offered what I thought was my strongest point: soon enough, Indian Point’s carbon-free electricity would be replaced by zero-carbon wind and solar anyway, so little harm would be done.
Then Dietmar lowered the boom.
“You don’t get it, do you?,” he said, his voice now cold. “Even if all those new solar panels and wind turbines get built, they won’t displace fossil fuels. They’ll just be replacing carbon-free nuclear electricity that was already protecting the climate. They can’t do both.”
“Wait. What? Say that again.”
“Think of it this way,” Dietmar said. “When new renewables have to replace an existing power source that was already displacing fossil fuels, like Indian Point, their net climate benefit is zero. The renewables you’ve been counting on to push out fossil fuels can’t do that job as long as they’re having to take the place of nuclear plants that were already doing the decarbonizing.”
Full disclosure: those aren’t Dietmar’s exact words. They’re actually mine, drawn from articles I later wrote for Gotham Gazette and The Nation, and from a letter I co-wrote with futurist Stewart Brand, yes, the “Whole Earth Catalog” guy, urging California Gov. Gavin Newsom to halt the planned closure of the Diablo Canyon reactors along his state’s coast. But they capture Dietmar’s central point: shutting down a working nuclear power plant ― or any large source of carbon-free electricity ― nullifies the climate benefit that new replacement wind and solar projects are supposed to provide.
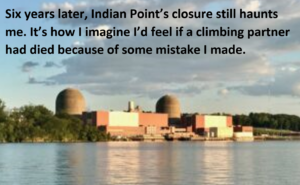
Six years later, Indian Point’s closure still haunts me. Why didn’t I speak up? It’s how I imagine I’d feel if a climbing partner had died because of some mistake I made. In New York, where I live, I measure every increment of renewable energy against the carbon benefit we threw away when Indian Point was shut down and dismantled.
 By that gauge, wind and solar look mediocre. Take those 42-inch square “balcony solar” arrays that Germans are buying like hotcakes ― they’re a neat idea, but it would take 50 million of them to match the carbon reduction Indian Point provided, as I wrote here in June. Or consider a rooftop solar setup for the City Island boathouse where my ecologically minded physicist pal stows his sailboat ― fine on its own, but matching Indian Point’s climate value would require solarizing 600,000 similar buildings across the state.[8]
Underneath these daunting numbers is Dietmar’s deeper point: all of this new renewable capacity should have been added on top of Indian Point, not built to replace it.
6. Renewables in a Dimmer Light
Solar and wind power were guiding passions of my adult life. From the 1970s onward, I savored every news story about the latest gains in solar efficiencies and blade lengths. Wind turbines especially stirred me, with their kinetic kinship to bicycles and futuristic look.
Befitting my mathematical bent, I would calculate how much fossil fuel each new wind farm would keep in the ground. For Cape Wind, intended as the first U.S. offshore wind farm, near Cape Cod, I consulted a digest of ballpark dimensions to illustrate how much coal the project would displace each year: enough to cover the entire playing field at Boston’s Fenway Park — foul territory included — in a pile three times the height of the park’s famed “Green Monster” outfield wall.[9]
While I was playing with those numbers, a Stanford mechanical engineering professor named Mark Z. Jacobson was launching a stream of papers spelling out just how many wind turbines and solar panels ― on land, at sea, on rooftops, on farmland or rangeland ― would be required to satisfy the energy needs of different states and countries.
A table in Jacobson’s paper for New York helpfully broke down how much energy had to come from each source. Offshore wind was his largest category, charged with supplying 40 percent of New York State’s energy year-round. The number of turbines: 12,700.
That figure should have given me pause. Filling that quota meant building a hundred Cape Wind projects in the waters off Long Island, even as well-heeled locals including Riverkeeper figurehead Robert F. Kennedy Jr. (yes, that Kennedy) and Walter Cronkite (yes, that Cronkite) were NIMBYing the actual Cape Wind project to death. Ditto, wind projects proposed for the next county over from our cabin in the Adirondacks.
None of those projects were ever built — not just because of local opposition, but also because of a lack of full-throated support from environmentalists who should have championed them for their climate value. Especially in liberal Northeastern states, it seemed impossible to build anything that asked property owners to tolerate construction disruption or changed views, decarbonization be damned.
You might expect the outlook for Jacobson’s all-renewables vision for New York to be improving. Wind turbines are now so prodigious that he can propose 8,000 15-gigawatt turbines instead of 12,700 5-gigawatt ones.[10] And solar power has captured the public’s imagination in a way wind power has not — it’s no accident that climate activist (and Jacobson acolyte) Bill McKibben titled his 2025 call-to-action book, “Here Comes The Sun.”
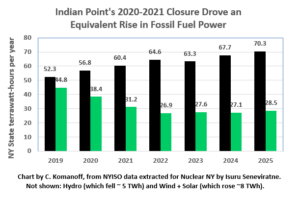
Nevertheless, the carbon-free electricity lost when Indian Point closed has gone almost entirely unreplaced. Nearly nine-tenths of the power it generated is being made up by burning natural gas — not due to corporate chicanery but because no other source has stepped up. (See chart below.)
And dreams of an all-renewables grid still have to contend with an intrinsic fault ― one even more disabling than the NIMBY opposition sparked by the projects’ thirst for land. That weakness is intermittency: the fact that wind and solar output varies not just day to day, but moment to moment, at the mercy of the weather.
Jacobson has doggedly calculated how many megawatt-hours of wind and solar would be needed to match New York’s ― and other states’ ― total annual energy use. But neither his nor anyone else’s atmospheric models are detailed enough, meteorologically, to verify that a 100% wind-water-solar grid could keep the power on continuously ― hour by hour, year in and year out. Building in extra capacity doesn’t solve this problem. Compensating for weather’s unpredictability by deliberately oversupplying wind and solar, or backing them up with batteries, may look good on paper. But either approach would be punishingly expensive and probably insufficient as well, without ample supplies of reliable, dispatchable power such as nuclear. If there’s no wind, having twice as many turbines won’t help.[11]
In New York, the political fallout from losing Indian Point’s copious ’round-the-clock carbon-free electricity is landing on Cuomo’s successor. With the plant’s closure having pushed New York’s carbon-reduction targets out of reach, Gov. Kathy Hochul this year bowed to reality and froze a 2019 law tying New York’s climate and energy future to renewables. Forces ranging from standard-issue Democrats to grassroots greens are pillorying Hochul as a sellout to Big Oil, though her proposal to add five large reactors across the state — she dubs it her Nuclear Reliability Backbone — is almost certainly a more assured path to decarbonization than the fashionable all-renewables approach.
Click here for the final installment, Why I’m Pro-Nuke Now: Conclusion.
[7] The two representations in the text of carbon pricing’s boost to new reactors’ economics are derived and sourced in my Sept. 2026 paper with James Boucher, Beyond Vogtle: What History Tells Us About the Cost of New Nuclear.
[8] Comparisons in this paragraph employ: 2,028 MW capacity and 90% capacity factor for Indian Point; 220 W capacity and 15% CF for balcony solar. 17 kW capacity and 20% CF for boathouse solar. 10 MW and 40% CF for each wind turbine.
[9] Cape Wind assumptions: 130 3.6-GW turbines and 40% capacity factor yield 1,641 GWh/year. Coal assumptions: 9,800 Btu/kWh, 11,500 Btu/lb of coal, 1.32 coal specific gravity, 62.4 lb of water per cubic foot. Calculations yield 132-foot-high coal pile covering Fenway Park’s 128,000 sq ft surface (est’d from http://www.baseball-statistics.com/Ballparks/Bos/index.htm). That is 3-4x Green Monster height of 37 feet, 2 inches, per Wikipedia.
[10] While Jacobson’s new offshore wind configuration would outproduce its predecessor by nearly two to one, he has also upped his forecast for total required energy, leaving constant offshore wind’s share 40 percent share.
[11] To take a recent example: at the onset of a late June – early July 2026 heat wave, New York State’s wind farms collectively were producing less than one percent of their rated 3,000-megawatt capacity. See my “Beyond Vogtle” report (FN 46) referenced in Footnote 7.
This concludes my three-part post. Part I, “Beginning,” began with the Three Mile Island accident and covered the decline of nuclear dread, the advent of fabulously reliable reactor operation, and nuclear power’s climate-hero status; it’s available here. Part II, “Centerpiece,” covered the failure of carbon tax advocacy, the closure of Indian Point, and the dissolution of my dream that renewable energy could do it all; it’s available here. This part takes antinuclear activism to task for turning a blind eye to the far more lethal harms from unrestrained automobility, and then turns to the need to redefine “least-cost” decision rules guiding electricity investment. — C.K.
7. A More-Brutal Bête Noire
On a different, but as I’ll show, related topic: I had known for some time that deaths from being struck by a motorist were shockingly common in the U.S., with 300 a year in New York City alone. I had made that fact a central element in defending bicycling against the moral panic over ― of all things ― New York’s industrious bicycle couriers during the pre-digital 1980s. And as a bicycle commuter I had long jousted with drivers. But the death of oncologist Dr. Jie Zhang in 1994 forced me to consider driver-caused traffic violence as an assault on both public health and the moral order.

The horrific death in 1994 of physician and expectant mother Jie Zhang called into question antinuclear dogma that prioritized hypothetical reactor accidents over lethal dangers like unrestrained automobility.
A speeding driver hit and killed Dr. Jie outside Memorial Sloan Kettering Cancer Center on Manhattan’s East Side. She was nine months pregnant. As she lay dying, her colleagues at the hospital delivered her son, who survived. The newspaper ran a photo of the newborn in his father’s arms. My wife and our week-old son were safe at home. My good fortune was hard to bear.
What were the hazards of nuclear power, next to those of motorized traffic? There was and is no agreed-upon damage ratio between the two technologies. But in my eyes, the anti-nukers’ derogatory depictions of U.S. nuclear regulators seemed better suited to officials in charge of “auto safety.” In 2009, for example, after a spate of deaths in SUV rollovers, the National Highway Traffic Safety Administration required that roofs on new vehicles be able to support three times their already swollen weight. That rule led to wider windshield-obstructing structural posts , badly expanding SUV drivers’ blind spots. The result, according to a recent New York Times report, was a tidal wave of crashes that killed hundreds of pedestrians and cyclists and injured thousands more.
As a young attorney in the 1960s, Ralph Nader rocketed to fame by documenting how regulatory capture made cars excessively dangerous. His subsequent pivot to opposing nuclear power initially made sense but, over time, inadvertently left American pedestrians, cyclists, and occupants of smaller vehicles vulnerable not just to “vehicle bloat” but driver distractions and the “windshield perspective” of police, prosecutors and juries.
All the while, anti-nuclear activists keep pounding their drum, willfully ignoring U.S. reactors’ splendid post-seventies safety record (see Sections 1 & 2). With few domestic miscues to flog, they leaned instead into the faraway disasters at Chernobyl (1986) and Fukushima (2011). Those disasters were real enough, but they differed from the U.S. situation not just in location but also in root cause. Soviet and Japanese officials had downplayed reactor risks, while the U.S. nuclear enterprise had built a culture dedicated to containing them.
Even reactor radioactivity, like reactor accidents, is becoming another non-barking dog. We are half-a-century into the age of large-scale deployment of nuclear power, and not a single large-scale study has emerged that credibly pins increased morbidity and/or mortality on nuclear power plant operation. Moreover, the old Rubik’s Cube problem of nuclear waste disposal is yielding to engineered solutions. The hangup was never technical. It was political.
8. By All Means, Decarbonize
For half-a-century, nuclear power and renewable energy have circled each other like wary prizefighters.
The two weren’t simply antithetical, they were incompatible — logistically as well as culturally. One couldn’t be for both; you had to pick a side. That was the gospel of physicist Amory Lovins, whose revolutionary 1976 article in Foreign Affairs magazine, “Energy Strategy: The Road Not Taken,” upended energy policy debates and galvanized the antinuclear power movement.[12]
In Lovins’ influential framing, nukes epitomized “hard” energy — lumbering and brittle. Renewables — wind and solar — were “soft” — home-grown and “right-sized.” (This was before the relentless push for engineering efficiencies turned wind turbines into colossi and blanketed entire fields with solar panels.)
Fifty years on, the climate crisis has entered the ring and demanded that the rivals partner up. The choice now is carbon-burning vs. carbon-free. Further, the perilous timeline of the crisis has toppled another dictum, also traceable to Lovins: that the transition from fossil fuels must proceed under a “least-cost-first” hierarchy that turns to costlier energy sources only after first exhausting all of the less-expensive ones.
Once, that logic was persuasive. In a leisurely, decades-long transition, why not have the lowest-cost energy lead the way? Wherever a home solar array or a Great Plains wind farm could turn a profit, the thousand busy ants of capitalism could be trusted to deploy them. The climate-warping curve would bend, steadily, painlessly, bringing a more flexible and benign energy system into the bargain.
That was the idea. The reality is falling far short, as revealed by the stubborn persistence of U.S. carbon emissions.[13] The manifold causes have been touched on here; they include everything from traditional NIMBYism to viral versions built on conspiracy-mongering, along with supersized pickups, “sport utes” and the absence of robust carbon emissions pricing. The shale revolution and two Trump presidencies did their part as well, keeping fossil fuels cheap (until No. 47 made war on Iran), which added to the stock of carbon in the atmosphere and America’s stock of carbon-consuming cities and towns, farms and roadways.
In World Cup parlance, we’ve entered stoppage time. A new rule applies: nuclear power ― or any other fossil-fuel antidote ― need not pencil out as cheaper than solar or wind to merit a part in decarbonizing U.S. grids. Instead, we should pursue any energy source or energy-saving measure that displaces fossil fuel use at lesser cost than the harm caused by burning those fuels in the first place.
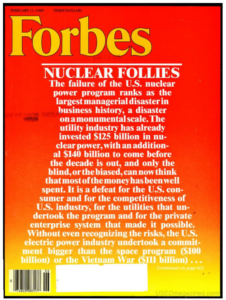
Feb. 11, 1985 cover.
Think of it like the hikers’ joke about the bear: I don’t need to outrun the bear, I just need to outrun you. In the same way, new nuclear plants don’t need to be cheaper per kilowatt-hour than solar or wind. Their electricity just needs to cost less than the added climate damage that would result from burning the fossil fuels that would otherwise fill the gap. And on that test, new nuclear power plants appear likely to succeed.
Let’s break that down.
What will new U.S. reactors cost to build?
This year I applied my statistical skills and power plant knowledge to the 49 most recently built U.S. reactors. Forty-seven of them limped to completion in the dozen years following Three Mile Island. At the time, their swollen costs so ravaged U.S. electric utilities that Forbes magazine termed the U.S. nuclear power program “the largest managerial disaster in business history.”
Nevertheless, my analysis of that cost data points to a path forward. I found that even if future reactor costs track past costs, a program that builds two or more reactors at each site and uses standardized designs will allow new plants to be built for an average cost of $8,200 per kilowatt of capacity, in 2025 dollars. At that price, building and running new reactors is almost certainly a lower-cost proposition than facing the ecological and human damage from burning equivalent fossil fuels.[14]
If anything, my figure is on the pessimistic side, since it bakes in the kind of shifting regulatory requirements that drove up costs so much in the post-TMI period. Even so, it comes to just half of what it cost to build the final two reactors — Georgia Power new Vogtle 3 and 4 units ― a project that nuclear power critics dredge up at every opportunity as proof that any new U.S. nuclear plant is doomed to be uneconomical.
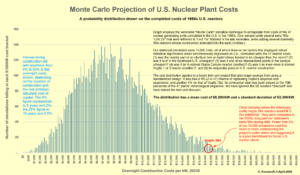
An alternative visualization of this chart appears as Fig. 9 in “Beyond Vogtle.”
Just as important, the odds of future extreme overruns appear low. Using a probabilistic model, I found that the likelihood that a new twin-unit plant, built to a standardized design, will end up costing as much as Vogtle is slim ― the same odds, around 1.7%, as correctly calling six coin flips in a row.[15]
Will the long time to build new reactors undo their climate benefit?
Past nuclear plants seemed to take forever to finish. The 47 reactors whose costs I analyzed averaged nearly 12 years from initiation to completion ― a 50 percent worsening from their 1970s counterparts. Much of that added time traces back to Three Mile Island, which triggered design changes, equipment upgrades, and staffing shifts across the entire U.S. nuclear sector, each adding delays. Slowing demand for power also led some utilities to stretch out construction schedules on their own.
To nuclear power’s critics, these setbacks come with the territory. But reactors aren’t the only major infrastructure projects facing long timelines. Delays in building wind farms, transmission lines, and other accoutrements of renewable energy have prompted plenty of national hand-wringing too. Even balcony solar ― the latest face of decarbonization ― will need time to scale up. Electrical codes and fire regulations must be rewritten, and then the real challenge begins: installing roughly 25 million of these devices (at 220W each) to match the climate benefit of a single 1,000-megawatt reactor.
There’s also a déjà vu tinge to the complaint that nuclear power is too slow to help with the climate crisis. That argument easily predates Vogtle 3 and 4 ― the massive Georgia project that tested residents’ patience and wallets, but is now helping decarbonize Atlanta and hundreds of other cities. The goal isn’t to repeat Vogtle’s egregiously high cost, which doesn’t yet clear the bar set by the social cost of carbon. It’s to treat the climate fight as an ongoing effort to reduce harm by whatever effective means are available.
Balcony solar and giant nukes aren’t rivals ― they’re partners. Building Vogtle didn’t stop Georgians from putting solar panels on their roofs in 2015, and if balcony solar really is the money-saving no-brainer its supporters claim, there’s no reason it shouldn’t help rate-burdened Georgia families in 2027, too. “All hands on deck” is a cliché, but it fits here. The world has no time to wait ― it needs to decarbonize by every means available. Including nuclear power.
[12] Lovins’ Foreign Affairs article is available here. I recounted its momentous impact on energy policy and public discourse for The Electricity Journal in 10 Blows That Stopped Nuclear Power (Jan/Feb 1991).
[13] U.S. CO2 emissions circa averaged only 1 to 2 percent annual reductions over the period 2010-2025, a rate many times slower than needed to meaningfully address the climate crisis.
[14] See Komanoff & Boucher, “Beyond Vogtle,” op. cit., pp. 41-44.
[15] The chance of correctly calling six coin-tosses in a row is one-half raised to the sixth power, which is 1 in 64, or 1.56%, which more or less matches the 1.7% chance that a new nuclear plant will cost as much as or more than Vogtle 3 and 4. See Komanoff & Boucher, op. cit., Fig. 9.



-

 Greenhouse Gases2 years ago
嘉宾来稿:满足中国增长的用电需求 光伏加储能“比新建煤电更实惠”
-
Climate Change1 year ago
Guest post: Why China is still building new coal – and when it might stop
-
Greenhouse Gases1 year ago
Guest post: Why China is still building new coal – and when it might stop
-

 Climate Change2 years ago
嘉宾来稿:满足中国增长的用电需求 光伏加储能“比新建煤电更实惠”
-

 Renewable Energy11 months ago
Sending Progressive Philanthropist George Soros to Prison?
-
Climate Change2 years ago
Bill Discounting Climate Change in Florida’s Energy Policy Awaits DeSantis’ Approval
-
Greenhouse Gases1 year ago
嘉宾来稿:探究火山喷发如何影响气候预测
-

 Climate Change2 years ago
Analysis: China’s CO2 falls 1% in Q2 2024 in first quarterly drop since Covid-19