

Recent years have seen a rapid succession of climate-related records broken.
To name just a few, the world has witnessed record warmth in the Atlantic, unprecedented glacier melt, all-time low Antarctic sea ice extent, the Amazon’s worst drought since observations began and UK temperatures soaring past 40C for the first time.
In a review article, published in Nature Reviews Earth & Environment, my coauthors and I look at how the frequency of weather records is changing as the planet warms.
We find that the number of hot temperature records observed around the world since 1950 far exceed what would be expected in a million years in a world without human-caused climate change.
Specifically, we show that “all-time” daily hot records on land were more than four times higher in 2016-24 than they would have been in a world without climate change.
Meanwhile, daily maximum rainfall records were up 40% over the same time period and record cold events were twice as rare.
A key finding of our research is that it is the pace of global warming that controls the occurrence of records.
We show that, if the pace of warming were to slow down, the frequency of record-breaking hot events would start to decline – even if global temperatures continue to rise.
Counting records
By definition, records are supposed to be rare events, at least in a system that is not changing.
Statistics of record occurrence are remarkably simple. They are expected to become rarer the longer a measurement series gets.
The chance of observing a new record after 20 years of measurement is one in 20, or 5%. And after 100 years of observations, the chances of a new record drops to 1%.
For example, this is why it becomes increasingly difficult to break records in athletics as time goes by, unless training methods or sports equipment improve.
Record-breaking weather events – for example, the highest windspeed, most intense rainfall or hot and cold temperatures – also face these odds in a climate that is “stationary”.
However, today’s climate is not stationary, but warming at a very high pace. This has significant implications for the record count.
The plot below shows how the frequency of all-time hot records (dashed red line) and record cold events (dashed blue line) has changed since the 1960s. This is compared to the probability that would be expected under a stationary climate (black line).
(The plot uses ERA5, a reanalysis dataset, which combines observations and models from the European Centre for Medium-Range Weather Forecasts (ECMWF).)
It illustrates how the frequency of hot events declined more slowly than would be expected in a stationary climate since 1950, before increasing in the last 15 years. Meanwhile, the frequency of record cold events is declining more quickly than expected.

The record ratio
Tracking the ratio between the measured number of records and the one theoretically expected in a stationary climate – the “record ratio” – reveals the fingerprint of climate change.
Analysis of ERA5 data and Berkeley Earth surface temperature observations finds that the record ratio over the last decade for hot records over global land regions is more than four. For cold records, it is between 0.2 and 0.5, showing that record-breaking cold has declined
In other words, there were more than four times as many hot record events and less than half as many cold record events than would be expected without global warming.
In 2023 and 2024, the record ratio for hot events reached 5.5 and 6.2, respectively.
Record ratios tend to be higher over global oceans than on land. They are also higher for monthly or seasonal record temperatures than all-time daily records.
This is because natural variability in the climate tends to be smaller over oceans and for longer averaging periods, such as months and seasons.
Record counts directly relate to the relationship between rates of warming and natural fluctuations in the climate. This is sometimes referred to as the “signal-to-noise ratio”. (The “signal” being the long-term trend of climate change and “noise” referring to short-term fluctuations of natural variability.)
As a result, event types and regions with a higher signal-to-noise ratio tend to see a greater number of records.
Another way of illustrating the signal of climate change is by counting the total number of records in a measurement series.
In a stationary climate, there should be about five records in 100 years of temperature measurements, 7.5 in 1,000 years and less than 10 in 10,000 years.
However, our analysis of records in two measurement series shows how the number of record-breaking events has become significantly higher as the climate has changed.
For example, as the figure on the left below illustrates, a new annual record for average global temperature has been set 25 times over the past 175 years.
Meanwhile, the figure on the right shows how, in the Pacific north-west, a new five-day average heat record has been set 14 times within the last 75 years. The spike in temperature in 2021 reflects the brutal heatwave that killed hundreds of people and brought devastating wildfires that almost entirely destroyed the Canadian village of Lytton.
(In both figures, the warm records are marked by pink circles.)
According to fundamental laws of statistics, 14 new records would not be expected in more than a million years in a climate that is not warming.

It is worth noting that some climate variables, including ocean heat content, sea level rise and minimum glacier or ice sheet volumes, are changing so relentlessly that new record levels are currently set every year.
Record-shattering events
Record-shattering events are a subset of record-breaking events whose magnitude exceeds the previous event by a large margin.
In our research, we define this as more than one standard deviation, which is a measure of how spread out data is from the average.
(The exact value of standard deviation varies for different parts of the world. For example, when it comes to year-to-year average temperatures, one standard deviation is typically 2-3C in the Arctic, but less than 0.5C over the ocean).
These events of unprecedented intensity are often very impactful as they strongly exceed the conditions that society or ecosystems have experienced in the past.
The 2021 heatwave in the Pacific north-west, mentioned above, is a forbidding example.
Our research finds that the large number of record-shattering events in the past three decades is the consequence of a very high warming rate.
Using a simple timeseries model, we illustrate why the pace of warming is the key factor explaining the occurrence of record-shattering events.
In the left-hand figure, we assume a 150-year period of no warming followed by some linear warming at three different rates, which is a very simplistic approximation of historical and future warming pathways.
The right-hand figure illustrates what happens to the probability of record-shattering events in the Pacific north-west region under these three simplified pathways. It shows that the probability of record-shattering events at first rapidly increases and then stabilises. And the level at which the probability stabilises is greater the higher the rate of warming.
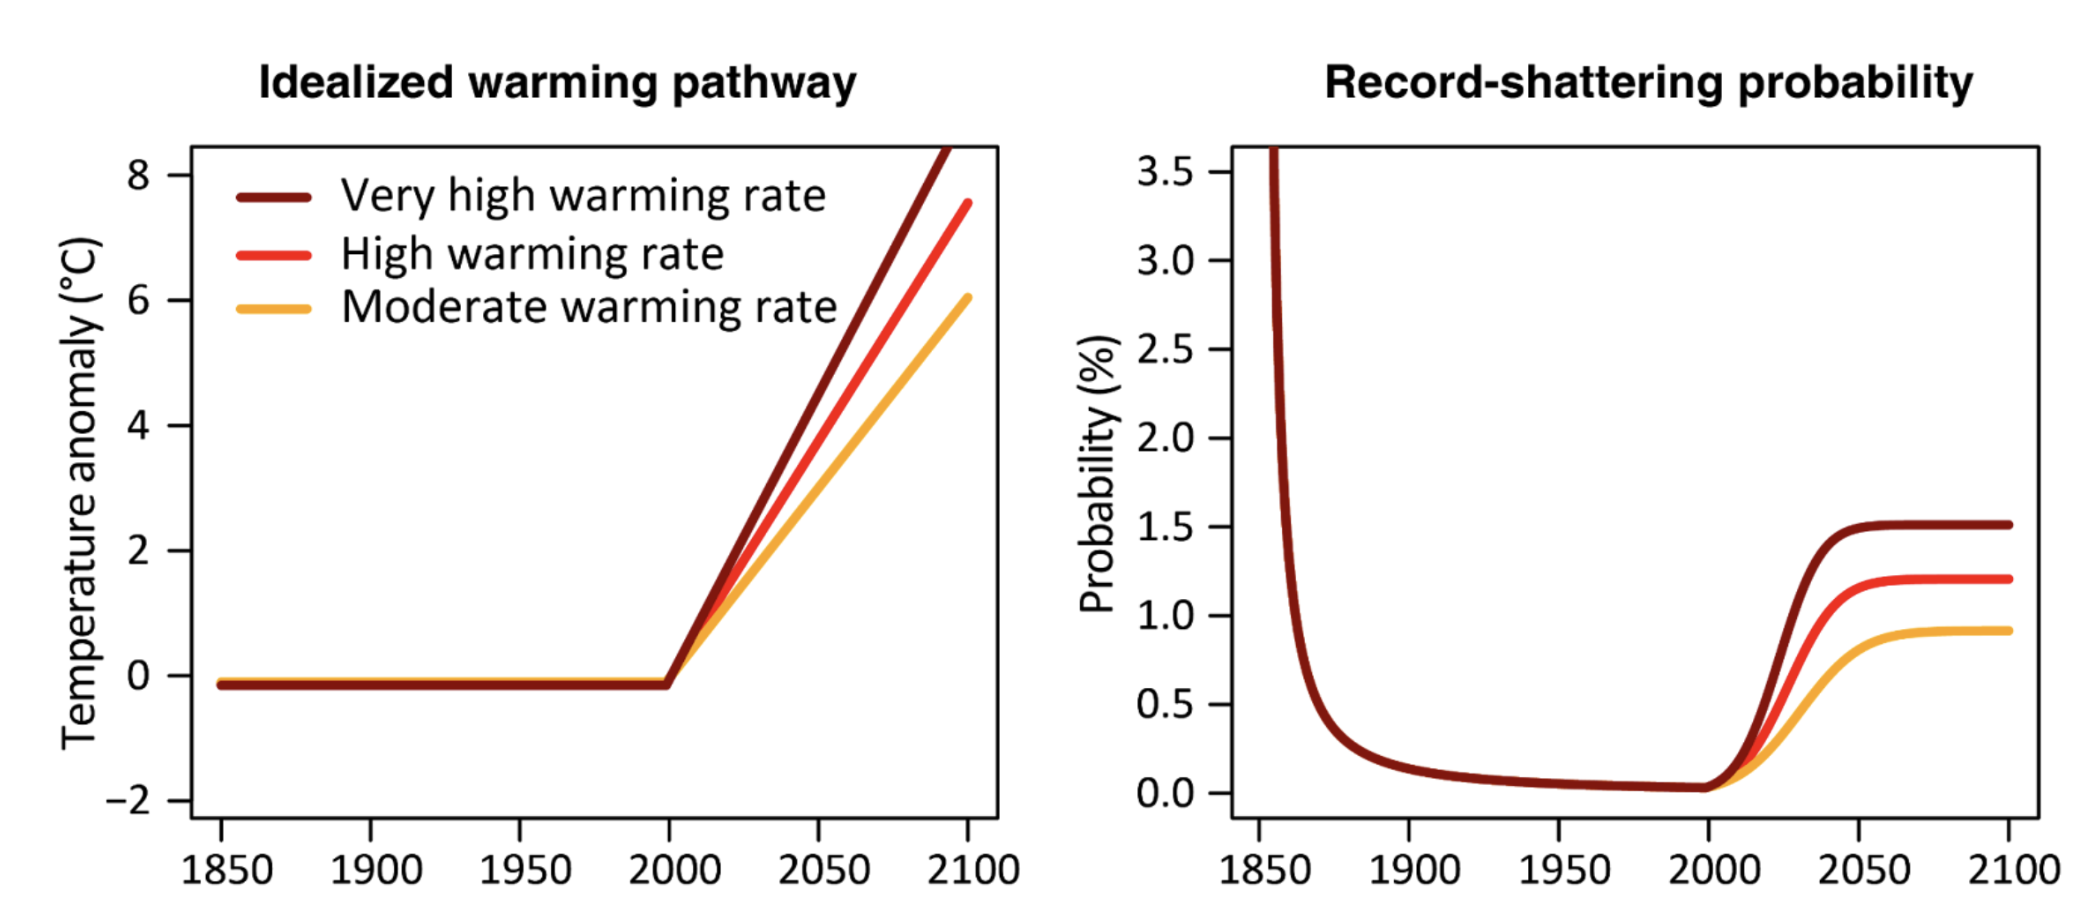
We therefore conclude that the high frequency of record-shattering hot extremes in recent years is controlled by the very high rate of warming caused by human-caused greenhouse gas emissions.
This tight coupling of record counts to the rate or speed of warming implies that there will be early benefits of slowing down global warming.
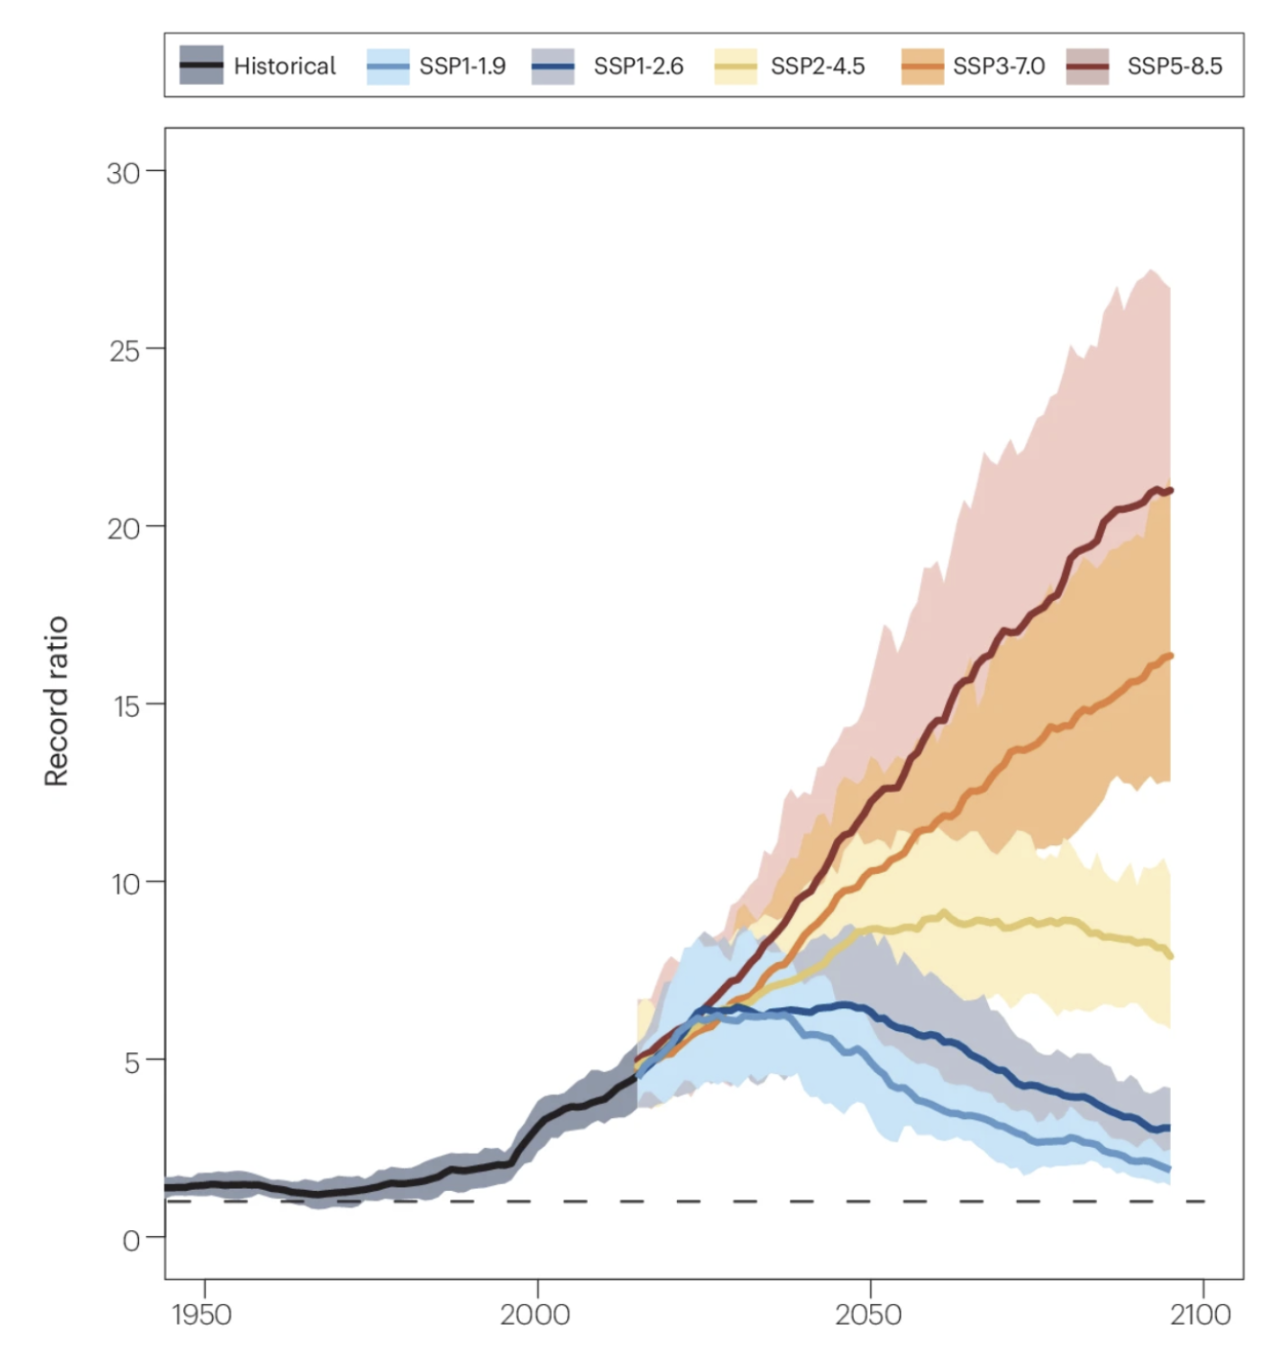
In our research, we look at how the probability of hot and cold records changes under different emissions reduction scenarios. To do this, we analysed the occurrence of record hot and cold events in climate model projections in the CMIP6 archive.
The figure below shows how stabilising temperatures by achieving net-zero carbon emissions (SSP1-1.9 and SSP1-2.6) will lead to a rapid decline of records, even if temperatures remain higher than in the historical period.
(It is worth noting that, while the number of records will decline under this lower-emissions scenario, the number of heatwaves would remain higher than today.)
Under intermediate (SSP2-4.5), high (SSP3-7.0) and very high emission (SSP5-8.5) scenarios, the number of records would continue to increase to levels much higher than today.
Rainfall records
We would also expect rainfall records to become progressively rarer in a stationary climate.
However, we find that record-breaking heavy precipitation occurred about 40% more often in 2015-24 than would be expected in a stationary climate. Many record-shattering heavy rainfall extremes occurred in the mid-latitudes and led to flooding which had large impacts.
(Calculating the frequency of records is more challenging for rainfall than for temperature, given small-scale variations and uncertainties in rainfall observations.)
The greater number of record-breaking rainfall events is due to an increase in precipitation intensity over most land regions as the atmosphere warms, as well as larger variations of rainfall intensity on a day-to-day, season-to-season and year-to-year basis .
We also find that the margin by which previous rainfall records are broken tends to become larger and larger in time. This is due to the “non-symmetric” distribution of rainfall – where there are many days with little precipitation, less with heavy precipitation and very few with very extreme precipitation.
It is therefore not surprising to see record-shattering precipitation events exceeding previous records by 20-50% in intensity, even if overall precipitation intensity increases by roughly 7% per degree of warming.
Preparing for the future
Efforts to adapt to climate change are typically informed by the worst events observed in recent generations.
This means that society is often underprepared for record-shattering events – which by their very definition are of unprecedented intensity.
Qualitative and quantitative storyline methods can offer insight into the many record-breaking events to come into the future – and, thus, help society prepare for escalating climate impacts.
These methods combine information from historical and paleoarchives, long measurement series, targeted climate model experiments, statistical and machine learning methods and weather forecasting systems.
Ultimately, these methods can improve society’s preparedness to climate change, so that the next record-shattering extreme does not come as a surprise.



The post Guest post: How climate change is fuelling record-breaking extreme weather appeared first on Carbon Brief.
Guest post: How climate change is fuelling record-breaking extreme weather

This is a republication of November’s edition of The Climate Agenda – a subscriber-only newsletter designed to keep you informed of the key events, negotiations and announcements happening every month. If you want to receive The Climate Agenda straight to your inbox at the start of each month, sign up as a subscriber today.
COP31 begins in one week, and we’ll have five specialist reporters on the ground in Antalya, Türkiye, bringing you every development as it happens. From the negotiations to leaders’ speeches and side events, we’ll be there to dissect what it all means for international climate policy on electrification, just transition, adaptation finance and much more.
Here’s what you need to know for November, why it matters and what to expect.
US midterm elections
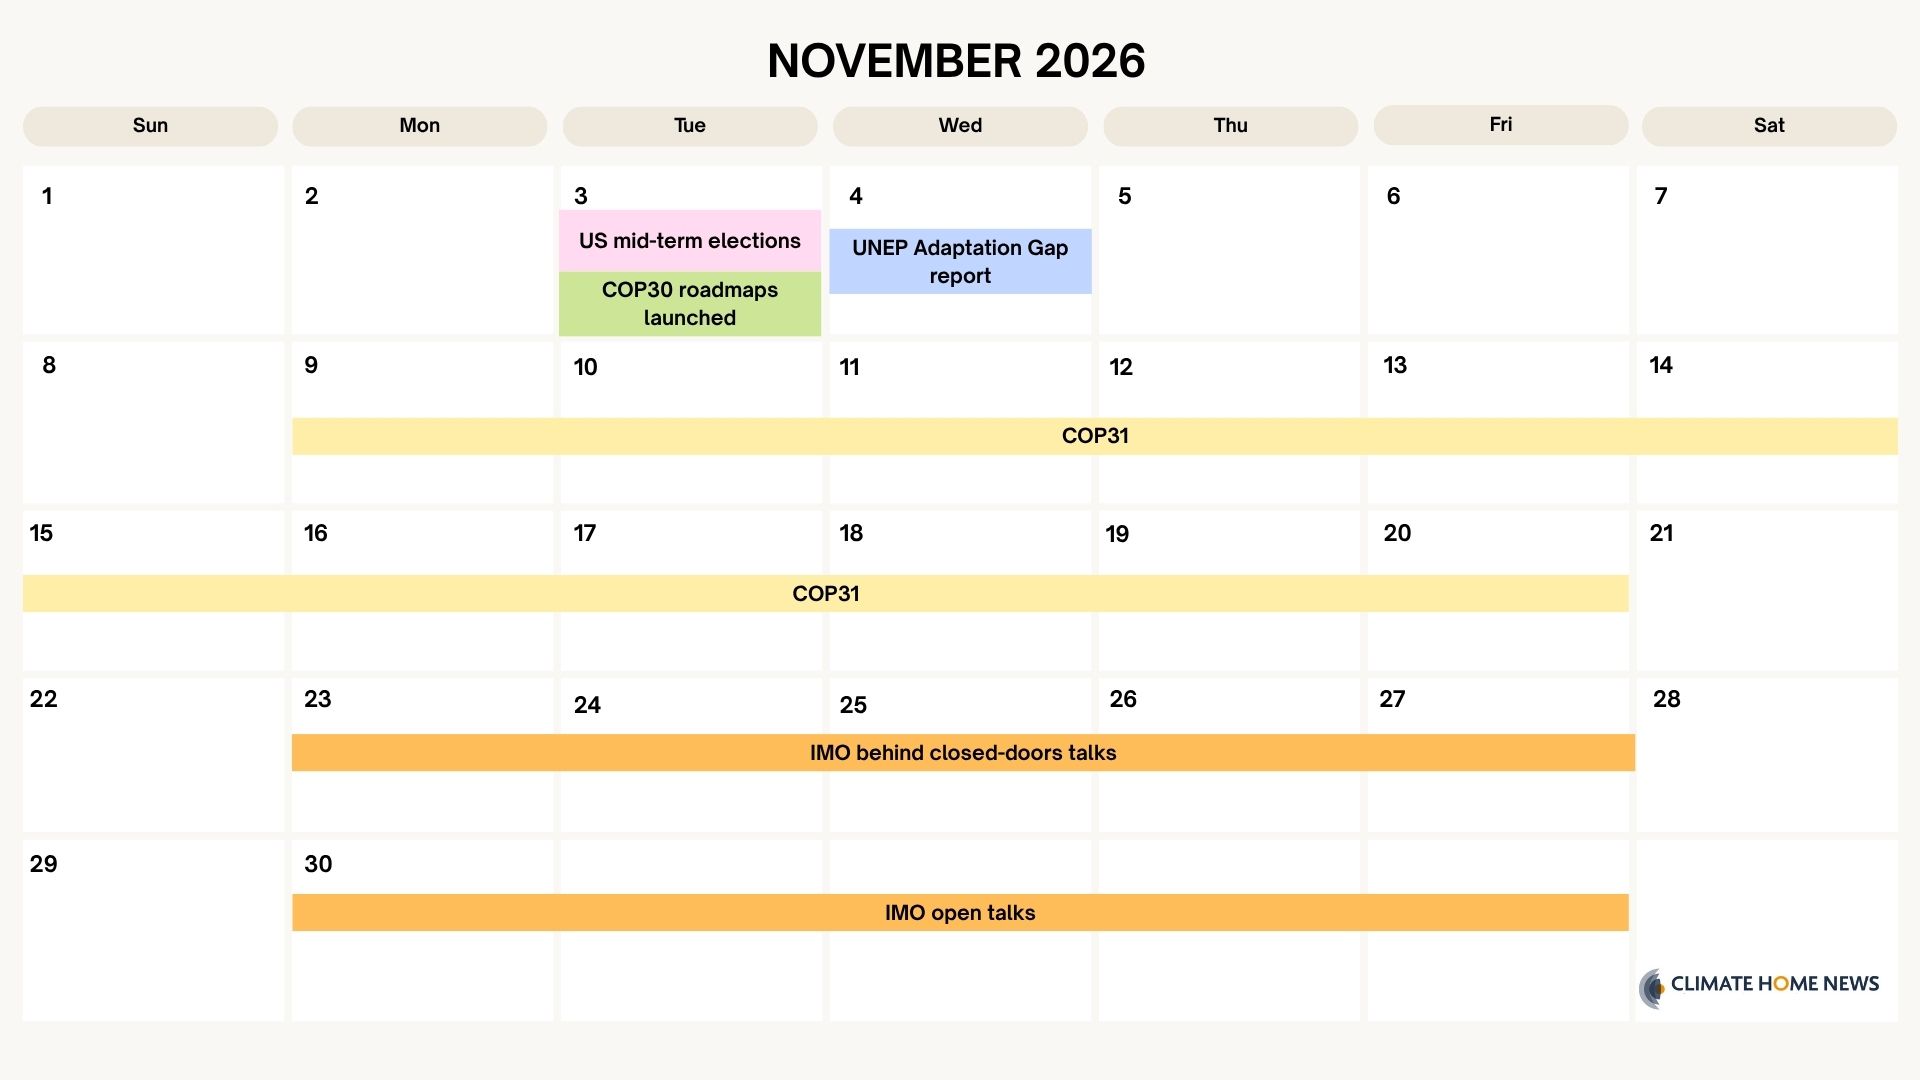
Tuesday 3 November – United States
The geopolitical highlight for the first week of November is the US midterm elections, which will show whether American voters are in any mood to forgive President Donald Trump for failing to bring down the cost of living. From an energy perspective, his pro-oil and gas stance hasn’t led to cheaper prices for consumers, pushed up by the US-instigated Iran conflict. And his diesel deal with Russia won’t yet have made a difference at the pump.
The key issue for climate and energy policy is whether the Republicans hold onto their governing trifecta. If so, then expect continued dismantling of regulations that protect the environment, as well as strong backing for fossil fuel production. If the Democrats regain control of Congress, which polls suggest is possible, it could trigger a push to restore Biden-era clean energy tax credits, and support states wanting to restart mothballed wind and solar projects.
Data centres have been a hot-wire issue, with growing community opposition to their expansion – partly due to concerns over rising utility bills as the facilities gobble power. Whether Republicans or Democrats win Congress, both are likely to make tech firms pay for the extra electricity production they need, with the latter favouring renewable sources.
Governor races are also taking place in key states for climate issues, including Democrat-run California, which has used the courts to fight Trump’s attacks on clean energy.
Read more: National climate plans now promise half the emission cuts expected by UN
Read more: The more Europe relies on the US for energy, the more it’s vulnerable to pressure by Trump

COP30 Deforestation and Fossil Fuel Transition Roadmaps
Tuesday 3 November – Brazil
Brazil is set to unveil two global roadmaps: one for transitioning away from fossil fuels, the other for ending deforestation.
The COP30 presidency promised them in the dying hours of the Belém summit last November as a last-minute fix to break a political impasse. Since then, it has been consulting with countries, experts and campaigners around the world to gather ideas and sketch out the elements to include in these blueprints.
Don’t expect the roadmaps to offer any new global targets or give direct instructions on what countries must do, either to cut fossil fuel production and consumption or better protect forests. Rather, Brazil has said the documents will identify barriers and priority actions, highlight existing mechanisms and present a range of options that can be adapted to different national contexts.
It remains unclear what will happen with the reports once they are delivered on Tuesday. At the Bonn talks last June, a group of European and small island nations called for the roadmaps to be brought into the official negotiations, warning that a one-off report won’t cut it. But such efforts would undoubtedly face stiff opposition from fossil fuel-producing nations that objected to drafting the energy transition roadmap within the formal UN process last year.
Read more: European, island states seek clear future for global roadmap to cut fossil fuels
Read more: COP30 roadmap to end deforestation will invite countries to draft domestic plans
Read more: What we need to see in the roadmap to transition away from fossil fuels

UNEP Adaptation Gap Report
Wednesday 4 November – Nairobi, Kenya
The UN Environment Programme (UNEP) will publish its annual assessment of how well the world is planning, implementing and – crucially – financing measures to cope with worsening climate impacts.
Past editions have made for grim reading. Last year’s report warned of a widening gap between what developing countries need for adaptation and what they can access. It estimated they will need $310–365 billion a year by 2035, which is 12 to 14 times current international flows. The report also found that a goal of doubling international public adaptation finance by 2025 was likely to have been missed.
This year’s edition will be closely watched with adaptation expected to be a big-ticket item at COP31. Governments are likely to discuss the specifics of a commitment to triple adaptation finance for developing nations by 2035, agreed at COP30 last year – particularly what the baseline for that pledge is. Negotiators will be debating how to track progress against the 59 indicators of the Global Goal on Adaptation.
Read more: Editor’s Desk: Nepal’s disaster has laid bare the world’s adaptation accountability gap
Read more: Bonn climate talks end in “gridlock” on adaptation and emissions-cutting
Read more: New data shows rich nations likely missed 2025 goal to double adaptation finance
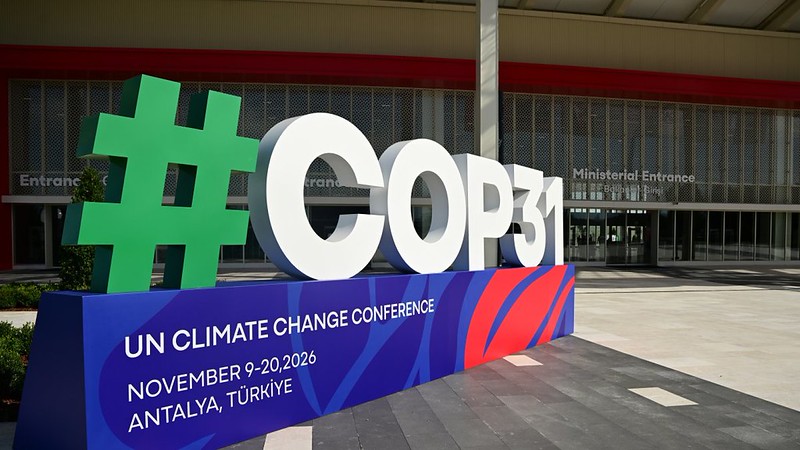
COP31 Climate Conference
Monday 9 November – Friday 20 November – Antalya, Türkiye
The climate community’s attention turns this month to Antalya for the annual UN climate summit. From the outset, COP31 will have an unprecedented, and potentially explosive, set-up: Türkiye is COP president overseeing the non-negotiated Action Agenda, while Australia runs the negotiations.
Billed, once again, as an “implementation COP”, the talks come amid a global energy crisis largely sparked by the actions of the US government, which is not expected to show up on the Turkish Riviera. It is also the first COP in the era of climate overshoot, coming just weeks after the UN officially confirmed the 1.5C warming limit will be breached and set out a narrow pathway to bring temperatures back down to the most ambitious Paris goal.
Unlike most recent COPs, the formal negotiations lack a clear headline item. Countries are due to establish and define the scope of the Just Transition Mechanism agreed in Belém last year, including its rules, governance and possible funding arrangements. On adaptation, vulnerable countries want a clearer path to delivering last year’s pledge to triple finance by 2035 and to putting the new progress indicators to work on the ground.
Governments are also likely to clash over next steps on the transition away from fossil fuels, and especially over whether the mitigation work programme – the forum dedicated to emission-cutting measures – has any future beyond this year.
Notable events to look out for in Antalya:
Opening session (9 November): The summit kicks off with the customary first-morning plenary. After the usual pageantry from the host nation, negotiating blocs and individual countries will deliver statements setting out their stall for the next two weeks. Watch out for a potential fight over the summit’s agenda – perhaps on issues relating to finance and trade following submissions requesting additional items – also a COP tradition.
Electrification (10 November): On Energy Day, the Turkish presidency is expected to formally launch its flagship electrification pledge, revealing which countries have signed up. Signatories will voluntarily commit to raising electricity’s share of global final energy consumption to 35% by 2035, though the current text does not require that power to come from clean sources. There is also a question mark over whether and how this can be included in the political cover decision the COP co-hosts have said they will aim to produce.
Leaders Summit (11-12 November): Heads of state and governments will jet into town for the traditional high-level segment in the middle of the first week, where world leaders typically talk up their climate record, air their grievances and call for more action.
Relatively few powerful leaders are on the list this time. Brazil’s Lula is set for another star turn this year, fresh from his surprise election win in October. The UK’s Andy Burnham, Spain’s Pedro Sanchez and China’s vice-premier Ding Xuexiang are expected, alongside Türkiye’s Recep Tayyip Erdogan and Australia’s Anthony Albanese. In addition, African and small island nations will feature prominently.
Our COP31 Briefing newsletter will offer a more in-depth preview of the talks later this week.
Read more: Early speakers’ list suggests few powerful leaders will attend COP31
Read more: COP31 electrification pledge leaves out clean power commitment
Read more: From Belém to Antalya – gains, gaps and challenges for a new Just Transition Mechanism
International Maritime Organization (IMO) Shipping Talks
Monday 23 November – Friday 4 December – London, United Kingdom
One year on from explosive talks in which Trump’s officials teamed up with Saudi Arabia to delay a deal to make the shipping industry greener, governments will gather on the banks of the Thames for another attempt to reach agreement.
The Net Zero Framework, provisionally agreed in October 2025, includes a series of emissions reduction targets for the owners of large ships along with penalties for not meeting them, rewards for doing so and measures to make the maritime transition fair.
The framework is likely to be either tweaked or radically rewritten so that it’s more acceptable to the US and Saudis. Brazil and Japan have submitted compromise proposals. Analysts find those will move shipping further away from being able to meet its climate goals.
There will be closed-door talks between November 23-27 and a second week of talks open to accredited media from November 30 to December 4. Agreement on a proposal, perhaps decided through a vote, is expected after long and technical negotiations. The shipping industry’s 3% share of the world’s emissions is at stake.
Read more: London talks raise hopes for green shipping deal
The post What’s on the climate calendar for November 2026? appeared first on Climate Home News.