


Disseminated on behalf of SolarBank Corporation.
The U.S. energy system is changing fast. In 2025, the country is expected to add about 97 gigawatts (GW) of new electricity capacity. Most of this growth will come from solar power and energy storage, showing strong momentum for clean energy, even as fossil fuels remain part of the mix.
A report from S&P Global Market Intelligence says that more than 59 GW of new solar and wind projects are planned for 2025, along with over 31 GW of energy storage. This means nearly 90% of new electricity projects next year will be tied to renewable energy and batteries.
Solar Shines Brightest
Solar energy is growing quickly across the United States. Nearly 49 GW of solar power is in line to connect to the electric grid. That’s enough to power more than 35 million homes for a year.
Texas is leading the solar race, with more than 12 GW of planned solar capacity. Other large amounts are planned in the Midcontinent Independent System Operator (MISO) region with 8 GW, and the PJM Interconnection area with over 6 GW.

The growth of solar is being pushed by several things:
- Falling prices of solar panels
- Government tax credits and incentives
- Demand for clean electricity from businesses and households
According to the Solar Energy Industries Association (SEIA), the U.S. solar market grew by 51% in 2023, and similar strong growth is expected in 2025. By 2034, the High Case scenario shows a 17% increase in solar deployment.

Batteries or Energy Storage Take the Grid to the Next Level
Energy storage systems, mostly large batteries, are important because they help store solar and wind power for use when the sun isn’t shining or the wind isn’t blowing. In 2025, over 31 GW of new storage capacity is expected to be built.
California and Texas are the leaders in battery storage. The California Independent System Operator (CAISO) is set to add about 6 GW of storage next year, while Texas plans to add nearly 12 GW.
Storage growth is important because it makes renewable energy more reliable. Batteries can help keep the grid stable and reduce blackouts.
Wind Picks Up, But Slower
Wind energy is still expanding, though not as fast as solar. More than 2 GW of new wind capacity is expected in Texas alone in 2025, and around 2 GW more across the rest of the country.
Offshore wind projects have faced delays due to high costs and supply chain problems, but some are moving ahead. For example, the Vineyard Wind project off the coast of Massachusetts began delivering power to the grid in early 2024 and plans to expand.
Fossil Fuels: Still in the Field
While renewable energy is growing fast, fossil fuels like natural gas and coal are still part of the energy system.

In 2025, the U.S. plans to add 6.4 GW of new natural gas capacity. At the same time, 4.6 GW of older gas plants are expected to retire, resulting in a net gain of 1.8 GW.
Coal power continues to decline. About 6.2 GW of coal-fired power plants are scheduled to shut down in 2025. This follows a long-term trend, as more utilities move away from coal due to high costs and pollution concerns.
Still, some recent government actions could slow coal’s decline. In April 2025, President Trump signed orders calling coal a “critical mineral” and pushed for its use in powering data centers. His administration declared a “national energy emergency” and said the grid was becoming less reliable without coal and gas.
Even so, experts say coal is unlikely to see a big comeback. Most utility companies are not planning to build new coal plants, as they worry about being left with stranded assets—plants that cost more to operate than they earn.
Natural Gas Eyes a Bigger Role
As electricity demand rises, especially from electric vehicles and data centers, natural gas could play a larger role in some parts of the country.
There’s going to be a lot of momentum for natural gas, per Steve Piper, director of energy research at S&P Global Commodity Insights. He noted that areas like the Marcellus and Utica shale regions, which have low-cost gas, could see more gas power plants being built.
Still, challenges remain for natural gas. High capital costs, slow permitting, and supply chain delays could limit how fast new plants are built.
Grid Growth by Region
Each part of the U.S. energy grid has its own plans for new projects in 2025. These include the following:
- ERCOT (Texas): 27 GW of new capacity, with only 574 MW of retirements. Major growth in solar and batteries.
- PJM (Mid-Atlantic and Midwest): 7 GW of new projects, mostly solar. About 3 GW of fossil fuel plants will retire.
- CAISO (California): 10 GW of new capacity, including 6 GW of storage.
- MISO (Midwest): 11 GW of new capacity, mostly solar. Coal retirements are expected.
- ISO New England: About 2 GW of new power, mostly solar and storage.
- NYISO (New York): 1.4 GW of new capacity, with gas retirements.
- SPP (Southwest Power Pool): 6 GW of new capacity, mainly from solar and gas.
- Non-ISO/RTO areas (Southeast and Western U.S.): 33 GW of new capacity, including 17 GW of solar and 11 GW of storage.
Toward a Cleaner Grid
Overall, the U.S. is set to add nearly 86 GW of new net power capacity in 2025. Most of this will come from solar and storage. These technologies are key to cutting emissions and meeting climate goals. And one company that stands out in this field is SolarBank Corporation (Nasdaq: SUUN) (Cboe CA: SUNN) (FSE: GY2).
SolarBank is a leading independent renewable energy developer focused on distributed and community solar projects in Canada and the U.S. The company specializes in solar, battery storage, and EV charging solutions for utilities, municipalities, commercial clients, and homeowners.
Notably, SolarBank completed a $41 million USD deal with Honeywell for three New York-based solar projects and began work on a 1.4 MW rooftop project for Fiera Real Estate in Alberta. Major community solar initiatives include the Geddes, Greenville, and Nassau projects in New York, set to power thousands of homes. In Nova Scotia, SolarBank is developing up to 31 MW of solar capacity with TriMac Engineering, targeting 4,000 households.
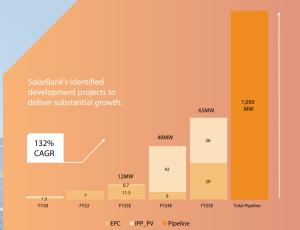
Looking ahead, SolarBank is advancing projects in New York, Pennsylvania, and Nova Scotia, including agrivoltaic systems that combine solar power with farming. These efforts highlight the company’s role in accelerating the clean energy transition through innovative, community-based solar solutions.
However, fossil fuels are still needed to meet rising demand and ensure grid reliability. Policymakers and energy companies face tough choices as they try to balance clean energy growth with keeping the lights on.
Even with political shifts, experts say the energy transition is moving forward. Market forces, customer demand, and lower costs for renewables are driving long-term change.
As more projects get built in 2025, the U.S. will come closer to a cleaner energy system—one that can power homes, businesses, and vehicles while cutting carbon pollution.
-
READ MORE: Trump’s New Tariffs Wipe Out $2.5 Trillion: How Can It Stall America’s Clean Energy Future?
This report contains forward-looking information. Please refer to the SolarBank press release entitled “SolarBank Announces 2024 Highlights” for details of the information, risks and assumptions.
Disclosure: Owners, members, directors, and employees of carboncredits.com have/may have stock or option positions in any of the companies mentioned: None.
Additional disclosure: This communication serves the sole purpose of adding value to the research process and is for information only. Please do your own due diligence. Every investment in securities mentioned in publications of carboncredits.com involves risks that could lead to a total loss of the invested capital.
Please read our Full RISKS and DISCLOSURE here.
The post U.S. Solar and Energy Storage Set for Major Growth in 2025 appeared first on Carbon Credits.

EU carbon credit claims changed on 27 September 2026, the day the Directive (EU) 2024/825 began to apply across the European Union. The change is narrow. It changes how a company can talk about the credits it buys. A product can no longer be called neutral on the strength of compensation alone; however, every specific, evidenced statement about what a company measured, reduced, and funded stays fully available.

The post Promoting Improved Cooking Practices in Nigeria appeared first on Terrapass.


UK approves gas drilling despite admitting blow to “climate leadership” status

Revealed: Expensive gas behind ‘nearly 90%’ of rise in UK electricity bills
UNEP: Opportunity has ‘been lost’ to meet 1.5C warming limit without ‘overshoot’
-
Climate Change1 year ago
Guest post: Why China is still building new coal – and when it might stop
-

 Greenhouse Gases2 years ago
嘉宾来稿:满足中国增长的用电需求 光伏加储能“比新建煤电更实惠”
-
Greenhouse Gases1 year ago
Guest post: Why China is still building new coal – and when it might stop
-

 Climate Change2 years ago
嘉宾来稿:满足中国增长的用电需求 光伏加储能“比新建煤电更实惠”
-

 Renewable Energy12 months ago
Sending Progressive Philanthropist George Soros to Prison?
-
Climate Change2 years ago
Bill Discounting Climate Change in Florida’s Energy Policy Awaits DeSantis’ Approval
-
Greenhouse Gases1 year ago
嘉宾来稿:探究火山喷发如何影响气候预测
-

 Climate Change2 years ago
Analysis: China’s CO2 falls 1% in Q2 2024 in first quarterly drop since Covid-19