Connect with us

Published

on

As climate change and commercial fishing threaten krill, the crustaceans that fuel Antarctica’s entire food web, scientists and advocates say those responsible for protecting Antarctica’s marine life are failing.

When Antarctic krill swarm, the semi-transparent shrimp-like crustaceans join together in the millions or trillions, forming dense coral-colored underwater clouds as they swim in sync with one another and traverse frigid ocean currents. Some of these swarms are so large they can be seen from space, extending for miles near the ocean’s surface and hundreds of feet below, attracting predators from land, sea and sky.

Scientists Call for More Marine Protected Areas in the Southern Ocean

Climate Change

AI giant Anthropic’s first Australian data centre deal an “egregious” example of Big Tech double talk

Published

on

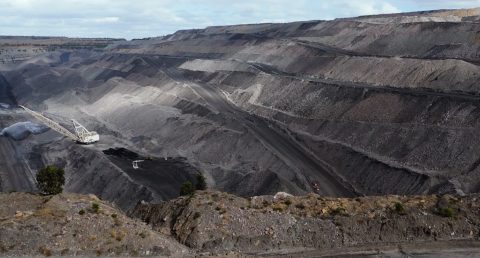
SYDNEY, Thursday 17 September 2026 — Greenpeace Australia Pacific has slammed AI giant Anthropic’s deal for its first Australian site in Queensland’s Western Downs, the heart of coal seam gas country, saying the project will entrench gas and turbocharge climate pollution.

The expected electricity demand from the data centre site, situated in the middle of the Western Downs coal seam gas fields, is comparable to 1.5 million Australian households. Greenpeace’s report Energy Vampires: The AI data centres draining Australia called for a moratorium on frenzied data centre development until appropriate guardrails are in place.

Joe Rafalowicz, Head of Climate and Energy at Greenpeace Australia Pacific, said: “This is an egregious example of Big Tech giants being given carte blanche to drain energy and water, and use polluting gas to fuel their hyperscale data centres.

“AI and Big Tech corporations claim to bring new renewable energy to the grid, while blatantly planning to power their operations with polluting fossil fuels.

Planning documents show the first stage of this behemoth project could be powered by ‘behind the metre’ gas — the same playbook AI companies have used in the US, leading to a 20% increase in climate pollution from electricity. Now these companies want to bring their cowboy plans to Australia and the Federal Government is allowing it.

“If they plugged into the local grid, the power required would increase Queensland’s electricity grid emissions by around 6.6 million tonnes — an 18% rise. If they build their own gas-fired power plants, this will drive up Queensland’s emissions even more.

“Billions of dollars are now pouring into a massive pipeline of proposed new data centres, of unprecedented size, being built at incredible speed across the country. Australians should be worried about the extreme lack of scrutiny being applied to these projects, and the corporations leading the data centre charge.

“The data centre build-out is happening without the endorsement of the Australian people, yet we are the ones who will pay the price. We can not allow unchecked data centre expansion to derail our renewable energy transition, entrench gas and turbocharge climate pollution — that’s why Greenpeace has called for an urgent moratorium until appropriate guardrails are in place.”

ENDS

Media contact: Kate O’Callaghan on 0406 231 892 or kate.ocallaghan@greenpeace.org

AI giant Anthropic’s first Australian data centre deal an “egregious” example of Big Tech double talk

Continue Reading

Climate Change

Analysis: India’s power-sector emissions flat for two years due to clean-energy surge

Published

on

Article Contents

A surge in clean energy has kept carbon dioxide (CO2) emissions in check across India’s power sector, with no growth from the first half of 2024 to the same period in 2026.

This guest post is by:

Lauri Myllyvirta, lead analyst at Centre for Research on Energy and Clean Air (CREA) 

Anubha Aggarwal, India analyst at CREA

This is the first time in more than 50 years that there has been no growth in India’s coal power over a two-year period, even as electricity demand grew overall.

At the same time, both oil and gas consumption have fallen across the nation for two years in a row, helping alleviate the shock of the Hormuz crisis.

Nevertheless, the new six-monthly analysis for Carbon Brief shows that India’s emissions grew by 3.7% year-on-year in the first half of 2026, due to increases from steel, cement and other sectors.

Other key findings for the first half of 2026 include:

  • India’s power-sector emissions flatlined at 2024 levels, after a 2.2% decline in the first half of 2025 and a 2.3% rise in the same period this year.
  • Clean energy met all of the 7% rise in India’s electricity demand over the two years, adding 63 terawatt hours (TWh), equivalent to the total demand of Switzerland.
  • India has added 77 gigawatts (GW) of solar in this two-year period, helping meet 60% of the rise in electricity demand overall.
  • While fossil-fuel generation stagnated, generators added 8.5GW of new coal capacity, leading to fewer running hours and increased costs to electricity consumers.
  • CO2 emissions from oil and gas fell by 7% year-on-year, extending a reduction that began in 2025, despite higher demand for road transport fuels.
  • Steel and cement emissions grew by 8% year-on-year, reaching a 23% share of India’s total CO2 in the first half of 2026.

If the pace of India’s clean-energy expansion is to continue, it will need to upgrade its electricity grid, rapidly build out energy storage and boost the flexibility of coal power.

While clean-energy expansion is covering most or all of India’s power-demand growth, the fossil-fuel industry continues to pursue major capital investments.

This includes large amounts of new coal-power capacity, ambitious plans for the conversion of coal-to-chemicals and efforts to boost domestic coking coal production for the steel sector.

While CO2 output from the power sector is flat, with oil and gas in decline, India’s emissions still went up due to the contribution from industry.

India lags behind its competitors – including most large emerging economies – when it comes to electrifying its industrial sector.

Faster progress would enable clean electricity to substitute for fossil fuels in industry, as well as for power, offering the potential for India to cut its emissions overall.

Flatlining fossils

Last year, India’s CO2 emissions from fossil fuels and cement grew at their slowest pace in two decades, according to previous analysis for Carbon Brief.

This sharp slowdown was due to rapid clean-energy growth and flat oil demand, combined with rising emissions from steel and cement.

The first half of 2026 marks a continuation of these trends.

Most strikingly, the ongoing surge in clean-energy generation means that emissions have flatlined in India’s power sector for two years, as shown in the figure below.

Power-sector CO2 was the same in the first half of 2026 as two years earlier, with a small decline in 2025 having been reversed over the same period this year.

For further details, see: About the data.

Beyond electricity generation, India’s key emitting sectors continued to see divergent trends in the first half of 2026, as some saw ongoing decline while others reached new heights.

This is shown in the figure below, which compares year-on-year changes in emissions during the first half of 2026 with the same periods in 2025, 2024 and the average for 2021-23.

Specifically, emissions grew by 2.3% in the power sector, reversing last year’s decline, while demand for gas and oil products fell for another year.

The biggest increases were for steel and cement, where emissions growth accelerated to 8% year-on-year in the first half of 2026, well above the recent trend.

Bar chart titled "Industrial emissions growth is driving up India’s CO2" and subtitled "Change in CO2 per sector, MtCO2 year-on-year." The chart shows emissions across Power generation, Steel and cement, Oil product consumption, and Others. Steel and cement growth rises steadily through 2026 H1, while power generation dips significantly in 2025 H1. Source: Analysis for Carbon Brief by CREA. (alt text generated by Google Gemini)
For further details, see: About the data.

Clean-energy growth matches power demand

The period from the first half of 2024 to the first half of 2026 saw the largest increase in non-fossil power generation on record in India.

This enabled fossil-fuel consumption and CO2 emissions from the sector to stay flat, even as electricity consumption increased.

Indeed, this is the first time in more than 50 years that there has been no growth in coal power over a two-year period, even as electricity demand grew overall, as shown below.

Chart titled "Clean energy caps India's coal power for first time in 50 years" and subtitled "Electricity generation from coal, TWh per 12 months". The line chart shows coal generation steadily rising from near zero in 1975 to a peak over 1,300 TWh in 2024 before flattening. Source: Analysis for Carbon Brief by CREA. (alt text generated by Google Gemini)
For further details, see: About the data.

Over this two-year period, India’s total power generation increased by 7%, some 63TWh, equal to the total consumption of Singapore or Switzerland.

The additional power requirement of 63TWh was met entirely by clean energy. Solar grew by 44TWh, alongside growth from wind (13TWh), nuclear (7TWh) and hydro (8TWh).

Together, clean-energy sources added 70TWh over two years, more than the net increase in demand.

(For comparison, China’s nuclear, wind and solar output increased by 485TWh in 2025.)

The figure below shows that new investments are more than sufficient to maintain this trend, as added power generation from new clean power capacity has stayed above average demand growth for the past 18 months.

Chart titled "Clean power grew faster than electricity demand in H1 2026" and subtitled "Output from new clean capacity and demand growth, TWh per half-year." The chart shows clean power capacity, dominated by solar, rising steadily to overtake electricity demand growth in recent periods. Source: Analysis for Carbon Brief by CREA. (alt text generated by Google Gemini)
For further details, see: About the data.

Over the past two years, India added 77GW of new solar capacity, 11GW of wind, 5GW of hydro and 0.6GW of nuclear capacity.

Solar power continues to dominate clean-energy growth, but, collectively, the other non-fossil sources still contributed 40% of the overall increase in generation.

One factor in electricity demand growth in 2026 is the El Niño, which delayed the monsoon and intensified heatwaves, driving up cooling demand.

India is accelerating investment in energy storage, which will support further growth in clean power. The National Electricity Plan projected a requirement of 82 gigawatt-hours (GWh) of energy storage capacity by 2026-27 and 411GWh by 2031-32.

As of May 2026, the government has issued tenders for around 272GWh of energy storage capacity, including 142GWh of pumped hydro and 133GWh of battery storage systems. Current capacity is 7.5GWh of battery storage and around 60GWh of pumped hydro.

Which states led the clean-power shift?

The fall in power generation from fossil fuels from the first half of 2024 to the same period in 2026 was concentrated in a few states.

Gujarat saw both the largest reduction in fossil-fuel generation and the largest expansion in clean power, as shown in the figure below.

Chart titled "Gujarat is India’s leading state for clean-power growth – and fossil-power decline" and subtitled "Change in power generation by state from H1 2024 to H1 2026, TWh." The horizontal bar chart shows Gujarat leading with largest wind and solar gains and biggest fossil drops. Source: Analysis for Carbon Brief by CREA (alt text generated by Google Gemini)
For further details, see: About the data.

After Gujarat, the largest increases in clean-power generation were seen in Rajasthan and Tamil Nadu, which also saw reductions in power generation from fossil fuels.

Several other states saw declines in fossil-fuel generation due to higher net imports, rather than local clean power. These included Madhya Pradesh, West Bengal and Punjab.

Karnataka and Andhra Pradesh also succeeded in increasing clean-power generation faster than power demand, thereby contributing to keeping fossil fuel-based power generation stable nationwide across the two-year period. However, they exported much of the increase and consequently saw local increases in power generation from fossil fuels.

The two states with the largest increases in power demand, Maharashtra and Telangana, managed to almost match the rise with growth in clean-power generation.

Fall in oil and gas consumption continues

India’s oil consumption continued to fall during the first half of 2026, dropping 1.3% year-on-year, a slight acceleration from the 0.7% reduction in the same period last year.

While diesel and petrol consumption continued to grow, oil consumption was pulled down overall by declines in liquefied petroleum gas (LPG), petcoke (a solid derivative of oil used in the cement industry) and industrial feedstocks. Growth of aviation fuel use eased.

Diesel consumption growth accelerated from 1.8% to 4.1% in the first half of the year, supported by higher freight movement and increased agricultural demand, as the delayed monsoon led to greater use of diesel-powered irrigation.

Petrol consumption returned to growth, increasing 6.9% year-on-year after zero growth in the same period in 2025, reflecting sustained growth in passenger and two-wheeler mobility.

A significant increase in ethanol blending shaved a full percentage point off the growth of petrol consumption. India achieved its 20% ethanol blending target five years ahead of schedule in 2025-26. (Ethanol blending has faced public opposition.)

Electric vehicle (EV) adoption in India is also gaining momentum, with EVs adopted in a widening range of categories.

In Delhi, an EV policy was launched to accelerate electrification of the vehicle fleet, with a particular focus on two-wheelers, three-wheelers (auto rickshaws), commercial vehicles and high-mileage segments, alongside expanded charging infrastructure. Higher EV adoption rates will moderate the growth in emissions from petrol consumption in India.

In contrast, aviation fuel demand growth slowed down from 5% to 2%. The slowdown coincided with the strait of Hormuz and wider crisis, which disrupted international aviation through temporary airspace closures and flight cancellations to several Middle Eastern destinations. Elevated aviation fuel prices also increased airline operating costs, contributing to lower fuel demand.

LPG consumption contracted by 7%, after 5.7% growth in the same period last year, amid disruptions in global LPG markets following the Hormuz crisis.

Petcoke consumption fell 9.9%, more than reversing a 9.3% increase in the same period last year. Rising petcoke prices encouraged cement manufacturers to switch to coal.

Consumption of other petroleum products continued to drop, although the pace of decline moderated from 14% in 2025 to 9% in 2026.

Industrial feedstock use was affected by shortages and price increases.

Naphtha demand contracted as import prices nearly doubled and domestic prices increased by around 60%, prompting petrochemical manufacturers to reduce operating rates and suppress demand for imported naphtha.

Bitumen consumption remained subdued due to slower road construction, driven by persistent land acquisition challenges and higher bitumen costs.

Meanwhile, higher light diesel oil (LDO) prices and shortage of LPG led some industrial consumers to switch back to furnace oil in boilers and heaters, despite the higher air pollutant emissions. Supply of fuel oil to industry increased for the same reason.

Rapid emission growth from heavy industry continues

Steel and cement output in India grew by 8% and 9%, respectively, year-on-year in the first half of 2026, despite rising input prices and weakening profitability.

The growth in steel and cement was supported in part by increased investment in India’s real estate sector, especially in the second quarter. Steel consumption growth outpaced production, implying that inventories built up last year were tapped.

Despite domestic demand growth, profit margins of Indian steel and cement manufacturers remained under pressure for much of the period due to elevated raw material costs – particularly imported coking coal – and higher freight costs stemming from the Hormuz crisis.

The pressure on prices could dampen growth. Cement prices are expected to rise to levels last seen in the 2021-22 financial year, when Russia’s decision to cut back gas exports to Europe drove a sharp increase in fossil-fuel prices.

Outside the steel, cement and power sectors, coal-consumption growth accelerated to 14% in the first half of 2026, up from 3% last year, as the LPG shortage prompted a shift to coal.

Gas shortages resulted in some additional burning of coal for cooking in March and April. The government officially authorised the hospitality industry to use coal, refuse-derived fuel pellets, biomass and kerosene for one month.

The ceramic and tile industry also requested that the government allow the use of coal gasifiers amid the gas shortage. State governments including Delhi NCR, Rajasthan, Tamil Nadu, Gujarat and Maharashtra also allowed industries to temporarily use alternative fuels, including coal.

India’s industrial energy use is dominated by fossil fuels, particularly coal. Indian industry has the second-lowest electrification rate in the G20, as shown in the figure below. The share of electricity in total energy consumption in the sector also lags the world average, in terms of both current levels and the rate of increase.

Chart titled "Indian industry has the second-lowest electrification rate in G20" and subtitled "Electricity share of industrial energy use in 2023. Arrow shows change since 2000." The chart shows that Korea leads above 50%, Saudi Arabia is lowest below 10%, and India grew to 17%. Source: CREA analysis of IEA World Energy Balances 2025 (alt text generated by Google Gemini)
For further details, see: About the data.

The current low rates of electricity use in Indian industry imply that there is major potential for electrification, using technologies and processes already in place in other countries.

New investments in coal

While the clean-power expansion is starting to meet most or all of India’s electricity demand growth, there are still large investment plans across the coal supply chain.

Some 43GW of coal-power capacity was under construction at the end of June. Additional coal-power capacity is seen as necessary to meet increasing peak loads, even as solar power and energy storage are already playing a role in covering daytime and evening peak demand, respectively. The expansion of energy storage will increase this contribution.

Outside the power sector, India has major ambitions to produce chemical-industry products, such as fertiliser and plastic feedstock, from coal through coal gasification, in pursuit of energy security.

The government is targeting a capacity to process 100m tonnes of coal per year in the next four years, despite the technology for coal gasification still being nascent in India. At present, the only operational use of coal gasification is at Jindal Steel Limited, which is reportedly using syngas in its steel-making process.

Meanwhile, India plans to reduce its average CO2 emissions per tonne of steel by 25% by 2025-26, mainly by reducing the share of coal-based steelmaking.

At the same time, the government is aiming to increase the use of domestic coking coal, which it notified in January this year as a “critical and strategic mineral”. Coal miners and steel companies are reportedly planning to establish additional washeries for coking coal to make it suitable for blending with imported coal for use in steel production.

India is also looking to invest in new coal mines in the near future.

These continued investments in coal gasification, domestic coking coal and new coal mining capacity could lock in coal use across industry for several decades.

Outlook for India’s emissions

Over the two-year period from the first half of 2024 to the same period in 2026, India has achieved its largest clean-energy expansion on record.

As a result, power-demand growth has been met entirely by clean electricity and CO2 emissions in the sector have flatlined.

This expansion of clean energy also allowed a reduction in fossil-fuel imports for power generation, with the use of imported coal falling 38% and the use of gas by 35%, supporting the energy security aims of the government and reducing exposure to the Hormuz shock.

In order to keep the clean-energy growth going, India would need to overcome multiple obstacles, including expansion of the electricity transmission network, improvements in grid flexibility to accommodate variable renewables and the timely completion of new projects.

For example, renewable power projects totalling 5.3GW missed completion deadlines and are having to pay penalties to the grid operator in order to retain network access.

Curtailment has emerged as an issue, particularly for projects relying on interstate power transmission, pointing to the need to upgrade the network. (Curtailment refers to electricity generation that is “wasted” because it cannot be accommodated by the power network.)

Another obstacle to be overcome if clean energy is to keep growing will be making coal-power plants more flexible, so they can ramp down during high renewable output.

A flexibility plan for coal-power plants has been delayed by more than a year due to persistent regulatory bottlenecks, contributing to the curtailment of renewable energy.

Expanding energy storage has the potential to ease grid and flexibility constraints, while reducing or eliminating the need for adding thermal-power capacity to meet peak loads.

The Central Electricity Authority has proposed that, after June 2027, all new government-owned solar and wind projects would have “mandatory” two-hour battery storage. (This mirrors a policy that was in place in China until early 2025 and was subsequently scrapped, in favour of more market-based approaches.)

For oil and gas, India’s consumption has been flatlining for the past two years, after half a century of continuous growth that was only briefly interrupted by Covid-19.

This has reduced the impacts of the Hormuz crisis on the country’s trade balance, helping close the gap between supply and consumption. But it has entailed disruptive shifts in many oil-dependent sectors.

For example, high prices and fuel shortages due to the Hormuz crisis led state governments to reverse their orders banning the use of dirtier fuels such as fuel oil, kerosene and coal in industries and commercial establishments.

Meanwhile, EV adoption has also begun to influence oil consumption.

Despite the progress in the power sector and reductions in oil consumption, India’s total emissions went up over the past two years due to a major increase in industrial emissions.

Low levels of electricity use in industry mean that growing industrial output results in increasing direct fossil-fuel use and emissions.

Unless the rate of industrial electrification picks up, increases in heavy industry output will continue to translate into increases in fossil-fuel consumption and CO2 emissions.

About the data

This analysis is based on official monthly data for fuel consumption, industrial production and power generation from different ministries and government institutes.

Coal-power emissions are estimated by combining plant-level coal consumption from the Central Electricity Authority’s (CEA) monthly coal reports with data on the calorific value and emission factors of coal used at different power plants from the CEA’s CO2 baseline database.

For each station and month, total coal consumption is split into domestic and imported coal using the imported share of coal receipts over a trailing two-month window, found to best reproduce the actual split in data available for 2023.

Consumption is converted to CO2 using each plant’s station-specific gross calorific value from the CEA database and IPCC emission factors for domestic coal, imported coal and lignite. The national-average calorific value is used for recently added plants, for which data is not available in the baseline database.

Coal use at steel and cement plants, as well as process emissions from cement production, are estimated using production indices from the index of eight core industries released monthly by the Office of Economic Adviser, assuming that changes in total fossil-fuel use follow production volumes. These production indices were used to scale fuel use by the sectors in 2022.

To form a basis for using the indices, monthly coal-consumption data for 2022 was constructed for the sectors by combining the annual total coal and petcoke consumption reported in IEA World Energy Balances with monthly production data. This work was set out in a paper by Robbie Andrew, a researcher at Norwegian research institute CICERO, on monthly CO2 emission accounting for India. Monthly petcoke consumption was available from the Petroleum Planning and Analysis Cell, while coal consumption by the cement industry was calculated by subtracting petcoke use from total fossil-fuel use.

Annual cement-process emissions up to 2025 were also taken from Andrew’s work and scaled using the production indices. This approach better approximated changes in energy use and emissions reported in the IEA World Energy Balances, than did the amounts of coal reported to have been dispatched to the sectors, showing that production volumes are the dominant driver of short-term changes in emissions.

For other sectors – including aluminium, auto, chemical and petrochemical, paper and plywood, pharmaceutical, graphite electrode, sugar, textile, mining, traders and others – coal consumption is estimated based on data on despatch of domestic and imported coal to end users from statistical reports and monthly reports by the Ministry of Coal, as consumption data is not available.

Coal consumption by “captive” coal-power plants – those supplying power to industrial sites, not to the public electricity network – was calculated based on capacity changes from Global Energy Monitor, assuming constant utilisation, as utilisation has been very stable year-to-year, as calculated from Central Electricity Authority data.

The difference between coal consumption and dispatch is stock changes, which are estimated by assuming that the changes in the amount of coal stored at end-user facilities mirror those at coal mines, with end-user inventories excluding power, steel and cement assumed to be 70% of those at coal mines, based on comparisons between our data and the IEA World Energy Balances.

Stock changes at mines are estimated as the difference between production at and dispatch from coal mines, as reported by the Ministry of Coal.

Coal consumption is estimated in two ways for sectors beyond power, steel and cement. Consumption of domestic coal in these other sectors is taken from the monthly reports by the Ministry of Coal. Their consumption of imported coal is estimated from the total imports of thermal coal reported by consultancy Kpler, by subtracting demand for imports at coal-power plants. The basis for this assumption is that steel and cement industries use little imported thermal coal, according to Ministry of Coal data.

Product-by-product consumption data for petroleum products, as well as gas use by sector, is from the Petroleum Planning and Analysis Cell of the Ministry of Petroleum and Natural Gas.

As the fuel dispatch and consumption data is reported as physical volumes – such as tonnes or litres – calorific values are taken from IEA’s World Energy Balance and CO2 emission factors from 2006 IPCC Guidelines for National Greenhouse Gas Inventories.

The emissions factor for motor oil or petrol was updated, based on the blending percentage of ethanol each year. The ethanol-blending percentage is as reported by the Ministry of Petroleum and Natural Gas.

Calorific values are assigned separately to different fuel types, including domestic and imported coal, anthracite and coke, as well as to petrol, diesel and several other oil products.

The post Analysis: India’s power-sector emissions flat for two years due to clean-energy surge appeared first on Carbon Brief.

Analysis: India’s power-sector emissions flat for two years due to clean-energy surge

Continue Reading

Climate Change

Nepal flood destruction shows “limits to adaptation”, scientists say

Published

on

There is very little authorities in Nepal could have done to prevent the deaths and devastation caused by the flash flood on its border with Tibet in late August, scientists with the World Weather Attribution (WWA) group have said.

Launching a study that highlighted the role of climate change in causing the glacial rock and ice collapse that triggered the Himalayan flood, WWA co-founder Friederike Otto told reporters that “no amount of local adaptation can fully shield vulnerable people downstream from this scale of destruction”.

The findings released on Thursday are likely to strengthen Nepal’s case for emergency support from the UN’s Fund for Responding to Loss and Damage. Its board members met informally on Wednesday to discuss whether to grant the country a maximum of $20 million towards its estimated $4.8 billion cost of recovery and reconstruction, but no decision has yet been taken.

Nepal’s foreign minister Shisir Khanal told Climate Home News last week that the destructive flood was “exactly the kind of climate-driven catastrophe the Fund was created to address”.

Hard to predict

The WWA study found that rock-ice avalanches are very hard to predict and that moving people out of areas vulnerable to such floods is difficult as their livelihoods revolve around the rivers along which the floods travel.

The recent disaster began on the morning of August 26, when an avalanche started falling beneath a glacier. This caused huge amounts of rocks and glacier ice to fall over a kilometre to a valley floor, where they then picked up more rock and ice and became a flood of debris heading downhill and downstream along the border of Nepal and Tibet.

The torrent entered the narrow Lhende Khola gorge and crashed through the busy Gyirong port border crossing at 170 kilometres an hour. It continued many kilometres downstream before eventually turning from rock and ice to water and slowing down.

The flood swept through villages, roads, bridges and hydropower stations, killing over 1,300 people in Nepal with more than 5,000 still missing. The flood also killed at least 40 people in Chinese-run Tibet.

Those on higher ground away from the river mainly survived but the flood’s speed meant that many people received no warning to seek higher ground or shelter.

While Nepal has early warning systems for flooding caused by rain and glacial lake outbursts, the WWA study noted that rock-ice avalanches are complex and understudied, with methods to monitor them still being explored.

Co-author Walter Immerzeel, mountain hydrology professor at Utrecht University, told journalists that with current methods, the disaster could not have been predicted.

But, he said, in the future it may be possible to use remote sensing techniques to analyse glaciers and rocks to generate a warning before a collapse occurs.

A technique called radar interferometry can detect hotspots which should be monitored with field-based sensors and drones, he said, adding that early warning systems could be installed in these areas using seismometers, water-level measurements and CCTV.

Because doing this for thousands of glaciers across the Himalayas would be difficult, authorities could monitor only the rock and ice faces that are a danger to the river valleys with the most people and infrastructure in them, he added. But this would still require lots of investment together with international collaboration and coordination, he warned.

The study found that another potential adaptation strategy – restricting development in flood-prone river valleys – is socially, economically and politically difficult.

The scientists said habitable land is scarce in these steep river valleys and economic activities like transport and hydropower generation are dependent on the river itself.

Madhab Uprety, a Nepali scientist from the Red Cross Red Crescent Climate Centre, said that, while new development should assess the risks of floods, many existing communities and buildings are already at risk.

Loss and damage

Otto said the flood should be discussed in the context of loss and damage as “there is no doubt that climate change is one of the drivers” and “it’s also one of the types of events that are absolutely outside of the limits we can possibly adapt to”.

As well as the deaths, a Nepali government’s assessment has found that a large amount of infrastructure was damaged, including more than 7,500 homes, 105 bridges, 48 public buildings, 47 cultural heritage assets, 18 schools, 13 hydropower facilities, seven health facilities, and numerous shops, hotels, restaurants, irrigation systems and farms. Over 30,000 people were affected.

Developing countries have called for the loss and damage fund’s board to hold an emergency meeting to discuss how to respond to Nepal’s request for funding. Instead of a full board meeting though, board members met only informally and online on Wednesday, Climate Home News understands. A source with knowledge of discussions said the informal nature of the meeting meant they were not able to take decisions or agree on next steps, which have been left up to the board’s co-chairs.

    Speaking before that meeting started, Nepali climate negotiator Manjeet Dhakal said he had “heard of an extremely positive response” to Nepal’s request from board members. “Hopefully there will be something – a decision that the fund will do for exactly the reason that the fund was established,” he said.

    Ajay Mathur, former Indian climate negotiator and now head of The Energy and Resources Institute in New Delhi, told a separate press briefing on Wednesday that the Nepal flood disaster would push loss and damage higher up the agenda of international climate talks, particularly if the United Nations Secretary-General decides to champion the cause at the UN General Assembly in New York next week.

    Murat Kurum, Turkish environment minister and president-designate of COP31, told Climate Home News last week that he would be “pleased” if the fund could support Nepal and that he will keep calling in every speech for countries to give money to the loss and damage fund.

    Jennifer Morgan, former German climate envoy and now a senior fellow at the Fletcher School of Law and Diplomacy, called for the loss and damage fund – which currently has around $630 million in contributions – to be topped up with new pledges from governments as well as solidarity levies on things like luxury air travel, super-rich individuals and fossil fuel firms’ windfall profits.

    The post Nepal flood destruction shows “limits to adaptation”, scientists say appeared first on Climate Home News.

    Nepal flood destruction shows “limits to adaptation”, scientists say

    Continue Reading

    Trending

    Copyright © 2022 BreakingClimateChange.com