Despite recent shifts in federal energy policies, our analysis shows that the US transition to renewable energy is continuing.
The current administration has enacted a range of changes to prioritise fossil-fuel energy and environmental deregulation in the US, while withdrawing support for renewables.
Yet solar, wind and battery storage accounted for over 90% of new energy capacity in 2025.
This is thanks to the falling cost of renewable energy technologies, investments spurred by the Inflation Reduction Act and Bipartisan Infrastructure Law and local and state policies, according to our research at the Center for Global Sustainability, University of Maryland.
Our analysis examines recent trends in the US energy landscape, focusing on rising electricity demand, new electricity capacity additions and generation, as well as fossil-fuel production and state-level case studies.
Rising electricity demand in the US
A key shift in the calculus is the fact that US electricity demand is now projected to increase rapidly, after a period of relative stagnation.
Between 2005 and 2020, electricity demand was relatively flat, after surging in the 1990s due to growth in the economy and population, as well as rising electrification.
However, as the chart below shows, demand has grown by 7% since 2020 – and this is set to accelerate.
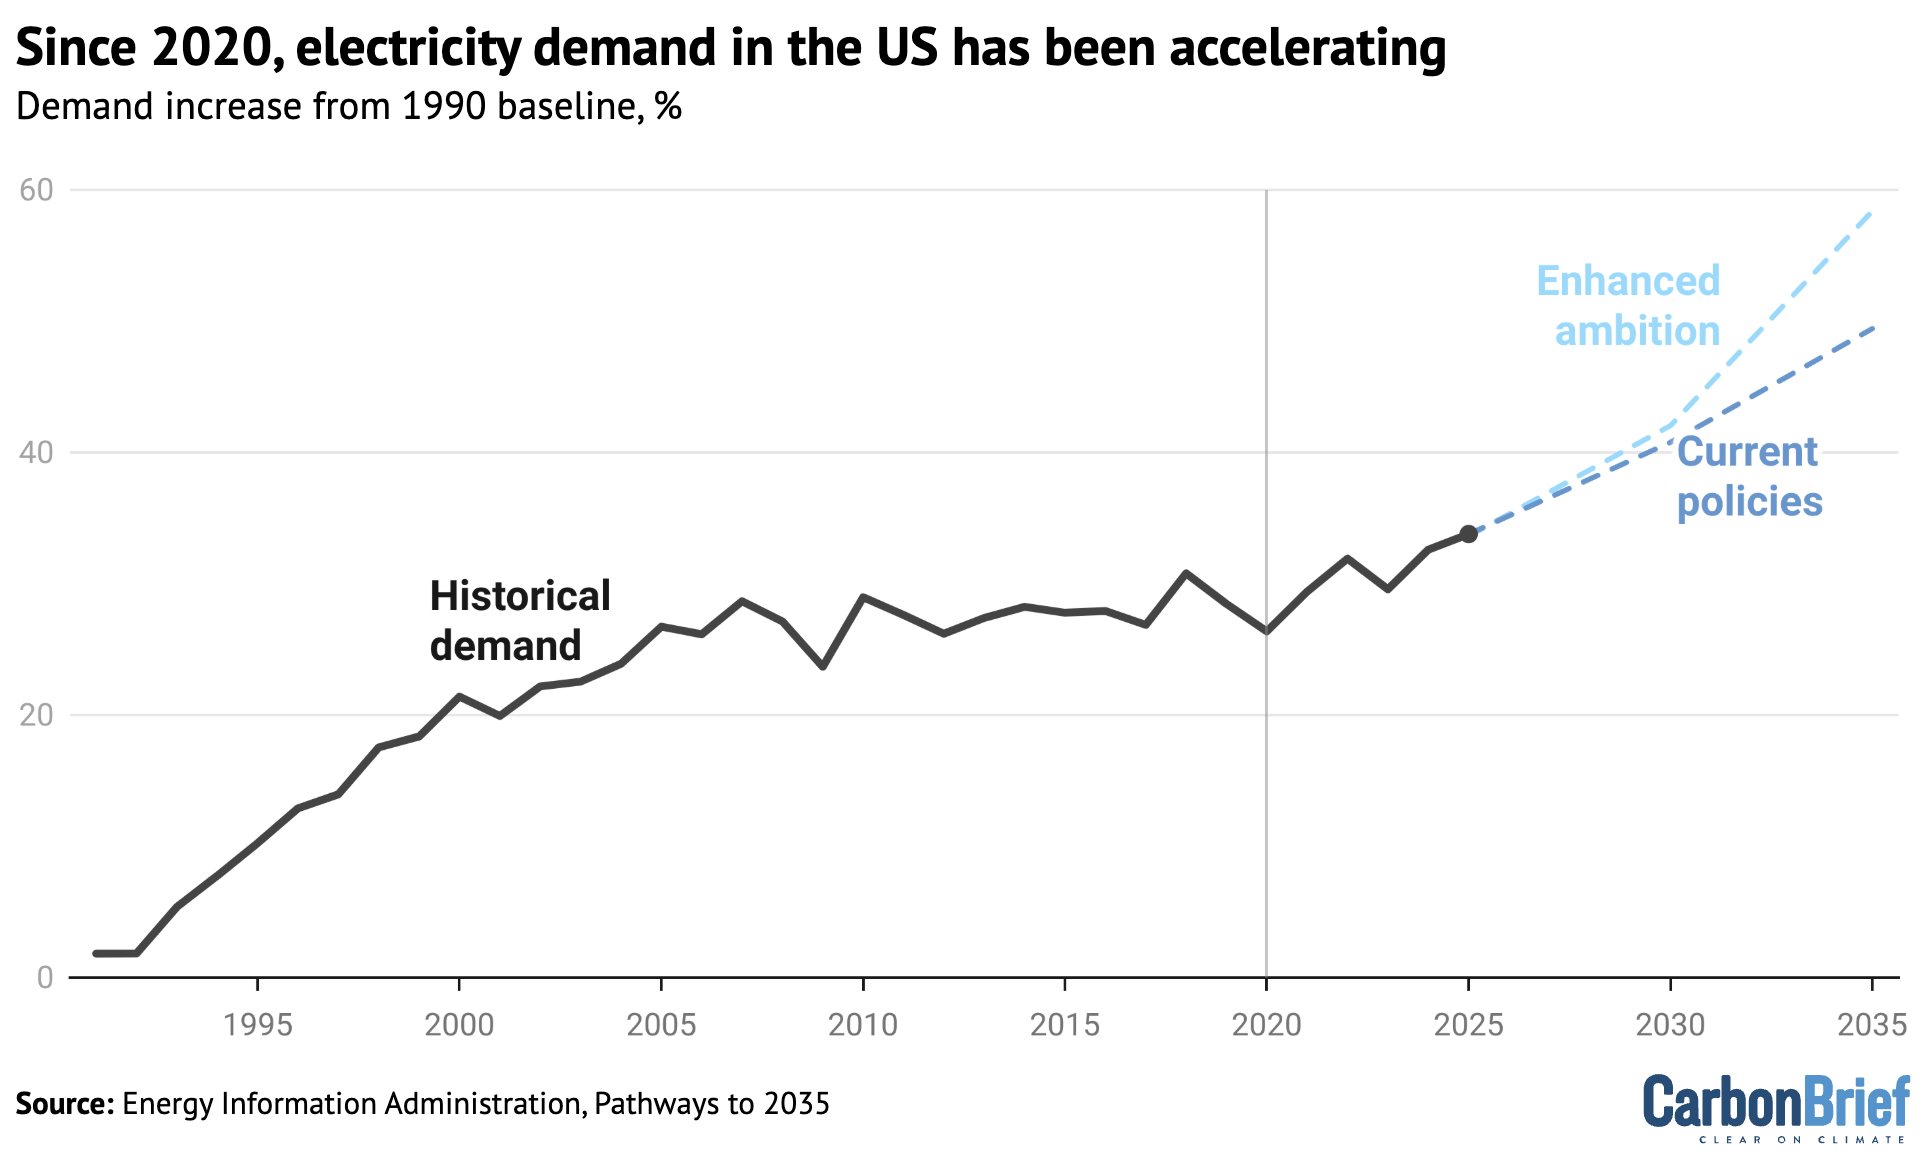
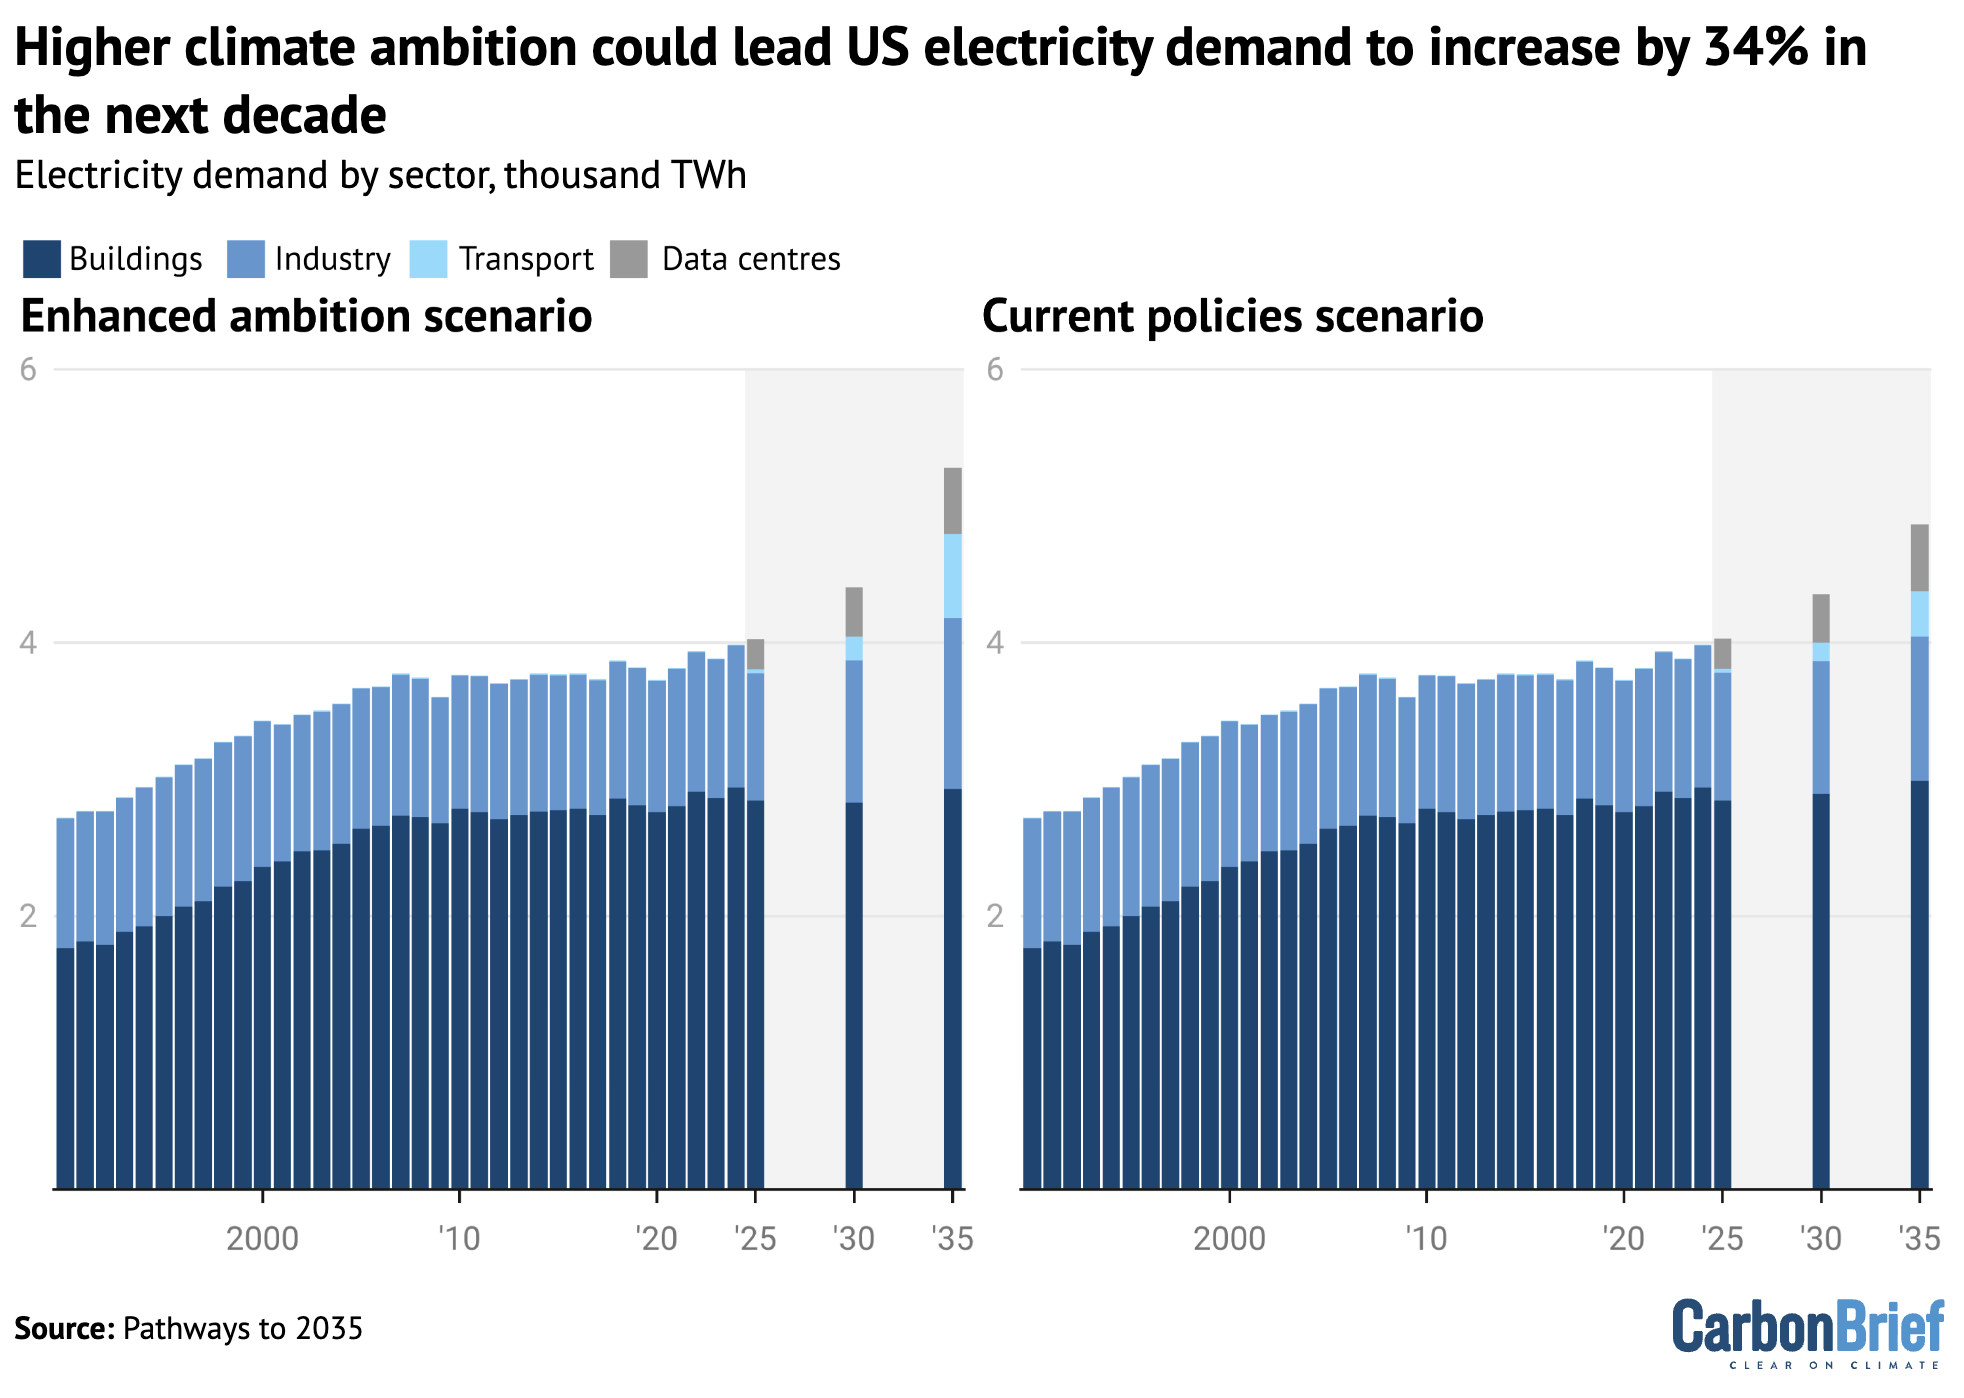
Rising transport electrification, along with new demand from data centres, buildings and industry are expected to drive additional electricity growth in the near term.
Our recent report finds that US electricity demand could increase by 24-34% in the next decade, relative to 2021 levels, as shown in the figure below. It shows that electricity demand would be higher if there is enhanced climate ambition, due to higher shares of electrified transport, industry and buildings.
While demand has been relatively flat over the past decade or two, there have been major shifts in the source of electricity supply over this period.
(Note that changes in generating capacity do not correspond directly to patterns in electricity demand shown earlier.)
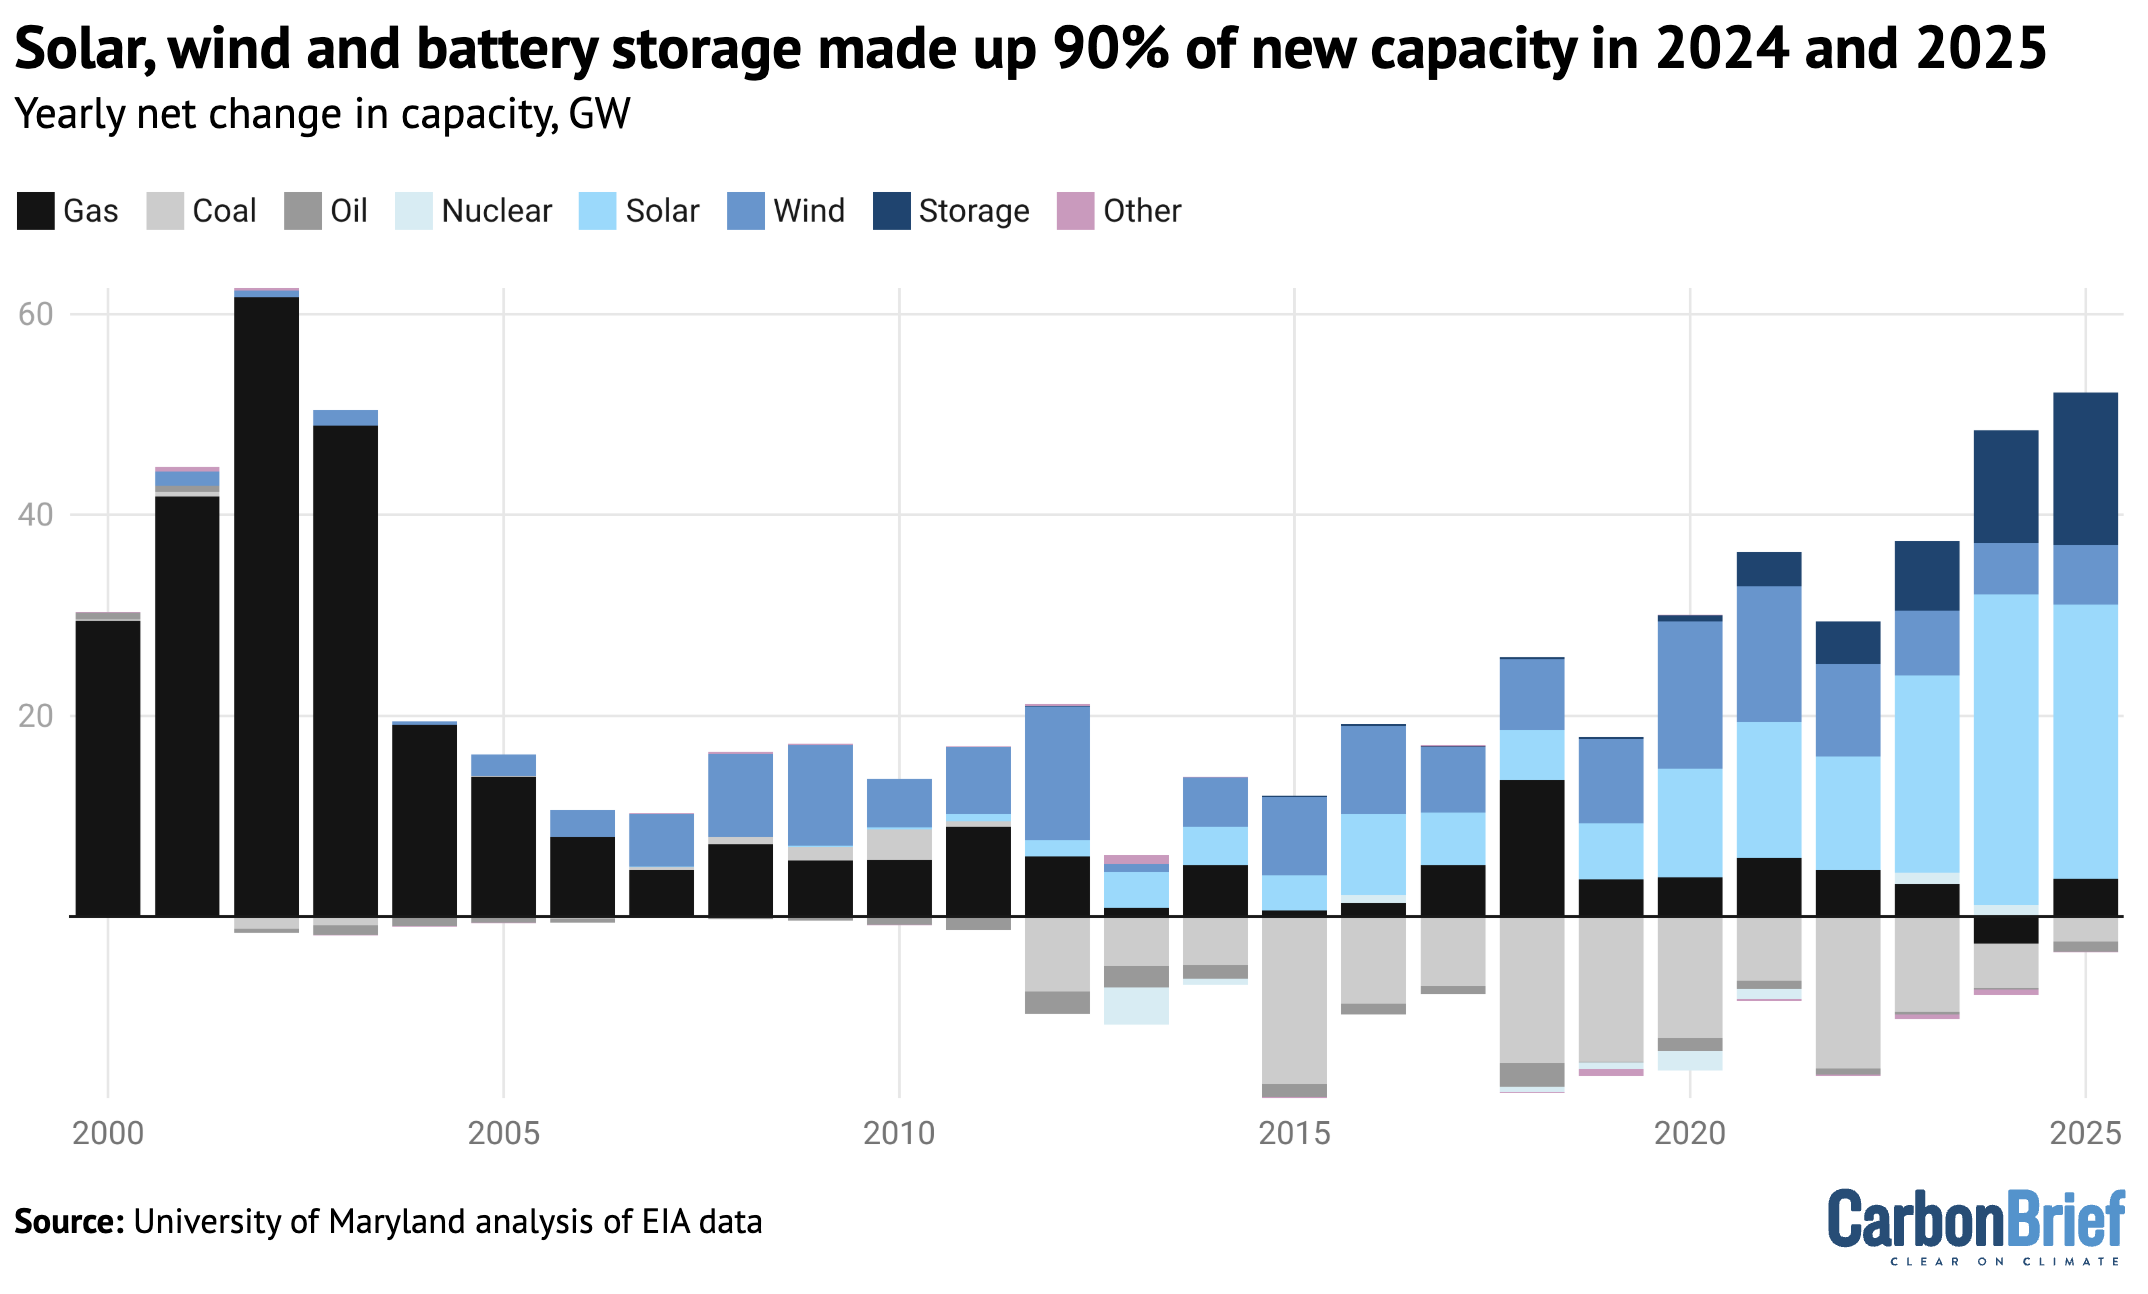
Whereas huge numbers of gas-fired power plants were built in the 2000s, renewable energy has been the primary source of new capacity for the past decade. With demand largely flat, much of this new capacity helped offset the loss from significant coal retirements during this period.
Indeed, capacity additions from renewable energy have outpaced that of every other technology since 2011, according to our research.
Accelerating renewable-energy buildout is increasingly viewed as an immediate, low-cost and practical solution to meet demand growth.
As shown in the figure below, additions of solar, wind and battery storage capacity reached more than 90% of total additions in 2024 and 2025 at 47 gigawatts (GW) and 48GW a year, respectively.
This pace of renewable deployment is attributable to quickly declining costs, driven by improvements in manufacturing technology, maturing supply chains and better economies of scale.
Meanwhile, 112GW of coal capacity was retired over the last decade due to market forces, health concerns and clean-energy policies.
Gas-power additions have remained at a low but steady level, our research shows.
Renewables surpass coal
As a result of the shifts in generating capacity, solar generation has increased nearly tenfold over the last decade, while wind generation has doubled.
As such, solar and wind reached 9% and 10% of the generation mix last year, respectively, as shown in the chart below.
Coal generation has fallen by more than 50% over the same period, replaced by a combination of renewables and gas, which has risen steadily.
(Note that coal-power output increased in 2025, primarily due to higher gas prices, while federal policy changes forced some old plants to stay open.)
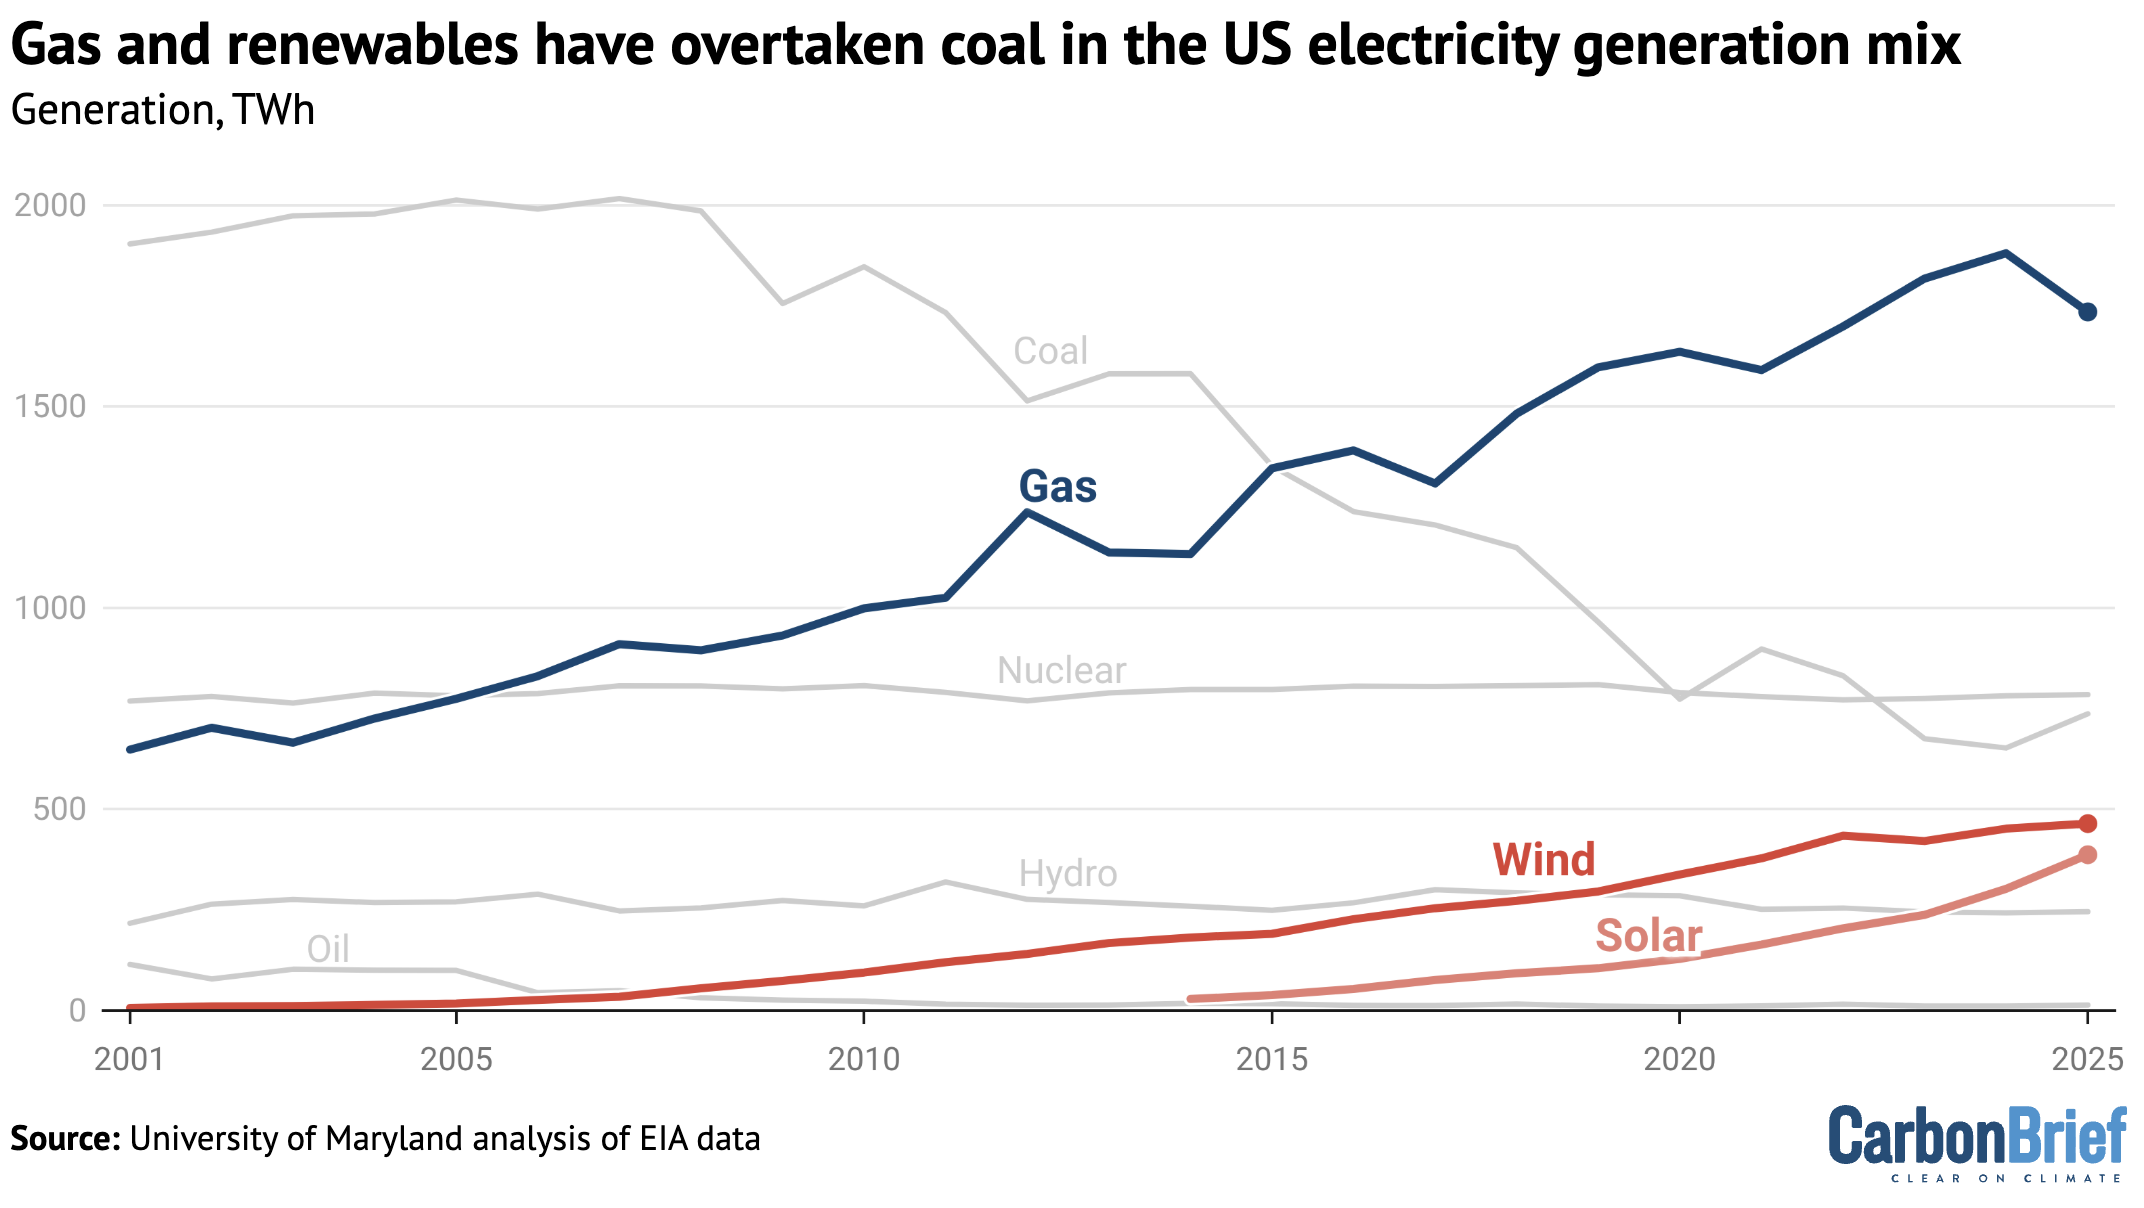
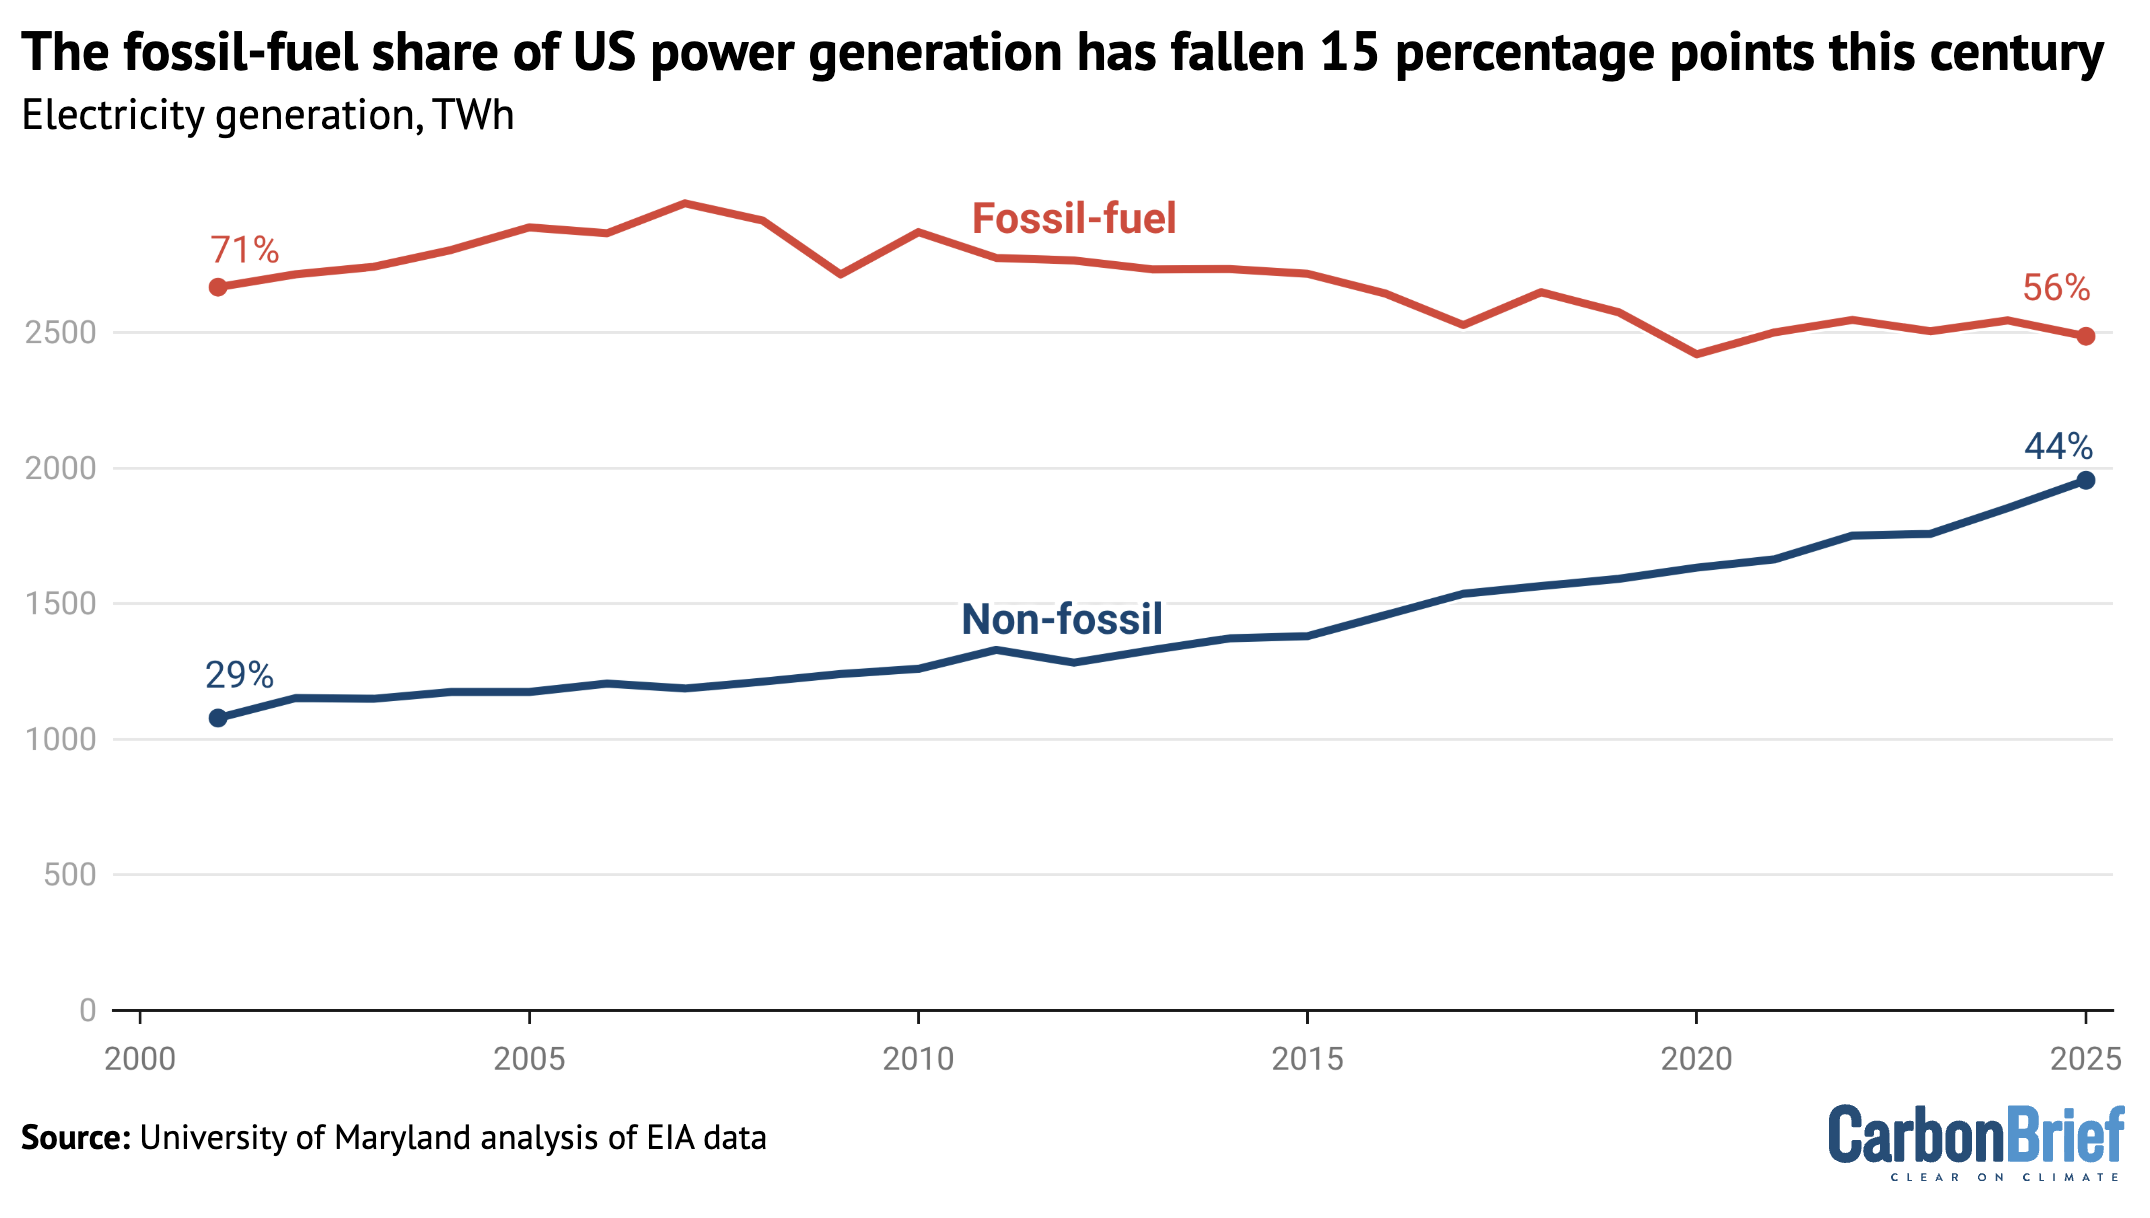
Gas generation has steadily increased in the US, reaching a 39% share of the generation mix last year. Roughly speaking, the growth in wind and solar – around 600 terawatt hours (TWh) – in the past decade was sufficient to match the decline in coal generation, while growing gas generation covered the roughly 300TWh increase in demand through 2025.
As a result, as shown in the figure below, fossil-fired electricity as a whole has fallen to 56% of the mix.
Our research shows that a rapid renewable energy buildout is occurring across states regardless of political allegiance, driven by strong economic advantages, policies such as state “renewable portfolio standards” and other environmental and health benefits.
Over the last decade, land- and wind-rich states such as Texas, Oklahoma and Iowa, have accounted for 62% of new wind capacity. Meanwhile, “sun-belt” states such as Texas, California and Florida have built 52% of new solar capacity.
Clean-energy policies have further driven renewable deployment. For example, California has a binding law requiring 100% of electricity to come from renewable and zero-carbon energy sources by 2045, with an interim target of 60% by 2030.
This has contributed to a 44% renewable generation share in the state in 2025, up from 16% only a decade ago.
Similarly, New Mexico has a legislated goal to reach 80% renewable electricity by 2040 and 100% zero-carbon electricity by 2045.
More than half of New Mexico’s electricity is now generated by renewables, up from only 9% in 2015. The state’s 3.5GW SunZia wind and transmission project is set to be the largest renewable energy project in the western hemisphere when completed.
At the same time, our research suggests that the increasing partisanship of climate policy has been a key barrier for many states.
Some states have tried to restrict climate action, spanning a potential solar-farm construction moratorium in Alabama to a ban on net-zero policy and greenhouse-gas regulation in Florida.
Renewables transcending politics
Importantly, the factors driving the transition to renewables are now frequently transcending politics.
Our research shows that lower cost, quick-to-deploy and energy-secure renewables make practical sense in many market contexts in the US – and globally. Businesses, local governments and consumers are voting with their wallets to address immediate needs.
For example, Texas leads the nation in renewable-energy expansion, despite its lack of decarbonisation goals. Texas’ deregulated power grid and lighter permitting processes, combined with its abundant renewable resources and falling technology costs, have increased renewable electricity capacity to nearly 90GW in 2025.
The state now generates more power from solar farms than coal plants.
Public health is another driver of the clean-energy transition that transcends politics, our research suggests. Oregon, for example, passed a law in 2016 to phase out all coal-generated electricity by 2035, which the state deemed “necessary for the immediate preservation of…public health and safety”.
Data centre development and energy affordability are also shaping state policy landscapes.
Virginia – which has the highest number of data centres of any US state – just passed new laws to allow for more efficient grid utilisation and to shift energy costs towards data centres while assisting low-income households with energy efficiency improvements.
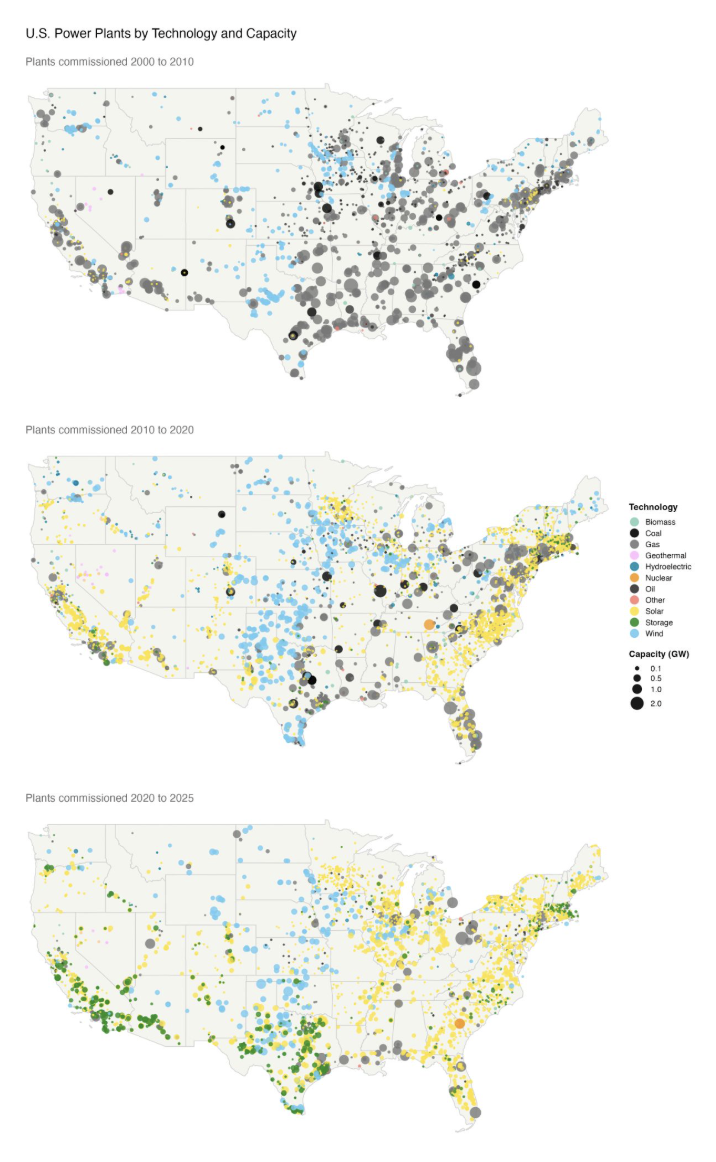
The figure below shows how widespread renewable-energy development now crosses state and political divides, even though it remains constrained to some extent by geography.
Between 2010 and 2020, state and federal policies helped spur renewable energy, with particularly strong growth in states like California and North Carolina.
More recently, declining costs and improving economics have become increasingly important drivers of renewable energy expansion, even amid increasing political and policy setbacks in some regions. This has contributed to a broader dispersion of solar and wind deployment across US states between 2020 and 2025.
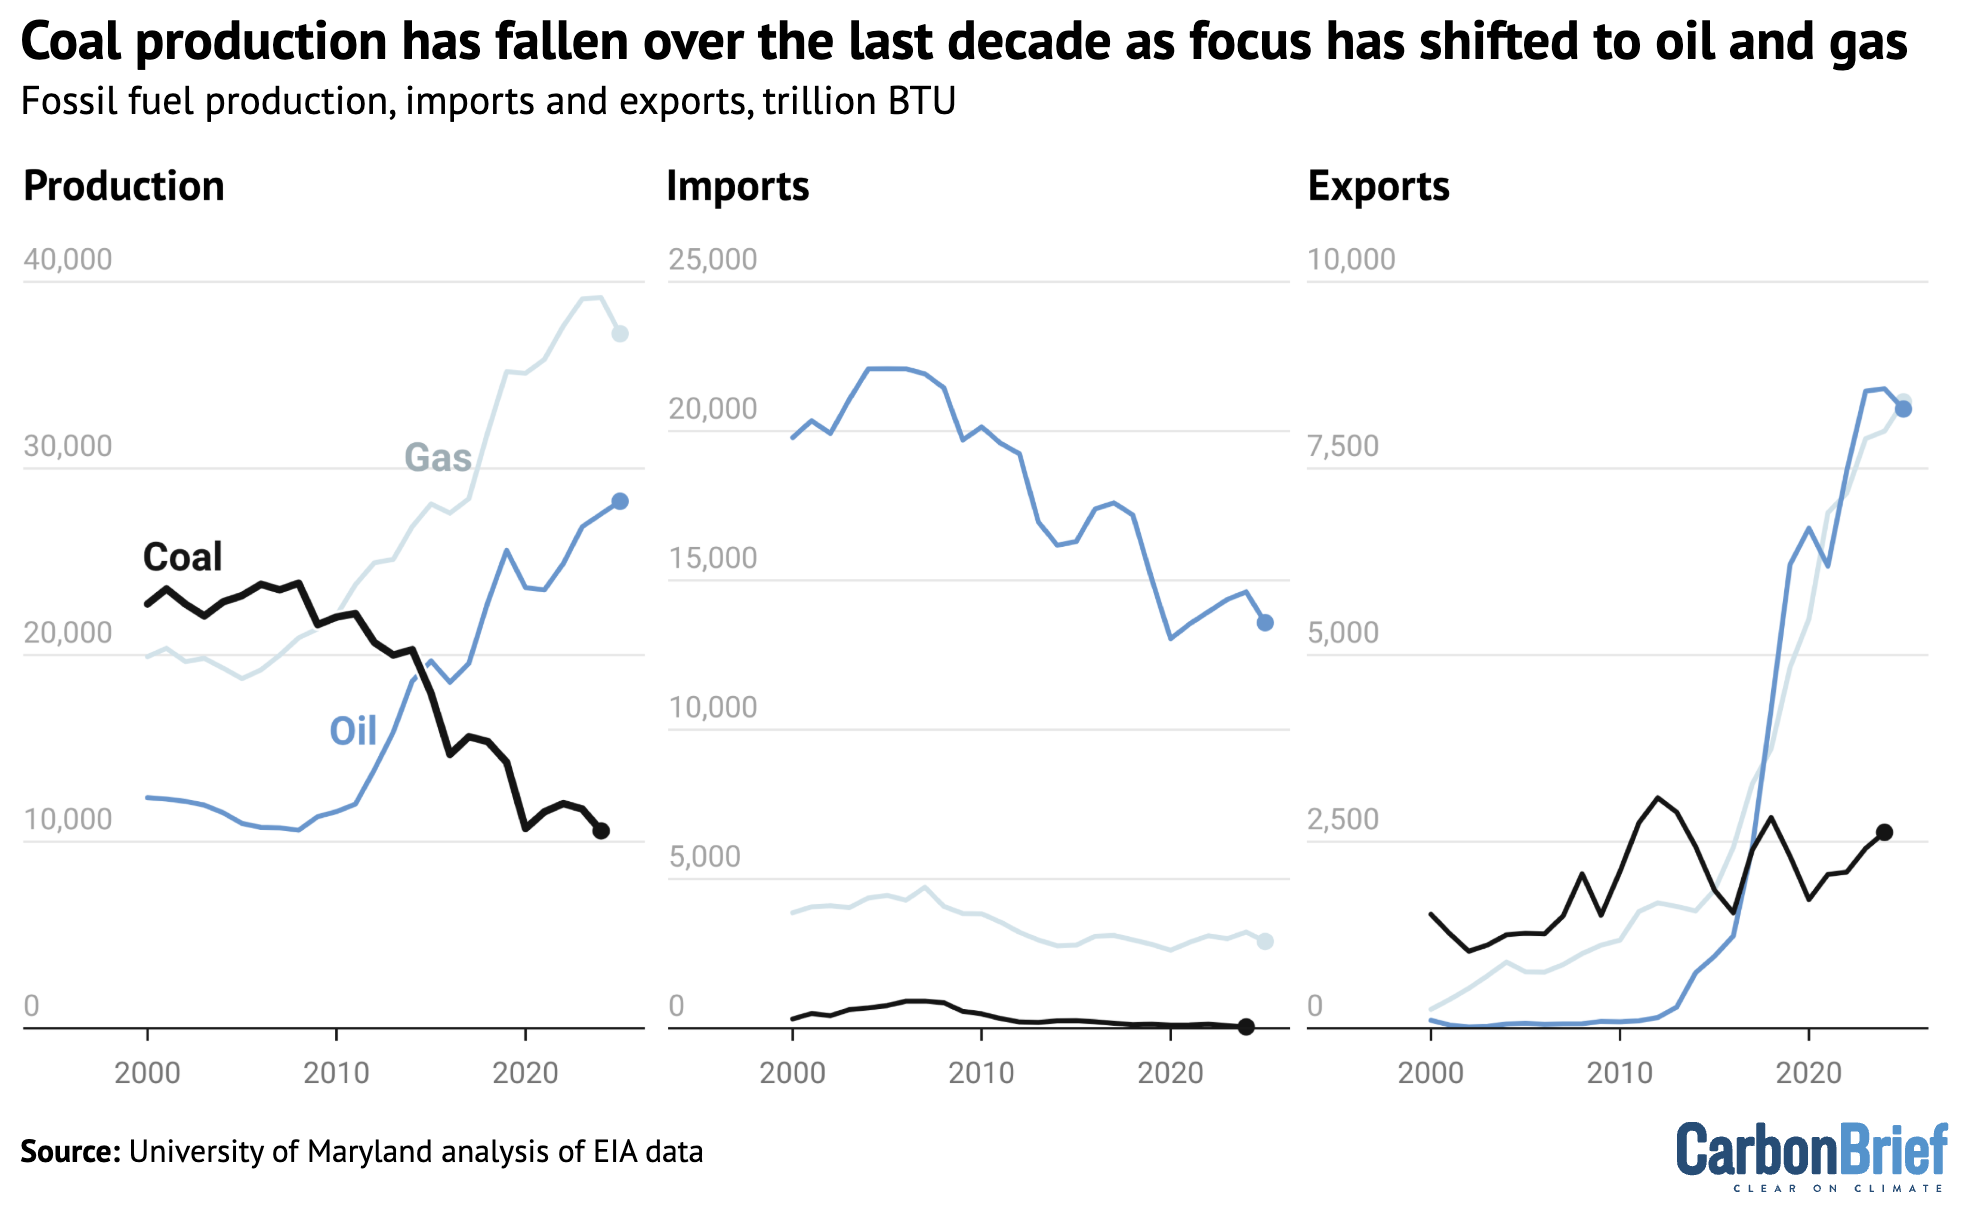
While most domestic economic sectors are still fossil-fuel heavy and current US energy security priorities promote continued fossil production, this fossil-fuel reliance has shifted over the past decade away from coal mining towards oil and gas drilling.
Coal production has fallen more than 40% over the last decade, tracking the decline in domestic coal consumption, as shown by the red line in the lower figure below.
In contrast, oil and gas production and exports have grown steadily since 2008, with the US becoming a net liquified natural gas (LNG) exporter over the last decade.
However, recent upheavals in the Middle East have underscored the country’s continued exposure to global fossil- energy markets.
Our research shows that renewable energy deployment in the US today is rooted in its practicality and cost-effectiveness. These advantages are allowing it to outcompete fossil-fuel technologies in terms of electricity capacity expansion, even across varying political landscapes.
Nevertheless, policy continues to influence the sector.
Coupled with parallel strategies for vehicle transport electrification, renewable deployment would offer lowered risks to consumers and businesses from fossil-fuel price volatility.

The post Guest post: How US renewable-energy growth persists despite federal policy uncertainty appeared first on Carbon Brief.
Guest post: How US renewable-energy growth persists despite federal policy uncertainty

Next week, diplomats from around the world will descend on Yerevan, Armenia, to negotiate a series of decisions under the UN Convention on Biological Diversity (CBD).
Between 19 and 30 October, 196 parties will gather to hammer out the precise wording of the dozens of legal texts that make up the decisions under the Conference of the Parties (COP) to the CBD.
This year’s summit is particularly significant, as it marks the halfway point between the agreement of the Kunming-Montreal Global Biodiversity Framework and the deadline for achieving its targets.
The CBD has found that countries are currently not on track to meet 22 out of the framework’s 23 targets.
During the fortnight, delegates will also be negotiating decisions relating to the two supplemental protocols to the CBD: the Cartagena Protocol, which covers biosafety; and the Nagoya Protocol, which covers access and benefit-sharing for the use of genetic resources.
(The Cartagena and Nagoya Protocols, which are each governed by a “meeting of the parties”, or “MOP”, have fewer parties than the CBD as a whole, with 173 and 141, respectively.)
Carbon Brief is tracking the progress of countries towards consensus on dozens of negotiating texts using the interactive table below.
The tracker includes texts from the COP, as well as the MOPs for the Cartagena and Nagoya protocols. It also includes draft decisions from the most recent subsidiary body meetings, as these form the starting point for the negotiations in Yerevan.
The CBD has three subsidiary bodies: the subsidiary body on scientific, technical and technological advice (SBSTTA), the subsidiary body on implementation (SBI) and the subsidiary body on article 8(j) and other provisions (SB8J).
SB8J focuses on issues related to the Indigenous peoples and local communities. It was established at COP16 in Cali, Colombia, in 2024.
The first two columns of the interactive tracker list the topic of each agenda item and the relevant body, with subsequent columns including dates, page counts and links to the original documents.
The table is searchable and can be sorted using the arrows in the header.
Areas of disagreement in UN draft texts are denoted by square brackets. Counting the brackets in a particular iteration of a text therefore gives a sense of how far parties are from reaching consensus.
The bracket column is colour-coded, with dark green indicating a low number of brackets and red indicating a high number of brackets remaining.
Texts can also present parties with choices using “options” or alternatives (“alt”), which are counted together in the sixth column of the table.
The key discussions in Yerevan will centre around two agenda items in particular. The first is the global review, which will assess progress towards the GBF and make recommendations for accelerating action.
The second is finance, which can be separated into two parts: resource mobilisation and the financial mechanism. On resource mobilisation, biodiverse global south countries are likely to push for an increased amount of international finance for conservation.
Disagreement over the creation of the financial mechanism led to the suspension of COP16 in Cali in October 2024, as parties failed to find agreement on the mobilisation of finance before the end of the summit.
Global south countries want the establishment of a separate financial mechanism under the control of the CBD; global north countries largely prefer to maintain the existing mechanism, which sits under the Global Environment Facility.
At the resumed session of COP16 in Rome in early 2025, countries agreed on a roadmap that would lead to the establishment of a permanent mechanism.
related

Analysis: Lula presidency saved at least 20,000km2 of Brazilian Amazon since 2022
Why land-use emissions have fallen by a third this century – in six charts

Analysis: 84% of nations miss deadline to identify ‘nature-harming’ subsidies by 2025

UK withdraws millions in funding from world’s second-largest rainforest in Congo
The post Interactive: Tracking negotiating texts at the COP17 biodiversity summit appeared first on Carbon Brief.
Interactive: Tracking negotiating texts at the COP17 biodiversity summit
A beacon of love
On an outer island of Fiji, two thousand nautical miles from Sydney, is a shining light of hope and resilience for our troubled world.
The island of Kioa is home to a Tuvaluan community who migrated from their atoll of Vaitupu in the late 1940s. It is a land of warm hearts, big smiles, and deep cultural roots; a place where the sound of a conch still summons the island together, where islanders paddle out to fish in carved outrigger canoes, and healthy happy children walk barefoot to school.
Here, culture is life. Kioans live sustainably through their traditional knowledge and practices. The island is alive with song, dance and the rhythms of a life tied to the tides, the winds, and the seasons.