
Disseminated on behalf of West Red Lake Gold Mines Ltd.
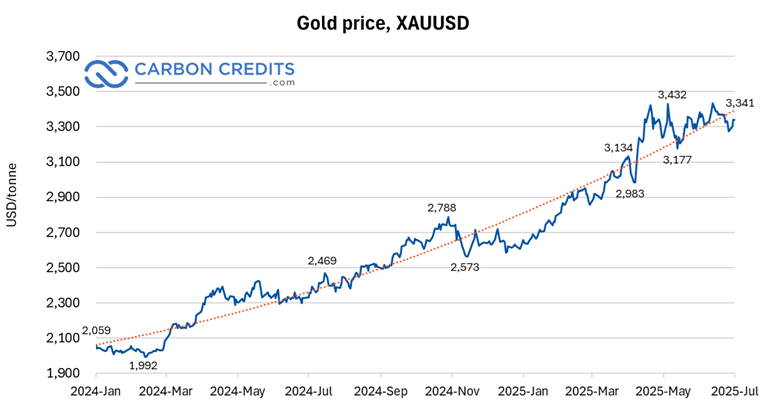
While tech stocks and rate cuts dominate headlines, gold has quietly broken out. With prices averaging near $2,900/oz in Q1 2025 and $3,290/oz in Q2, miners are seeing an earnings explosion. This rally seems to be fuelled by Western investors becoming interested in gold after the yellow metal gained 93% % from 2020 to 2025, driven by strong physical demand from Asia and central banks.
Now miners are raking in profits. And this silent bull market could be just getting started. Let’s dive deeper.
Q1 2025: Gold Miners’ Profits Explode
- Mid-Tier Miners: The top 25 companies in the GDXJ index saw revenues jump 26.8% YoY, with all-in sustaining costs (AISC) averaging $1,378/oz, leaving margins at record highs.
- Wesdome Gold Mines: Reported a 365% YoY increase in gross profit and a nearly fivefold jump in net income, as Q1 gold production rose 37% and AISC fell 17% to $1,366/oz. The average realized gold price was $2,882/oz, driving margins and cash flow to new highs.
- Newmont Corporation: The world’s largest gold miner delivered 1.5 million ounces in Q1 and a record $1.2 billion in free cash flow. With these numbers, the company stays on track to meet its 2025 targets with a strong gold portfolio for shareholders.
Newmont’s Playbook: Cheap Today, Explosive Tomorrow
Newmont is the world’s largest gold producer. It’s currently trading at about 7x earnings. This is surprisingly low given its top-tier assets and strong cash flow. But with gold at record levels and persistent macroeconomic uncertainty prompting Western investors to invest in the yellow metal and the companies that produce it, a re-rating to 15x earnings looks entirely possible, given that gold miners have been valued at 22x earnings in past gold cycles.
Let’s once again ponder the Q1 figures. For starters, Newmont generated $1.2 billion in free cash flow, and its profit hit 27%, showing operational strength.
If investors come back to gold, Newmont could lead the charge and set the tone for others.
WRLG: Junior Miner, Big Potential
Now let’s talk about West Red Lake Gold (TSXV: WRLG; OTCQB: WRLGF), a junior miner transitioning into a producer. It’s a classic under-the-radar story. But that could change.
Here’s why:
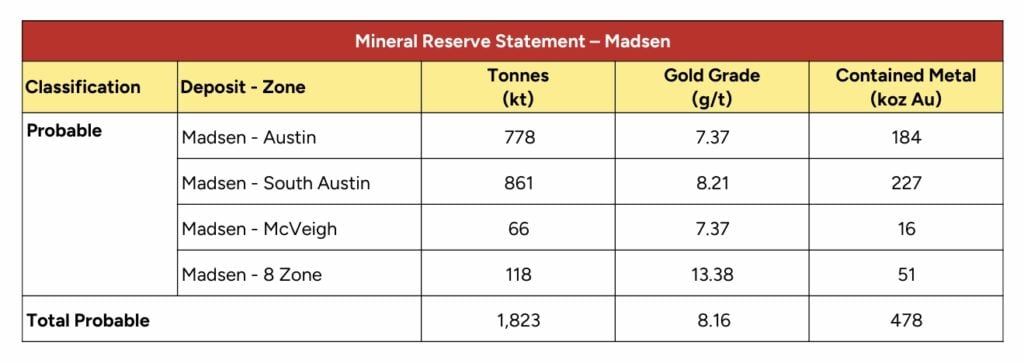
- WRLG just restarted the high-grade Madsen Mine
- It’s moving from zero revenue to cash flow
- Companies starting new gold mines can be particularly attractive for investors wanting exposure to a rising gold price because the value of new production layers on top of increased revenues
- A shift to 15x earnings isn’t crazy – it’s been done before
WRLG doesn’t need gold to go higher; it just needs to hit its own targets. If it does, investors could start to value the company as a successful new gold miner, just as the market potentially also starts to give gold miners higher valuations relative to cash flows.
Can WRLG Go from New Miner to 15x Producer?
1. Ramping up the Madsen Mine
WRLG just restarted the Madsen Mine. It now needs to ramp the operation up, from the ~60% level it started at to full scale by the end of the year. Doing this smoothly and successfully would build confidence in the Madsen Mine and support a shift towards valuing West Red Lake Gold as a producing gold miner..
2. Achieving Commercial Production
The moment WRLG poured its first gold, it shifted from a high-risk developer to a real producer. Cash flow began. The value of the operation will become clear when WRLG declares commercial production, something mines usually do after ramping up to target mining rates, and starts reporting on costs and revenues. Margins matter.
3. Getting the Market’s Attention
If WRLG delivers consistent production, it could move to a 7x earnings multiple, in line with other gold miners. The market rewards execution. WRLG just needs to stick the landing.
4. Boost from Unlocking More at Madsen
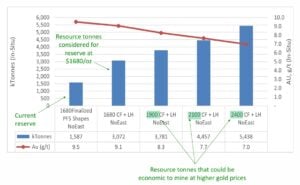
The Madsen Mine plan is a conservative plan to get the mine back in action. It outlines a nice mine – but there are multiple opportunities to unlock more value at Madsen, from using a less conservative approach and therefore, mining more of the deposit at lower costs to adding two nearby, defined, WRLG-owned deposits to the mine plan.
What Could Go Wrong?
WRLG still faces challenges, and some of them are:
- Execution risk: delays or cost overruns can hurt timelines
- Operational ramp-up: hitting production targets is crucial
- Market recognition: It takes time for investors to re-rate juniors
But these are standard hurdles for any miner. WRLG’s roadmap is clear, and management is quickly checking off milestones.
Could Underground Mining Boost WRLG’s Valuation?
Underground mining often brings higher grades and lower surface disruption—investors like that. The Madsen Mine sits in a known gold belt, giving WRLG added credibility. If the company can sustain production and control costs, it may earn the valuation premium typically reserved for proven underground producers in Top Tier jurisdictions.
Gold’s breakout has already changed the game for producers like Newmont. But the real story might be at the junior level. WRLG is flipping the switch from developer to producer, creating new value, and is working to unlock significant additional value along the way.
If gold stays above $3000, feeding big profits for gold miners, and generalist investors really start to rotate into the gold sector, a sector-wide re-rating to 15x earnings could drive significant upside. The market ignored gold’s move, but now it can’t ignore the profits.
And there are very few new gold producers like WRLG who are ready for the opportunity.
DISCLAIMER
New Era Publishing Inc. and/or CarbonCredits.com (“We” or “Us”) are not securities dealers or brokers, investment advisers or financial advisers, and you should not rely on the information herein as investment advice. West Red Lake Gold Mines Ltd. made a one-time payment of $30,000 to provide marketing services for a term of 1 month. None of the owners, members, directors, or employees of New Era Publishing Inc. and/or CarbonCredits.com currently hold, or have any beneficial ownership in, any shares, stocks, or options in the companies mentioned. This article is informational only and is solely for use by prospective investors in determining whether to seek additional information. This does not constitute an offer to sell or a solicitation of an offer to buy any securities. Examples that we provide of share price increases pertaining to a particular Issuer from one referenced date to another represent an arbitrarily chosen time period and are no indication whatsoever of future stock prices for that Issuer and are of no predictive value. Our stock profiles are intended to highlight certain companies for your further investigation; they are not stock recommendations or constitute an offer or sale of the referenced securities. The securities issued by the companies we profile should be considered high risk; if you do invest despite these warnings, you may lose your entire investment. Please do your own research before investing, including reading the companies’ SEDAR+ and SEC filings, press releases, and risk disclosures. It is our policy that information contained in this profile was provided by the company, extracted from SEDAR+ and SEC filings, company websites, and other publicly available sources. We believe the sources and information are accurate and reliable but we cannot guarantee it.
CAUTIONARY STATEMENT AND FORWARD-LOOKING INFORMATION
Certain statements contained in this news release may constitute “forward-looking information” within the meaning of applicable securities laws. Forward-looking information generally can be identified by words such as “anticipate”, “expect”, “estimate”, “forecast”, “planned”, and similar expressions suggesting future outcomes or events. Forward-looking information is based on current expectations of management; however, it is subject to known and unknown risks, uncertainties and other factors that may cause actual results to differ materially from the forward-looking information in this news release and include without limitation, statements relating to the plans and timing for the potential production of mining operations at the Madsen Mine, the potential (including the amount of tonnes and grades of material from the bulk sample program) of the Madsen Mine; the benefits of test mining; any untapped growth potential in the Madsen deposit or Rowan deposit; and the Company’s future objectives and plans. Readers are cautioned not to place undue reliance on forward-looking information.
Forward-looking information involve numerous risks and uncertainties and actual results might differ materially from results suggested in any forward-looking information. These risks and uncertainties include, among other things, market volatility; the state of the financial markets for the Company’s securities; fluctuations in commodity prices; timing and results of the cleanup and recovery at the Madsen Mine; and changes in the Company’s business plans. Forward-looking information is based on a number of key expectations and assumptions, including without limitation, that the Company will continue with its stated business objectives and its ability to raise additional capital to proceed. Although management of the Company has attempted to identify important factors that could cause actual results to differ materially from those contained in forward-looking information, there may be other factors that cause results not to be as anticipated, estimated or intended. There can be no assurance that such forward-looking information will prove to be accurate, as actual results and future events could differ materially from those anticipated in such forward-looking information. Accordingly, readers should not place undue reliance on forward-looking information. Readers are cautioned that reliance on such information may not be appropriate for other purposes. Additional information about risks and uncertainties is contained in the Company’s management’s discussion and analysis for the year ended December 31, 2024, and the Company’s annual information form for the year ended December 31, 2024, copies of which are available on SEDAR+ at www.sedarplus.ca.
The forward-looking information contained herein is expressly qualified in its entirety by this cautionary statement. Forward-looking information reflects management’s current beliefs and is based on information currently available to the Company. The forward-looking information is made as of the date of this news release and the Company assumes no obligation to update or revise such information to reflect new events or circumstances, except as may be required by applicable law.
For more information on the Company, investors should review the Company’s continuous disclosure filings that are available on SEDAR+ at www.sedarplus.ca.
Please read our Full RISKS and DISCLOSURE here.
The post Gold’s Big Comeback: Can WRLG Follow Newmont’s Path to a 15x Earnings Boom? appeared first on Carbon Credits.
Key takeaways
- SBTi is the default reference point for corporate climate action: 51% of Fortune Global 500 companies now hold net-zero targets, up from 8% in 2020, and over 11,000 organizations worldwide have SBTi-validated targets.
- Net Zero Standard V2 redefines climate leadership as reducing emissions and mitigating ongoing emissions, not reduction alone.
- The new standard adds flexibility through five-year cycles, a “best efforts” standard, and an Asset Transition Method for companies whose path to net-zero doesn’t fit a straight-line trajectory.
- Voluntary carbon credits are formally recognized for the first time, with reduction and removal credits accepted from 2027, and removals required from 2035.
- Companies with 2030 targets keep using V1 for their current cycle and move to V2 in 2028; companies without targets can start using V2 on February 1, 2027.
Why every business needs to understand the SBTi Net-Zero Standard revision
The Science Based Targets initiative (SBTi) has become the default reference point for credible corporate climate action. Net-zero targets are now held by 51% of Fortune Global 500 (FG500) companies, up dramatically from just 8% in 2020, and more than 11,000 organizations worldwide have set SBTi-validated targets.
However, SBTi’s influence extends well beyond the companies formally participating in the program. Every business in the value chain of an SBTi participant will have to reduce its own carbon emissions, and businesses that aren’t SBTi participants themselves still look to the program for guidance on climate action.
In short, SBTi gives every business a credible blueprint for climate action, and companies that follow its principles can pursue climate action with confidence, whether or not they’re formally part of the program.
How will the Net Zero Standard revision affect business climate action?
SBTi participation is expected to grow. Despite strong target-setting participation among the F500, only 17% of companies use the SBTi Net Zero Standard V1 beyond target setting, largely because its rules have been seen as too rigid to apply in practice. Much of the Net Zero Standard revision has focused on creating more flexibility to enable higher participation. Medium and small businesses will also increasingly feel pressure for climate action, since SBTi mandates that its participants reduce carbon emissions across their value chains.
Net Zero Standard V2 also redefines climate leadership: leading climate action now means reducing emissions and mitigating ongoing emissions. Reducing your own emissions while ignoring the emissions you continue to release along the way is no longer considered leadership. Supporting voluntary carbon projects with high-integrity carbon credits is now backed by the leading authority on corporate climate action.
What lessons shaped the Net Zero Standard V2 revision?
The revision reflects a few learnings about what actually drives climate progress, and how SBTi built those lessons into the new standard.
| Net Zero Standard V1 Learnings | Net Zero Standard V2 Implementation |
|---|---|
| Making real short-term progress is more important and more difficult than making big long-term promises | Focus on short-term climate progress |
| Every company has a different path to net zero that doesn’t always fit generalized net-zero rules | Create asset transition plans based on each company’s unique asset lifecycles and capital planning |
| We need to mitigate our ongoing emissions to keep global carbon emissions in check | Reduce global carbon emissions by financing voluntary carbon projects with high-integrity carbon credits |
What are the key changes between the old and new Net Zero Standard?
Both versions of the standard are grounded in net-zero by 2050. However, the old standard treated climate leadership as simply reducing emissions, expected a long-term commitment to net zero, based emission reduction targets on generalized net-zero goals, revoked status from companies that fell behind on targets, and ignored voluntary carbon projects entirely.
The new standard treats climate leadership as reducing emissions and mitigating ongoing emissions. It shifts the focus to short-term progress through five-year cycles, and it bases emission reduction targets on both the net-zero goal and a company’s own asset decarbonization plan. A new Asset Transition Method lets companies set decarbonization targets through asset plans with committed, verifiable steps; an ambitious but achievable path based on a company’s starting point, financial resources, and technology, with multiple pathways to reflect the unique opportunities and constraints of different industries and companies.
Crucially, the new standard moves to a “best efforts” basis that creates real flexibility on progress against targets. Businesses that miss their targets can keep their status if they’ve used “every lever” within their control, and minimum progress rules will be set out in the SBTi Assurance Manual.
Finally, the new standard formally uses voluntary carbon projects to mitigate ongoing emissions. From 2027 through 2034, this mitigation is recognized, and both carbon reduction and removal credits are accepted. From 2035 forward, mitigation with carbon removal credits becomes required, with durability matching between the removal and the emission it offsets.
| Old Net Zero Standard | New Net Zero Standard |
|---|---|
| Grounded in net-zero by 2050 | Grounded in net-zero by 2050 |
| Climate leadership is reducing emissions | Climate leadership is reducing emissions and mitigating ongoing emissions |
| Make a long-term commitment to net-zero | Focus on short-term progress in 5-year cycles |
| Emission reduction targets are based on net-zero goal |
|
| Businesses who fall behind targets lose status |
|
| Ignores voluntary carbon projects |
|
When does the new Net Zero Standard take effect?
Companies with existing 2030 targets should continue using the old Net Zero Standard for their current cycle, and start using the new Net Zero Standard in 2028 to set targets for the next cycle (2030–2035).
Companies that don’t yet have targets can use the new Net Zero Standard starting February 1, 2027.
What are SBTi’s Category A and Category B companies?
The new Net Zero Standard splits companies into two categories, with different requirements attached to each.
Category A covers large companies from all countries and medium-sized companies from high-income countries. A company from any country qualifies if it meets at least one of: net turnover of €450 million or more, or 1,000 or more full-time employees. A company from a high-income country qualifies if its Scope 1 and 2 emissions are 10,000 tCO2e or more, or if it meets at least two of: balance sheet of €25 million or more, net turnover of €50 million or more, or 250 or more full-time employees.
Category B covers small companies from all countries and medium-sized companies from lower-income countries.
How do Scope 1 targets work under Net Zero Standard V2?
Scope 1 targets aim to transition companies to net-zero direct emissions by 2050 or sooner, and companies can choose from three approaches.
- Absolute emissions reduction follows a straight-line emissions trajectory from the target base year to the net-zero year.
- Emissions intensity reduction lets companies follow sector-specific pathways designed to reflect the reduction opportunities available in sectors like steel, cement, or chemicals.
- Asset transition is designed for companies whose capital stock turnover doesn’t follow a linear or sector pathway. These companies design a transition plan to operate existing assets efficiently and replace them with low-carbon assets, using predetermined milestones.
How do Scope 2 targets work under Net Zero Standard V2?
Scope 2 targets address emissions from purchased electricity through three pathways:
- Reducing electricity consumption,
- Reducing grid consumption by installing onsite or direct-line offsite clean energy generation, and
- Cleaning up the regional grid using market-based tools like PPAs, RECs, and GOs that drive clean energy development.
V2 introduces a dual Scope 2 framework requiring two separate targets, with an overall goal of 100% low-carbon electricity by 2040.
The location-based target addresses the carbon intensity of a company’s physical power use, and requires companies to show that their grid consumption is falling and/or that their physical grid use is getting cleaner; in other words, that their market-based solutions are actually making the grid cleaner.
The market-based (or zero-carbon electricity) target tracks a company’s use of low-carbon power generation contracts and Energy Attribute Certificates. It requires geographical matching of these certificates with electricity consumption based on deliverability regions (grid regions); annual matching is allowed, though hourly matching is encouraged. Category A companies with large electricity loads must report the percentage of their Scope 2 electricity consumption matched with low-carbon attributes on an hourly basis, and there’s an optional recognition framework for companies that meet hourly matching thresholds.
How do Scope 3 targets work under Net Zero Standard V2?
Scope 3 targets share the same 2050-or-sooner net-zero goal, but companies set near-term targets only for material emissions sources in their value chain and areas where they have real influence. Long-term Scope 3 targets are generally not required.
Limited, justified exclusions are allowed for near-term targets, including categories that individually account for less than 5% of total Scope 3 emissions, and activities where a company lacks practical influence, like leased assets it doesn’t operationally control, or the processing of sold products. Optional exclusions are also available in specific categories.
Companies can choose from three approaches to near-term Scope 3 targets:
- An overarching emissions reduction target, which follows a linear contraction of emissions from the base year to residual emissions of 10% or less by 2050 or sooner;
- An overarching supplier/customer alignment target, benchmarked against a growing share of tier 1 suppliers and customers reaching net-zero by 2050 or sooner; or
- A category- or activity-specific target, tailored for companies with concentrated emissions in particular Scope 3 categories or high-emitting activities.
What is “ongoing emissions mitigation” under the new SBTi standard?
This is one of the most significant additions in Net Zero Standard V2. Accelerated climate contributions are needed to help the world achieve climate objectives, limit temperature overshoot, mitigate transition risks, and support the scale-up of climate solutions, and V2 formally recognizes that. Ongoing emissions mitigation runs as a parallel track to companies also reducing their own emissions.
The framework is initially voluntary, with recognition available at three contribution levels to encourage early action.
- Engaged companies address more than 1% of total Scope 1, 2, and 3 emissions.
- Advanced companies address more than 10% of total Scope 1, 2, and 3 emissions, including 100% of Scope 1 and 2 emissions.
- Leadership companies address 100% of total Scope 1, 2, and 3 emissions with a contribution budget of $80/tCO2e.
Carbon credits used for this purpose have to meet certain quality standards. They must be ex-post (issued after the mitigation has actually occurred), independently third-party-assured, emissions reductions or removals, measured in tCO2e, that occur within five years prior to the reporting year. They must be sourced from outside the company’s own value chain. Further minimum criteria will be set to align with high-integrity frameworks, with additional details on the recognition program expected in the second half of 2026.
Starting in 2035, carbon removals become mandatory for Category A companies. From that point, the carbon removal coverage requirement rises linearly from 1% of Scope 1–3 emissions to 100% by a company’s net-zero year. Within that, 10% of long-lived GHG emissions must specifically be covered by durable removals, also rising linearly to 100% by the net-zero year.
How must companies neutralize residual emissions?
At a company’s net-zero target year and thereafter, it must reduce its Scope 1, 2, and 3 emissions to zero or to residual levels, and neutralize all residual emissions using eligible carbon removals. Those removals have to meet two conditions: they must occur within the same reporting period as the residual emissions they’re neutralizing, and long-lived GHGs must be neutralized with long-lived removals, matching the durability of the removal to the atmospheric lifetime of the emission being addressed.
What is the SBTi implementation hierarchy?
Net Zero Standard V2 also lays out how companies should prioritize their actions for credible target delivery, in three tiers.
- Direct actions, at the activity level, are actions that reduce emissions at the source within a company’s own operations and value chain; things like efficiency improvements, fuel switching, and engaging suppliers and customers to reduce their emissions.
- Actions within shared systems, or activity pools that reduce the emissions of shared systems like electricity or gas grids. This includes market instruments that convey low-carbon attributes, such as PPAs, RECs, and GOs, all of which must meet minimum integrity criteria that SBTi will elaborate on in future guidance.
- Sector-level actions relate to the same type of activity occurring in a relevant geography or system, in a way that meaningfully reduces the emissions a company is responsible for.
How Terrapass helps businesses meet the new SBTi standard
As the rules around carbon credits become more rigorous, the quality of the credits behind them matters more than ever. Terrapass has expanded our global network of carbon projects: more project types, locations, prices, ICVCM CCPs, and UN SDGs, spanning super-pollutant destruction, nature-based solutions, and durable removals. We offer Green-e® Climate Certification and we only source from third-party-verified projects on ICVCM-Eligible registries.
We also help clients with impact beyond carbon: EACs, RECs, and GOs including Green-e® Certified credits that support leading renewable energy projects; water credits that support water restoration projects; and custom environmental product needs like RNG and SAF. Wherever your organization is on its sustainability journey, we help clients around the world address climate risk, advance their environmental and social goals, and get the most out of their sustainability budgets.
FAQ: SBTi Net-Zero Standard revision
What is the SBTi Net-Zero Standard?
It’s the framework the Science Based Targets initiative publishes for companies that want validated, credible net-zero targets tied to limiting global warming.
What is changing in the SBTi Net Zero Standard V2 revision?
The biggest changes are more flexibility (five-year cycles and a “best efforts” standard), a new Asset Transition Method for companies whose emissions don’t follow a straight-line path, and formal recognition of voluntary carbon credits for mitigating ongoing emissions.
When do companies need to switch to the new SBTi standard?
If your company already has 2030 targets, you keep using V1 for your current cycle and move to V2 in 2028. If you don’t have targets yet, you can start using V2 as of February 1, 2027.
Can companies use carbon credits to meet SBTi targets?
They can. Under V2, high-integrity carbon reduction and removal credits count toward mitigating ongoing emissions from 2027 through 2034. Starting in 2035, only removal credits count, and they need to be durability-matched to the emissions they offset.
What’s the difference between Category A and Category B companies under SBTi?
Category A is large companies everywhere plus medium-sized companies in high-income countries, based on thresholds like revenue, headcount, or emissions. Category B is small companies everywhere and medium-sized companies in lower-income countries.
What happens if a company misses its SBTi target?
Under the old standard, falling behind could cost a company its SBTi status. Under V2’s “best efforts” approach, a company can hold onto its status as long as it’s used every lever within its control, with minimum progress rules coming in the SBTi Assurance Manual.
Sources: This post is based on Terrapass’s internal analysis of the SBTi Corporate Net-Zero Standard V2.0. Facts and figures were checked against SBTi’s official V2.0 announcement, SBTi’s Corporate Net-Zero Standard V2.0 — Chapter 6: Ongoing Emissions Responsibility, Trellis’s coverage of the standard, Trellis’s reporting on Ongoing Emissions Recognition costs, Sylvera’s analysis of what comes next, Anthesis Group’s Fortune 500 net-zero commitments research, and Climate Impact Partners’ seventh annual FG500 analysis, as reported by CarbonUnits.com.
The post SBTi Net-Zero Standard V2: What the Revision Means for Every Business appeared first on Terrapass.
For most businesses, the emissions that matter most sit outside their own walls. Scope 3 emissions, everything generated across your value chain, from the suppliers who make your inputs to the customers who use your products, typically make up the majority of a company’s total carbon footprint. Under the Corporate Sustainability Reporting Directive (CSRD), those value-chain emissions now have to be measured and disclosed with a rigour that spend-based estimates alone struggle to satisfy. This guide sets out how to improve Scope 3 data accuracy for CSRD: the calculation methods open to you, how to move from estimates to verified supplier data, and how to govern that data so it holds up to audit.
![]()
A carbon credit is a commitment that extends well into the future. The tonne of CO₂ compensated for today from a nature-based carbon project must remain out of the atmosphere for good, which means the forest behind the credit has to remain standing long after the transaction is complete. For any buyer, this raises a defining question: What ensures that the forest endures?
![]()


-
Climate Change12 months ago
Guest post: Why China is still building new coal – and when it might stop
-
Greenhouse Gases12 months ago
Guest post: Why China is still building new coal – and when it might stop
-

 Greenhouse Gases2 years ago
嘉宾来稿:满足中国增长的用电需求 光伏加储能“比新建煤电更实惠”
-

 Climate Change2 years ago
嘉宾来稿:满足中国增长的用电需求 光伏加储能“比新建煤电更实惠”
-
Climate Change2 years ago
Bill Discounting Climate Change in Florida’s Energy Policy Awaits DeSantis’ Approval
-

 Renewable Energy9 months ago
Sending Progressive Philanthropist George Soros to Prison?
-

 Carbon Footprint2 years ago
US SEC’s Climate Disclosure Rules Spur Renewed Interest in Carbon Credits
-
Greenhouse Gases1 year ago
嘉宾来稿:探究火山喷发如何影响气候预测