

Climate change and “unsustainable human activities” are driving “unprecedented changes” to mountains and glaciers, threatening access to fresh water for more than two billion people, a UN report warns.
The 2025 UN world water development report finds that receding snow and ice cover in mountain regions could have “severe” consequences for people and nature.
Up to 60% of the world’s freshwater originates in mountain regions, which are home to 1.1bn people and 85% of species of birds, amphibians and mammals.
The report highlights a wide range of impacts, including reduced water for drinking and agriculture, stress on local ecosystems and increased risk of “devastating” glacial lake outburst floods (GLOFs).
It also notes the deep spiritual and cultural connections that mountain-dwelling communities around the world have with mountains and glaciers, from India’s Hindu Kush Himalaya to Colombia’s Sierra Nevada de Santa Marta.
One expert tells Carbon Brief that glacier loss is already causing “loss of life, loss of livelihood and most importantly of all, the loss of a place that many communities have called home for generations”.
The report showcases a range of adaptation responses that communities are already implementing, including changing farming practices, producing better water storage systems and improving early warning systems for floods and landslides.
It also stresses the need for further funding and adaptation, as well as the importance of Indigenous knowledge and international collaboration.
Water towers
The annual UN world water development report unpacks a different aspect of “water and sanitation” each year and gives policy recommendations to decisionmakers. This year’s report focuses on mountains on glaciers, because 2025 has been designated by the UN as the “international year of glaciers’ preservation”.
Mountains are often called the world’s “water towers” due to their crucial role in the global water cycle.
Ice and snow accumulate at high latitudes every winter when temperatures are cool, before melting when summer brings warmer weather. This meltwater is an important source of water for streams – especially during hot, dry periods, when it plays a crucial role in keeping rivers flowing and providing a buffer against water stress.
It is often said that two billion people rely on mountain water from glaciers for their day-to-day needs.
The report says this figure refers to the number of people who live in drainage basins that originate in mountains – but adds that the role of glaciers in freshwater provision is “nuanced” and varies around the world.
Mountains provide 55-60% of annual freshwater flows globally – but this percentage can vary between 40% and 90% in different parts of the world, according to the authors.
Rivers including the Colorado, Nile and Rio Negro rely on water from the mountains for at least 90% of their water flow, the report says.
It adds that many of the world’s largest cities, including Tokyo, Los Angeles and New Delhi, are “critically dependent” on mountain water for a range of sectors.
The report also highlights how mountains are crucial for the power sector, with hydropower one of the main industries in mountain areas. For example, it notes that 85% of hydropower generated in Andean countries is produced in mountain areas.
Meanwhile, two-thirds of irrigated agriculture depends on the runoff contribution from mountains, according to the report.
It adds that mountain communities play a critical role in maintaining crop biodiversity and “preserve many of the rarest crop varieties and medicinal plants”.
Melting glaciers
Most water from snow and ice reserves in the mountains comes from melting snow, according to the report. However, glaciers – slow-moving rivers of ice that form from an accumulation of snow over many years – are also a key part of the mountain cryosphere.
(The cryosphere refers to frozen components of the Earth system that are at or below the land and ocean surface.)
Around 10% of the world’s land surface is currently covered by around 200,000 glaciers, which store approximately 70% of the Earth’s fresh water.
The map below marks the location of the world’s glaciers. In the field of glaciology, 19 “glacierised” regions are often used to help scientists to compare glaciers from different parts of the world. These regions are shown by the boxes and numbers.

The report says that “all mountain ranges” have shown evidence of warming since the early 20th century. It warns that, as global temperatures rise, more mountain precipitation will fall as rain instead of snow, causing snowpacks to thin and melt earlier in the year.
This acceleration in snowpack melt often causes river flow to increase in glacier-fed water basins and rivers in the short term. However, once the snow melts beyond a certain threshold, a “peak water” point is passed and river flow declines again.
The report says there is “strong evidence” that this “peak water” point has already been passed in the glacial-fed rivers of the tropical Andes, western Canada and the Swiss Alps.
Meanwhile, many glaciers have disappeared entirely. For example, Colombia has lost 90% of its glacial area since the mid-19th century, according to the report.
It highlights the “rapid disappearance” of the Sierra Nevada de Santa Marta glacier – one of the few glaciers located near the Caribbean Sea. The glacier is a source for more than 30 rivers, while also being an “irreplaceable site for biodiversity” and sacred to four different Indigenous communities, according to the report.
The plot below shows cumulative mass changes of glaciers in different world regions over 1950-2023, measured in 1,000kg per square metre. The average of all nine regions is shown by the dotted black line.

The report warns that, as the climate warms, many glaciers will “inevitably” disappear over the coming decades. It points to projections that suggest that warming of 1.5-4C will cause glaciers to lose 26-41% of their 2015 mass by 2100.
The authors also discuss the ecological consequences of warming. Mountains make up just one-quarter of the Earth’s surface, but are home to unique ecosystems and more than 85% of the world’s species of amphibians, birds, and mammals – many of which cannot be found anywhere else in the world.
As mountains warm, ecological communities are likely to shift to higher elevations, the authors say. In addition, as warming causes the water cycle to become more “unpredictable and extreme”, many of these species will face additional stressors, they add.
Hazards
The authors warn that climate change and the “rapid and unplanned urbanisation” of mountain regions is “placing pressure on fragile mountain ecosystems, affecting water availability, quality and security”.
For example, deforestation can drive up the risk of hazards such as landslides and GLOFs – the sudden release of water from a lake formed from glacial melt – the authors say.
GLOFs have caused more than 12,000 deaths in the past 200 years, as well as causing “severe damage to farmland, homes, bridges, roads, hydropower plants and cultural assets, often prompting further internal displacement”, the report says.
It adds that the frequency of GLOFs has “increased significantly” since the 1900s. These events are expected to continue rising over the coming decades – creating “new hotspots of potentially dangerous GLOF hazards and risks”.
The report contains a section on the Hindu Kush Himalaya region, which is highly vulnerable to GLOFs. It says that glaciers here are melting faster than the global average – and warns that under global warming scenarios of 1.5-2C, glacier volume in the region may reduce by 30-50% by 2100.
The report warns that GLOFs in the region are expected to triple by the end of the century, stressing that “many of the consequences will go beyond the limits of adaptation”.
More than 60 GLOF events were recorded in the Hindu Kush over 2010-20. A recent study found that thawing permafrost played a key role in the South Lhonak Lake GLOF, which took place in 2023 in the state of Sikkim.

Indigenous peoples
The report also emphasises the impacts of melting glaciers and snowpacks on Indigenous peoples and local communities. These groups “have long-standing connections to land and water in mountain regions, which are deeply rooted in their cultural, spiritual and subsistence practices”.
For example, glaciologist Dr Heidi Sevestre from the Arctic Monitoring and Assessment Programme told a press briefing about the “cultural and spiritual importance of these mountains and glaciers” to the Bakonzo people, who live in the foothills of Uganda’s Rensui glaciers.
Sevestre explained that this community – which has “probably one of the lowest carbon footprints in the world” – is “worried that they could be punished by their gods if the ice disappears”.
The map below shows more examples of the impacts of climate water and cryosphere changes on “Indigenous peoples and local communities in cold regions”.

Tenzing Chogyal Sherpa is a cryosphere analyst at the International Centre for Integrated Mountain Development. He tells Carbon Brief that glaciers are “the most visible and vivid indicators of a planet in crisis”.
He adds that glacier loss is already causing “the loss of life, loss of livelihood and most importantly of all, the loss of a place that many communities have called home for generations”.
Resilience-building
Mountains have a wide range of climates, geologies and vegetation types, creating an “exceptional need” for robust systems for collecting and managing hydrological data, the report says.
However, monitoring networks in the high mountains are currently “sparse” and models are low-resolution, resulting in “uncertain” observations and predictions, it notes.
For example, only 28 of the 50,000 glaciers in the Hindu Kush Himalaya currently have active monitoring of mass changes, the report says. Safe, accessible glaciers are often selected for monitoring, which can make observations biased, it adds.
To fill these gaps in data, the authors stress the importance of incorporating Indigenous knowledge and encouraging international collaboration.
Dr Aditi Mukherji – the director of the climate change, adaptation and mitigation impact action platform of the CGIAR – tells Carbon Brief that the report is an important call for more “adaptation efforts and funding”.
She says that mountain-dwelling communities are “already quite vulnerable due to their remote location and other developmental deficits” and are “increasingly losing their way of life due to no fault of theirs”.
Examples of adaptation are prominent throughout the report. For example, it highlights communities who are installing drainage pipes, artificial dams and early warming systems to lakes throughout the Andes to increase resilience against GLOFs.
Meanwhile, the Rhône glacier in Valais, Switzerland, has been covered in white sheets designed to keep it cool. And in Ladakh, in northern India, villagers have developed four types of “ice reservoirs” to supplement water flow for agriculture in the spring.

Sahana Subramaniam – a PhD student at Lund University’s Centre for Sustainability Studies – welcomes the attention being given to glaciers this year to mark the UN-designated “international year of glacier preservation”.
She tells Carbon Brief about a wide range of conferences, panels, workshops and meetings being organised on the topic, many of which have been interdisciplinary in nature, bringing together physical and social scientists. “It’s quite seminal that so much attention is being given to this topic this year,” she adds.
Dr James Kirkham is a glaciologist and climate scientist at the International Cryosphere Climate Initiative. He tells Carbon Brief that the UN’s focus on glaciers and mountains this year could serve as a “springboard to help political leaders focus on the multi-lateral cooperation, political leadership [and] long-term thinking”.


The post Glacier melt threatens water supplies for two billion people, UN warns appeared first on Carbon Brief.
Glacier melt threatens water supplies for two billion people, UN warns

Drought and heatwaves occurring together – known as “compound” events – have “surged” across the world since the early 2000s, a new study shows.
Compound drought and heat events (CDHEs) can have devastating effects, creating the ideal conditions for intense wildfires, such as Australia’s “Black Summer” of 2019-20 where bushfires burned 24m hectares and killed 33 people.
The research, published in Science Advances, finds that the increase in CDHEs is predominantly being driven by events that start with a heatwave.
The global area affected by such “heatwave-led” compound events has more than doubled between 1980-2001 and 2002-23, the study says.
The rapid increase in these events over the last 23 years cannot be explained solely by global warming, the authors note.
Since the late 1990s, feedbacks between the land and the atmosphere have become stronger, making heatwaves more likely to trigger drought conditions, they explain.
One of the study authors tells Carbon Brief that societies must pay greater attention to compound events, which can “cause severe impacts on ecosystems, agriculture and society”.
Compound events
CDHEs are extreme weather events where drought and heatwave conditions occur simultaneously – or shortly after each other – in the same region.
These events are often triggered by large-scale weather patterns, such as “blocking” highs, which can produce “prolonged” hot and dry conditions, according to the study.
Prof Sang-Wook Yeh is one of the study authors and a professor at the Ewha Womans University in South Korea. He tells Carbon Brief:
“When heatwaves and droughts occur together, the two hazards reinforce each other through land-atmosphere interactions. This amplifies surface heating and soil moisture deficits, making compound events more intense and damaging than single hazards.”
CDHEs can begin with either a heatwave or a drought.
The sequence of these extremes is important, the study says, as they have different drivers and impacts.
For example, in a CDHE where the heatwave was the precursor, increased direct sunshine causes more moisture loss from soils and plants, leading to a drought.
Conversely, in an event where the drought was the precursor, the lack of soil moisture means that less of the sun’s energy goes into evaporation and more goes into warming the Earth’s surface. This produces favourable conditions for heatwaves.
The study shows that the majority of CDHEs globally start out as a drought.
In recent years, there has been increasing focus on these events due to the devastating impact they have on agriculture, ecosystems and public health.
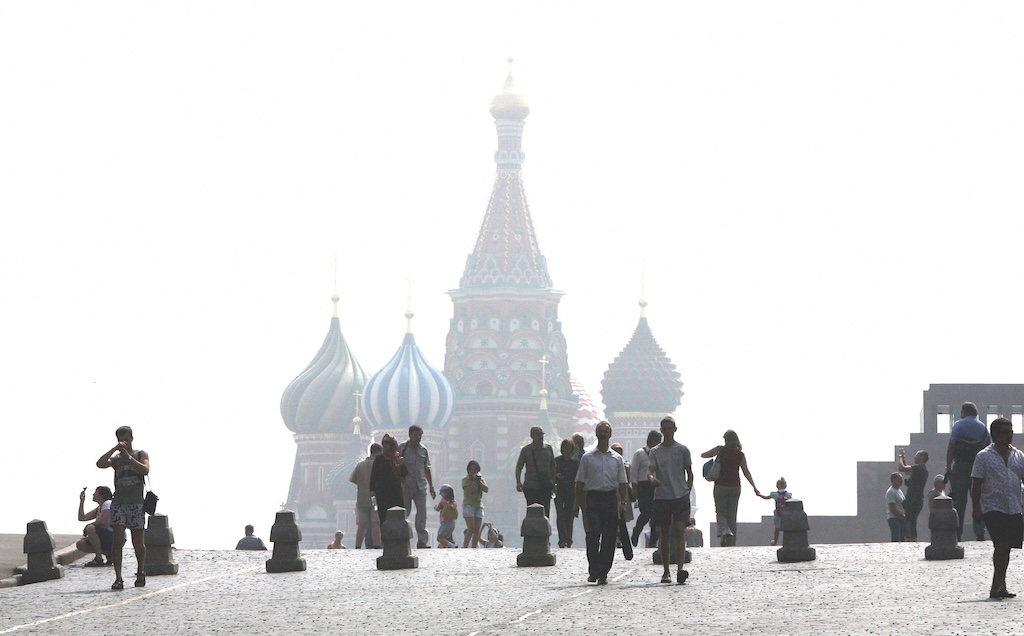
In Russia in the summer of 2010, a compound drought-heatwave event – and the associated wildfires – caused the death of nearly 55,000 people, the study notes.
The record-breaking Pacific north-west “heat dome” in 2021 triggered extreme drought conditions that caused “significant declines” in wheat yields, as well as in barley, canola and fruit production in British Columbia and Alberta, Canada, says the study.
Increasing events
To assess how CDHEs are changing, the researchers use daily reanalysis data to identify droughts and heatwaves events. (Reanalysis data combines past observations with climate models to create a historical climate record.) Then, using an algorithm, they analyse how these events overlap in both time and space.
The study covers the period from 1980 to 2023 and the world’s land surface, excluding polar regions where CDHEs are rare.
The research finds that the area of land affected by CDHEs has “increased substantially” since the early 2000s.
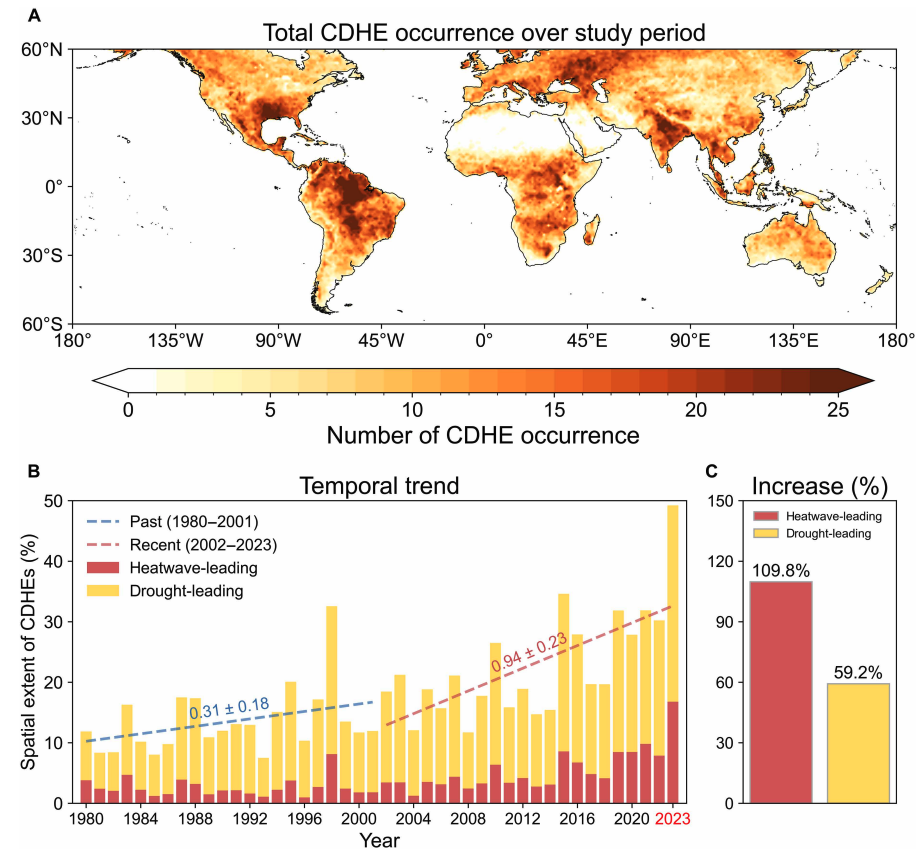
Heatwave-led events have been the main contributor to this increase, the study says, with their spatial extent rising 110% between 1980-2001 and 2002-23, compared to a 59% increase for drought-led events.
The map below shows the global distribution of CDHEs over 1980-2023. The charts show the percentage of the land surface affected by a heatwave-led CDHE (red) or a drought-led CDHE (yellow) in a given year (left) and relative increase in each CDHE type (right).
The study finds that CDHEs have occurred most frequently in northern South America, the southern US, eastern Europe, central Africa and south Asia.
Threshold passed
The authors explain that the increase in heatwave-led CDHEs is related to rising global temperatures, but that this does not tell the whole story.
In the earlier 22-year period of 1980-2001, the study finds that the spatial extent of heatwave-led CDHEs rises by 1.6% per 1C of global temperature rise. For the more-recent period of 2022-23, this increases “nearly eightfold” to 13.1%.
The change suggests that the rapid increase in the heatwave-led CDHEs occurred after the global average temperature “surpasse[d] a certain temperature threshold”, the paper says.
This threshold is an absolute global average temperature of 14.3C, the authors estimate (based on an 11-year average), which the world passed around the year 2000.
Investigating the recent surge in heatwave-leading CDHEs further, the researchers find a “regime shift” in land-atmosphere dynamics “toward a persistently intensified state after the late 1990s”.
In other words, the way that drier soils drive higher surface temperatures, and vice versa, is becoming stronger, resulting in more heatwave-led compound events.
Daily data
The research has some advantages over other previous studies, Yeh says. For instance, the new work uses daily estimations of CDHEs, compared to monthly data used in past research. This is “important for capturing the detailed occurrence” of these events, says Yeh.
He adds that another advantage of their study is that it distinguishes the sequence of droughts and heatwaves, which allows them to “better understand the differences” in the characteristics of CDHEs.
Dr Meryem Tanarhte is a climate scientist at the University Hassan II in Morocco, and Dr Ruth Cerezo Mota is a climatologist and a researcher at the National Autonomous University of Mexico. Both scientists, who were not involved in the study, agree that the daily estimations give a clearer picture of how CDHEs are changing.
Cerezo-Mota adds that another major contribution of the study is its global focus. She tells Carbon Brief that in some regions, such as Mexico and Africa, there is a lack of studies on CDHEs:
“Not because the events do not occur, but perhaps because [these regions] do not have all the data or the expertise to do so.”
However, she notes that the reanalysis data used by the study does have limitations with how it represents rainfall in some parts of the world.
Compound impacts
The study notes that if CDHEs continue to intensify – particularly events where heatwaves are the precursors – they could drive declining crop productivity, increased wildfire frequency and severe public health crises.
These impacts could be “much more rapid and severe as global warming continues”, Yeh tells Carbon Brief.
Tanarhte notes that these events can be forecasted up to 10 days ahead in many regions. Furthermore, she says, the strongest impacts can be prevented “through preparedness and adaptation”, including through “water management for agriculture, heatwave mitigation measures and wildfire mitigation”.
The study recommends reassessing current risk management strategies for these compound events. It also suggests incorporating the sequences of drought and heatwaves into compound event analysis frameworks “to enhance climate risk management”.
Cerezo-Mota says that it is clear that the world needs to be prepared for the increased occurrence of these events. She tells Carbon Brief:
“These [risk assessments and strategies] need to be carried out at the local level to understand the complexities of each region.”



The post Heatwaves driving recent ‘surge’ in compound drought and heat extremes appeared first on Carbon Brief.
Heatwaves driving recent ‘surge’ in compound drought and heat extremes
Greenhouse Gases
DeBriefed 6 March 2026: Iran energy crisis | China climate plan | Bristol’s ‘pioneering’ wind turbine
Welcome to Carbon Brief’s DeBriefed.
An essential guide to the week’s key developments relating to climate change.
This week
Energy crisis
ENERGY SPIKE: US-Israeli attacks on Iran and subsequent counterattacks across the Middle East have sent energy prices “soaring”, according to Reuters. The newswire reported that the region “accounts for just under a third of global oil production and almost a fifth of gas”. The Guardian noted that shipping traffic through the strait of Hormuz, which normally ferries 20% of the world’s oil, “all but ground to a halt”. The Financial Times reported that attacks by Iran on Middle East energy facilities – notably in Qatar – triggered the “biggest rise in gas prices since Russia’s full-scale invasion of Ukraine”.
‘RISK’ AND ‘BENEFITS’: Bloomberg reported on increases in diesel prices in Europe and the US, speculating that rising fuel costs could be “a risk for president Donald Trump”. US gas producers are “poised to benefit from the big disruption in global supply”, according to CNBC. Indian government sources told the Economic Times that Russia is prepared to “fulfil India’s energy demands”. China Daily quoted experts who said “China’s energy security remains fundamentally unshaken”, thanks to “emergency stockpiles and a wide array of import channels”.
‘ESSENTIAL’ RENEWABLES: Energy analysts said governments should cut their fossil-fuel reliance by investing in renewables, “rather than just seeking non-Gulf oil and gas suppliers”, reported Climate Home News. This message was echoed by UK business secretary Peter Kyle, who said “doubling down on renewables” was “essential” amid “regional instability”, according to the Daily Telegraph.
China’s climate plan
PEAK COAL?: China has set out its next “five-year plan” at the annual “two sessions” meeting of the National People’s Congress, including its climate strategy out to 2030, according to the Hong Kong-based South China Morning Post. The plan called for China to cut its carbon emissions per unit of gross domestic product (GDP) by 17% from 2026 to 2030, which “may allow for continued increase in emissions given the rate of GDP growth”, reported Reuters. The newswire added that the plan also h