
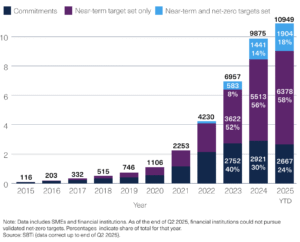
Companies around the world are accelerating their climate commitments at a record pace. The Science Based Targets initiative (SBTi) reports that corporates and other companies with both near-term and long-term net-zero targets jumped 227% in just 18 months.
Firms setting near-term only goals also grew by almost 97% in the same period. This fast growth shows a big change in how companies see climate responsibility. This is especially true for high-emission sectors like Industrials, Consumer Discretionary, and Materials.
The data shows that climate ambition is no longer a niche initiative. Companies are adding climate targets to their main business strategies. This change affects investors, supply chains, and whole industries.
Why Are Companies Choosing Science-Based Targets?
Science-based targets allow businesses to align with the Paris Agreement’s 1.5°C pathway, ensuring that emissions cuts follow the latest climate science. These targets give companies a credible plan to reduce emissions while addressing long-term risks.
The SBTi estimates that following science-based pathways could save $1.5 trillion in climate costs by 2030. The financial case is clear: strong climate plans save money. These goals help reduce risk, improve efficiency, and help companies adapt to a low-carbon economy.
Investor and customer expectations also play a critical role. Companies with validated targets are increasingly viewed as more reliable by the market.
In fact, businesses with SBTi-validated goals represented 39% of global market capitalization in 2023, and this share rose to 41% by 2024. These firms also outperformed the broader economy, growing market value by 16% compared to 11% for global GDP.
This net-zero or climate commitment alignment boosts corporate reputation. Brands with real emission-reduction goals stand out. Consumers and investors want proof of progress, so this gives companies an edge.
David Kennedy, SBTi’s Chief Executive Officer, stated:
“Building climate action into commercial strategy helps maintain competitiveness now and in the future and allows companies to capitalise on opportunities in the low-carbon economy.”
The report further reveals that more companies are now setting net-zero targets, showing a clear rise in ambition. In 2023, only 17% of corporates with validated science-based targets had committed to net-zero. By the end of 2024, that share had nearly doubled to 33%.
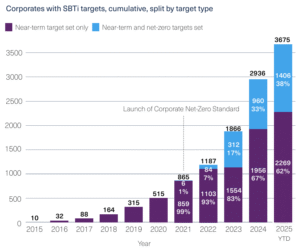
The trend continued into 2025. By mid-year, over 1,400 companies had announced net-zero targets, making up 38% of all corporates with science-based targets.
The 2027 Update: Raising the Bar
The SBTi will introduce updated standards in 2027 that will set tougher rules for how companies design and report their targets. The revisions aim to prevent greenwashing and ensure climate action stays in line with evolving science.
The changes will affect three main areas:
- Data quality: Companies must provide more robust proof of how they measure and report emissions.
- Scope of targets: Almost all targets already include Scope 3 emissions, which often account for over 70% of a company’s carbon footprint. The 2027 standards will ensure this remains mandatory and more consistent.
- Target reviews: Firms will be required to revisit and update their goals every five years, ensuring they remain scientifically valid.
The new framework will also require companies to publicly show whether their targets are active, updated, or withdrawn. This transparency will create stronger accountability and make it easier to compare progress across industries.
Asia’s Green Acceleration: China Takes the Lead
One of the most striking findings from the SBTi’s latest report is the surge of climate commitments in Asia. The region saw a 134% increase in the number of companies with validated targets, outpacing global averages.

China is leading this momentum. In just 18 months, the number of Chinese companies with science-based targets grew from 137 to 450, marking a 228% increase. Much of this growth comes from industries central to the global supply chain, such as manufacturing, construction, and raw materials.
Other Asian economies are also moving quickly. Government pressure, export requirements, and investor expectations are driving firms to adopt science-based goals.
Big companies are urging their suppliers to do the same. This creates a ripple effect in local and global supply chains.
This trend suggests that Asia will play a central role in shaping the global low-carbon transition. As one of the world’s largest manufacturing hubs, actions taken here have a direct influence on global emissions.
Scope 3 in Focus: Tackling the Hardest Emissions
The growth in science-based targets is already making a measurable difference. Companies with validated targets must report and act on Scope 1, 2, and 3 emissions. These emissions include direct fuel use, as well as activities from suppliers and customers.
Since Scope 3 emissions are typically 11 times greater than direct emissions, this comprehensive approach drives meaningful reductions across value chains.
Currently, 96% of validated companies include Scope 3 in their plans. This ensures emissions are reduced not only at company headquarters but also across the entire production and distribution network.
As standards tighten, companies will have to further strengthen reporting, focus on harder-to-cut emissions, and increase transparency. These improvements will accelerate global decarbonization while also improving operational efficiency. Better emissions data helps businesses reduce waste, save energy, and boost long-term resilience.
Wall Street Meets Climate Action: Investor Shifts
The rise in corporate climate and net-zero ambition is also reshaping financial markets. Companies with clear, science-based climate targets are seen as less risky. This makes them more appealing to investors who care about Environmental, Social, and Governance (ESG) factors.
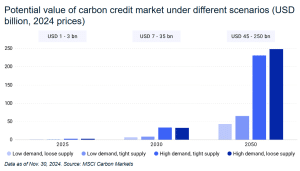
This trend is also fueling demand in the carbon markets. As companies work to cut emissions, many still face unavoidable Scope 3 emissions. To manage these, they increasingly turn to high-quality carbon credits.
The World Bank says the voluntary carbon market might reach $50 billion by 2030. This growth will partly come from companies following SBTi standards.
Regions moving quickly—such as China and other Asian countries—are likely to see economic benefits, including more jobs in green technology and clean energy industries.
On the other hand, slow-moving regions or sectors may lose competitiveness. Global buyers and investors prefer partners that align with climate goals.
Looking Ahead: The Path to Net Zero
The 227% rise in near-term and net-zero target adoption shows that companies are no longer delaying climate action. Key sectors such as industrials and materials, responsible for a large share of global emissions, are now leading the transition.
As the 2027 update approaches, expectations will rise even higher. Companies must keep data clear, track all value-chain emissions, and update their goals often. Those that succeed will not only contribute to global climate goals but also position themselves as leaders in the low-carbon economy.
The path forward is clear: corporations that act decisively today will shape business strategies, capital flows, and supply chains in the years ahead. In doing so, these corporates are not just helping reduce emissions — they are building the foundation for a sustainable, net-zero global economy.
The post Corporate Climate Pledges Surge 227% as SBTi Net Zero Standards Tighten appeared first on Carbon Credits.
Carbon Footprint
Texas-Based EnergyX’s Project Lonestar™ Signals a Turning Point for U.S. Lithium Supply

Energy Exploration Technologies, Inc. (EnergyX), led by CEO Teague Egan, has moved the United States closer to building a reliable domestic lithium supply chain. The company recently commissioned its Project Lonestar™ lithium demonstration facility in Texas, marking a key milestone in scaling direct lithium extraction (DLE) technologies.
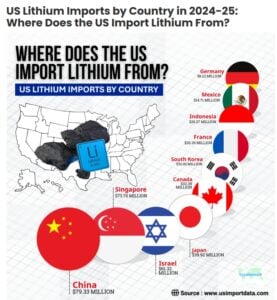
This development comes at a time when lithium demand is rising sharply due to electric vehicles and energy storage systems. At the same time, the U.S. remains heavily dependent on foreign processing, particularly from China.
- According to the US import data and Lithium import data of the USA, the total value of US lithium imports reached $432.36 million in 2024, a 9% decline from the previous year.
- The total value of US lithium imports (cells & batteries) accounted for $205.29 million in the first 6 months of 2025.
Against this backdrop, EnergyX’s progress offers both technological validation and strategic value.
From Concept to Reality: How Project Lonestar™ Works
Project Lonestar™ is EnergyX’s first major lithium project in the United States and its second globally. The demonstration plant, located in the Smackover region spanning Texas and Arkansas, is now operational and uses industrial-grade systems rather than small pilot equipment.
- The facility produces around 250 metric tons per year of lithium carbonate equivalent (LCE).
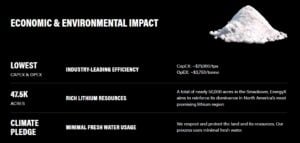
While this output is modest compared to global supply, its importance lies in proving that EnergyX’s proprietary GET-Lit™ technology can efficiently extract lithium from brine. The plant processes locally sourced Smackover brine, a resource that has historically been underutilized despite its lithium potential.

Unlike traditional lithium production, which often relies on hard-rock mining or evaporation ponds, DLE technology directly extracts lithium from brine using advanced filtration and chemical processes. This reduces production time and may lower environmental impact.
- More importantly, the Lonestar™ plant can supply 5 to 25 tons of battery-grade lithium samples to customers.
This allows battery manufacturers to test and validate the material before committing to large-scale supply agreements.
Scaling Up: From Demonstration to Commercial Production
The demonstration plant is only the first phase of a much larger plan. EnergyX aims to scale Project Lonestar™ into a full commercial operation capable of producing 50,000 tonnes of LCE annually across two phases.
- The first phase alone targets 12,500 tonnes per year, which would already place it among the more significant lithium producers in the U.S.
- Significantly, the company has invested approximately $30 million in the demonstration facility, supported in part by a $5 million grant from the U.S. Department of Energy.
- For the full-scale project, EnergyX estimates total capital expenditure at around $1.05 billion.
Cost metrics suggest strong economic potential. The company estimates capital costs at roughly $21,000 per tonne of capacity and operating costs near $3,750 per tonne. If these figures hold at scale, the project could compete effectively with global lithium producers, particularly in a market where cost efficiency is becoming increasingly important.
Teague Egan, Founder & CEO of EnergyX, said,
“Bringing the biggest integrated DLE lithium demonstration plant online in the United States is a foundational milestone for EnergyX and for U.S. domestic lithium production in general. This facility not only validates the performance of our technology on an industrial scale under real-world conditions, but also establishes EnergyX as the lowest cost producer in the U.S. Ultimately this benefits all our customers who need large volumes of lithium for EV and ESS applications, as well as any lithium resource owners looking to implement best-in-class DLE technology whom we are happy to license to.”
Breaking the Bottleneck: Why U.S. Refining Matters
One of the biggest challenges facing the U.S. lithium sector is not resource availability but refining capacity. While lithium deposits exist across the country, most battery-grade lithium chemicals are processed overseas.
China dominates this segment, controlling roughly 70 to 75 percent of global lithium chemical conversion capacity. This concentration creates a structural dependency. Even when lithium is mined in the U.S. or allied countries, it is often shipped abroad for processing before returning as battery materials.
Project Lonestar™ directly addresses this gap. By integrating extraction and refining into a single domestic operation, EnergyX is working to build a complete “brine-to-battery” value chain within the United States. This approach could reduce reliance on foreign processing and improve supply chain resilience.
U.S. Senator Ted Cruz highlighted the project’s importance, noting that domestic lithium production supports both energy security and defense readiness, particularly for applications in advanced battery systems.
- CHECK: LIVE LITHIUM PRICES
The Current Landscape: Limited Supply, Big Ambitions

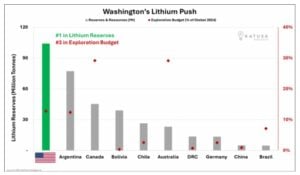
Investment is flowing into regions such as Nevada, North Carolina, and Arkansas. If even a portion of these reserves is converted into production, the U.S. could significantly reduce its reliance on imported lithium.
Active Resources and Future Potential
At present, U.S. lithium production remains relatively small. The only active large-scale operation is the Silver Peak Mine in Nevada, which produces between 5,000 and 10,000 tonnes of LCE annually, depending on market conditions.
However, several projects are in development that could significantly expand capacity. The Thacker Pass project, for example, is expected to produce around 40,000 tonnes per year in its first phase once operational later in the decade.
In addition, brine-based developments in the Smackover region aim to produce tens of thousands of tonnes annually, with long-term plans exceeding 100,000 tonnes across multiple sites.
These projects indicate a shift from a niche domestic industry to a more substantial production base. Still, timelines remain uncertain due to regulatory and financial challenges.
Demand Surge: Batteries Drive the Lithium Boom
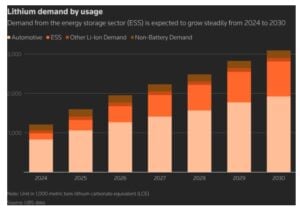
The urgency to expand lithium production is driven by rapid growth in battery demand. Electric vehicles, renewable energy storage, and grid modernization are all increasing lithium consumption.
According to S&P Global, U.S. lithium demand is expected to grow at an average rate of 40 percent annually between 2024 and 2029. Canada is projected to see even faster growth, albeit from a smaller base, with demand rising by around 74 percent per year over the same period.
Globally, battery capacity is forecast to approach 4 terawatt-hours by 2030. This expansion highlights lithium’s central role in the clean energy transition. Without sufficient supply, battery production—and by extension, EV adoption—could face constraints.
Why Progress Takes Time
Turning lithium reserves into operational mines and processing facilities is not straightforward. Projects often face long permitting timelines, environmental scrutiny, and legal challenges. Financing can also be difficult, especially in a volatile commodity market.
Local opposition can further complicate development, particularly in areas with high environmental concerns. These factors can delay projects by several years, slowing the pace of expansion.
To address these barriers, the U.S. government is increasing its involvement through funding, policy support, and efforts to streamline permitting. The Department of Energy’s backing of EnergyX reflects a broader strategy to accelerate domestic critical mineral development.
Conclusion: A Strategic Shift in Motion
Project Lonestar™ represents a meaningful step toward reshaping the U.S. lithium landscape. By proving the viability of direct lithium extraction at an industrial scale, EnergyX has laid the groundwork for larger, commercially viable operations.
The project also aligns with national priorities around energy security, supply chain resilience, and clean energy transition. While challenges remain, the combination of technological innovation, government support, and rising demand creates a strong foundation for growth.
As the world moves toward electrification, lithium will remain at the center of the transition. Projects like Lonestar™ show that the United States is beginning to close the gap between resource potential and real-world production—one facility at a time.
The post Texas-Based EnergyX’s Project Lonestar™ Signals a Turning Point for U.S. Lithium Supply appeared first on Carbon Credits.
Carbon Footprint
Canada Doles Out Almost C$29M for CCUS and Renewables as Clean Energy Market Surges

Canada has pledged nearly C$29 million ($21.6 million) to support carbon capture, utilization, and storage (CCUS) and renewable energy projects. The funding aims to back new technologies that reduce greenhouse gas emissions and make clean energy more competitive. This commitment was announced by the Canadian government in late March 2026 as part of ongoing efforts to meet climate goals.
The investment is small compared with Canada’s larger climate budget. But it signals continued federal support for emerging technologies and deployment of clean energy solutions. CCUS is one of several tools that nations are using to curb emissions while keeping energy supplies stable.
What Canada Is Funding? Inside the C$29M Clean Tech Bet
The C$29 million pledge covers a mix of CCUS and renewable energy efforts. It is intended for 12 projects that capture carbon dioxide (CO₂) from industrial emissions. It also supports systems that convert captured CO₂ into usable products or store it underground so it cannot enter the atmosphere.
The Honourable Tim Hodgson, Minister of Energy and Natural Resources, said:
“Canada is scaling up clean energy while strengthening our electricity grid and responsibly growing our conventional energy industry — because competitiveness means doing more than one thing at the same time. We are investing to provide reliable, affordable and clean power across the country that will propel our economic growth, protect affordability for Canadian families and make Canada a low-risk, low-cost, low-carbon energy superpower.”
Carbon capture refers to systems that trap CO₂ from power plants and factories before it is released. The captured gas can be stored deep underground or used in industrial processes, such as making building materials or fuels. Utilization means finding commercial uses for captured CO₂ so that it has economic as well as environmental value.
Renewable energy projects in Canada focus on expanding wind, solar, hydro, and other low‑carbon power sources. As of 2024, about 79 % of Canada’s electricity generation came from low‑carbon sources, with hydropower alone accounting for roughly 55 %. The rest comes from wind, solar, and nuclear energy.
Carbon Capture’s Strategic Role in Net Zero
Canada has a strong track record in CCUS deployment. Several large‑scale facilities already operate in the country, especially in Alberta and Saskatchewan.
For example, the Quest Carbon Capture and Storage Project in Alberta captures about one million tonnes of CO₂ per year and stores it deep underground.
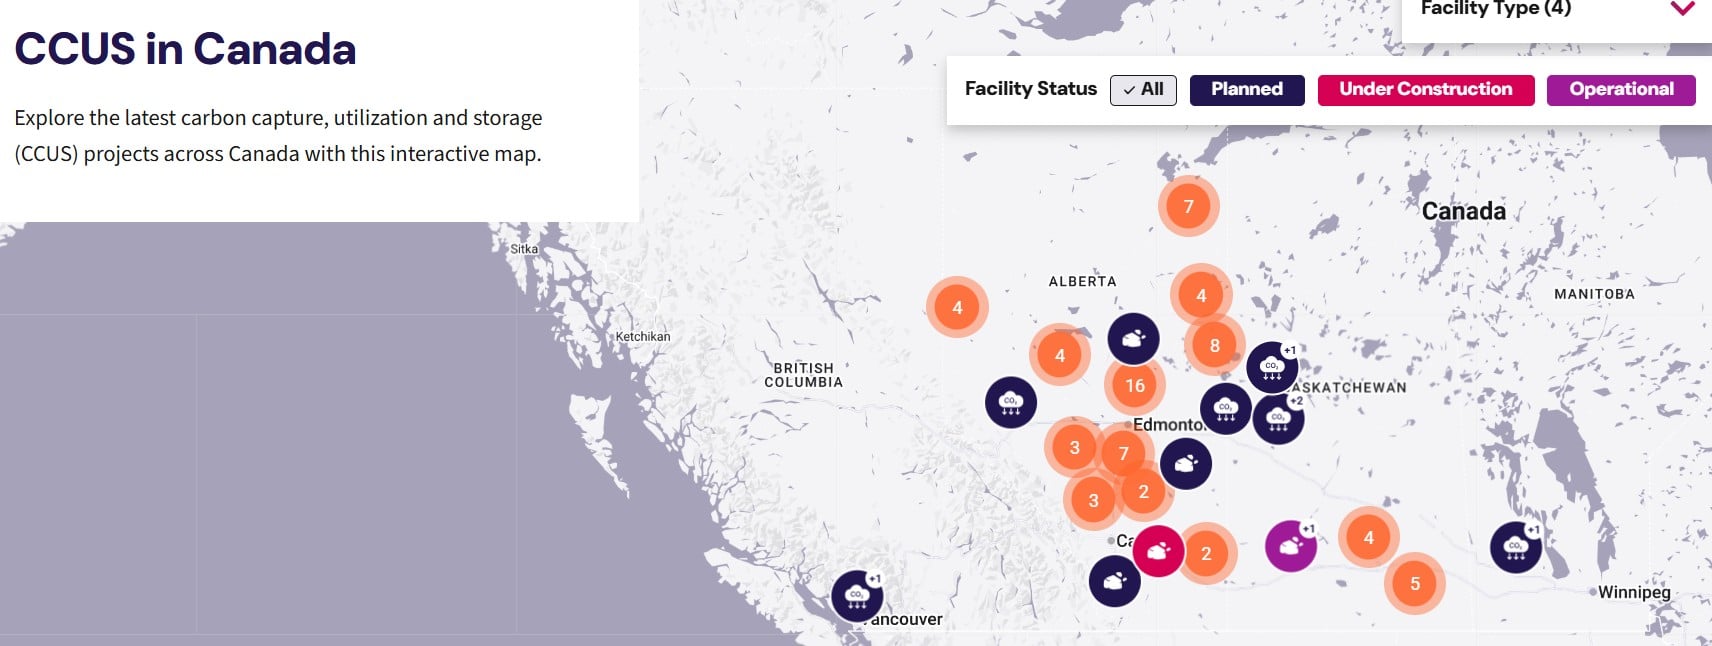
Canadian CCUS technology accounts for a notable share of planned global capacity. Canadian projects represent about 11.5 % of planned CCUS storage capacity worldwide.
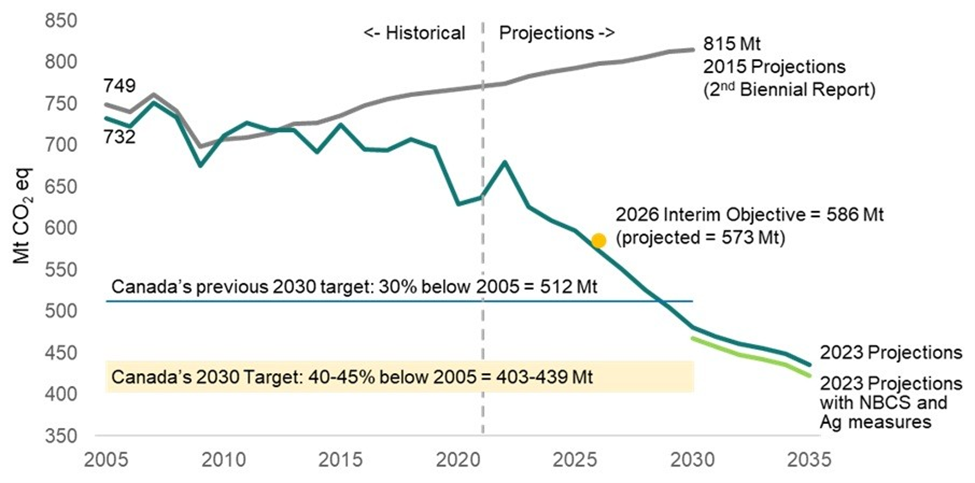
Notably, Canada’s carbon capture capacity could increase from about 4.4 million tonnes of CO₂ per year to 16.3 million tonnes annually by 2030. However, much larger growth is still necessary to meet net-zero targets by 2050.
CCUS is considered critical for reducing emissions from hard‑to‑decarbonize sectors like heavy industry and oil and gas. It also plays an important role in achieving Canada’s long‑term climate targets, including net-zero emissions by 2050. In these scenarios, CCUS helps bridge gaps that electrification and renewables alone cannot fill.
Canada’s Energy Innovation Program (EIP) is designed to speed up the development of clean energy technologies while keeping the energy system reliable and affordable. It supports early-stage research and development in CCUS.
The program also funds renewable energy demonstration projects that test new ways to generate and integrate clean power, especially those with local benefits. In addition, EIP promotes innovation in electricity systems by supporting new approaches to smart grid regulation and capacity building.
A Power Mix Already Going Green
Renewable energy is another core part of Canada’s climate strategy. Over the last decade, installed renewable capacity has grown steadily. Between 2014 and 2024, Canada’s total renewable energy capacity increased from about 89,773 MW to 110,470 MW.
The federal government has supported renewable projects through multiple funding programs. Earlier initiatives included a $964‑million investment targeting wind, solar, storage, hydro, and other renewable technologies.
Canada has also set decarbonization targets tied to renewables. The country aims for net‑zero electricity by 2035, which supports a broader economy‑wide goal of net‑zero greenhouse gas emissions by 2050.
CCUS and Renewables on a Global Rise
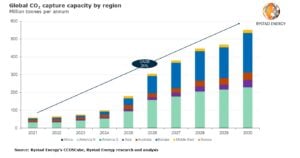
Investment in CCUS and renewable energy is rising globally. According to industry forecasts, the global clean energy market — including wind, solar, energy storage, and CCUS — is expected to continue strong growth through 2030 as countries push toward climate targets.
For CCUS specifically, analysts project that global installed capacity could grow fivefold by 2030 as more projects move from demonstration to full deployment. Canada is among several countries with mature CCUS infrastructure and planned expansions.
Renewables continue to be the fastest‑growing energy source globally. International agencies like the International Renewable Energy Agency (IRENA) project that renewable capacity will keep expanding rapidly through the end of the decade, driven by falling technology costs and climate commitments.
The Roadblocks to Scaling Clean Tech
While CCUS has potential, it also faces hurdles. Costs are high, and the technologies are still emerging at scale. Critics argue that CCUS has historically underperformed in some early projects, and that a significant amount of captured CO₂ is used in enhanced oil recovery rather than stored permanently.
Some stakeholders also warn that public funds for CCUS must be carefully targeted to avoid subsidizing continued fossil fuel use rather than meaningful emission cuts. Despite these concerns, many policymakers see CCUS as an essential component of climate strategy if Canada is to meet its 2030 and 2050 goals.
Renewable energy projects also face challenges, including grid integration, siting barriers, and supply chain constraints for equipment like turbines and solar panels. However, continued funding and clear policy signals tend to reduce these barriers over time as markets mature.
Cutting Emissions While Keeping Energy Stable
Canada’s C$29 million commitment fits into a broader pattern of public funding aimed at accelerating clean energy and decarbonization technologies. Larger federal efforts, such as the Net Zero Accelerator Initiative, provide billions of dollars over multiple years for clean tech, including CCUS deployment and industrial decarbonization.
The CCUS market is evolving from pilot projects to commercial opportunities. Meanwhile, renewable energy continues its growth as a mainstream power source. Together, these developments support Canada’s long‑term climate and economic goals.
As the global energy landscape changes, investments in both CCUS and renewables help reduce emissions, create jobs, and build resilience in a low‑carbon economy. Canada’s latest funding pledge reinforces its ongoing role in these key markets.
- READ MORE: Canada Approves First Uranium Mine in 20 Years as Tech Giants Eye Nuclear Fuel for AI Power
The post Canada Doles Out Almost C$29M for CCUS and Renewables as Clean Energy Market Surges appeared first on Carbon Credits.

Google, Meta, and McKinsey & Company have made a major move in corporate climate action. They signed a long-term deal to remove carbon from the air in Appalachia. The project is run by Living Carbon and focuses on restoring forests on degraded lands. Under this deal, the companies will remove 131,240 tonnes of CO₂ over the next ten years.
A New Deal for Climate
The effort targets a much larger problem. Across the United States, about 1.6 million acres of abandoned mine land remain damaged by past mining. These lands often have poor soil, erosion, toxic metals, and invasive species that block natural regrowth.
In addition, around 30 million acres of degraded agricultural land could be restored through reforestation. Appalachia is one of the hardest-hit regions due to decades of coal mining.
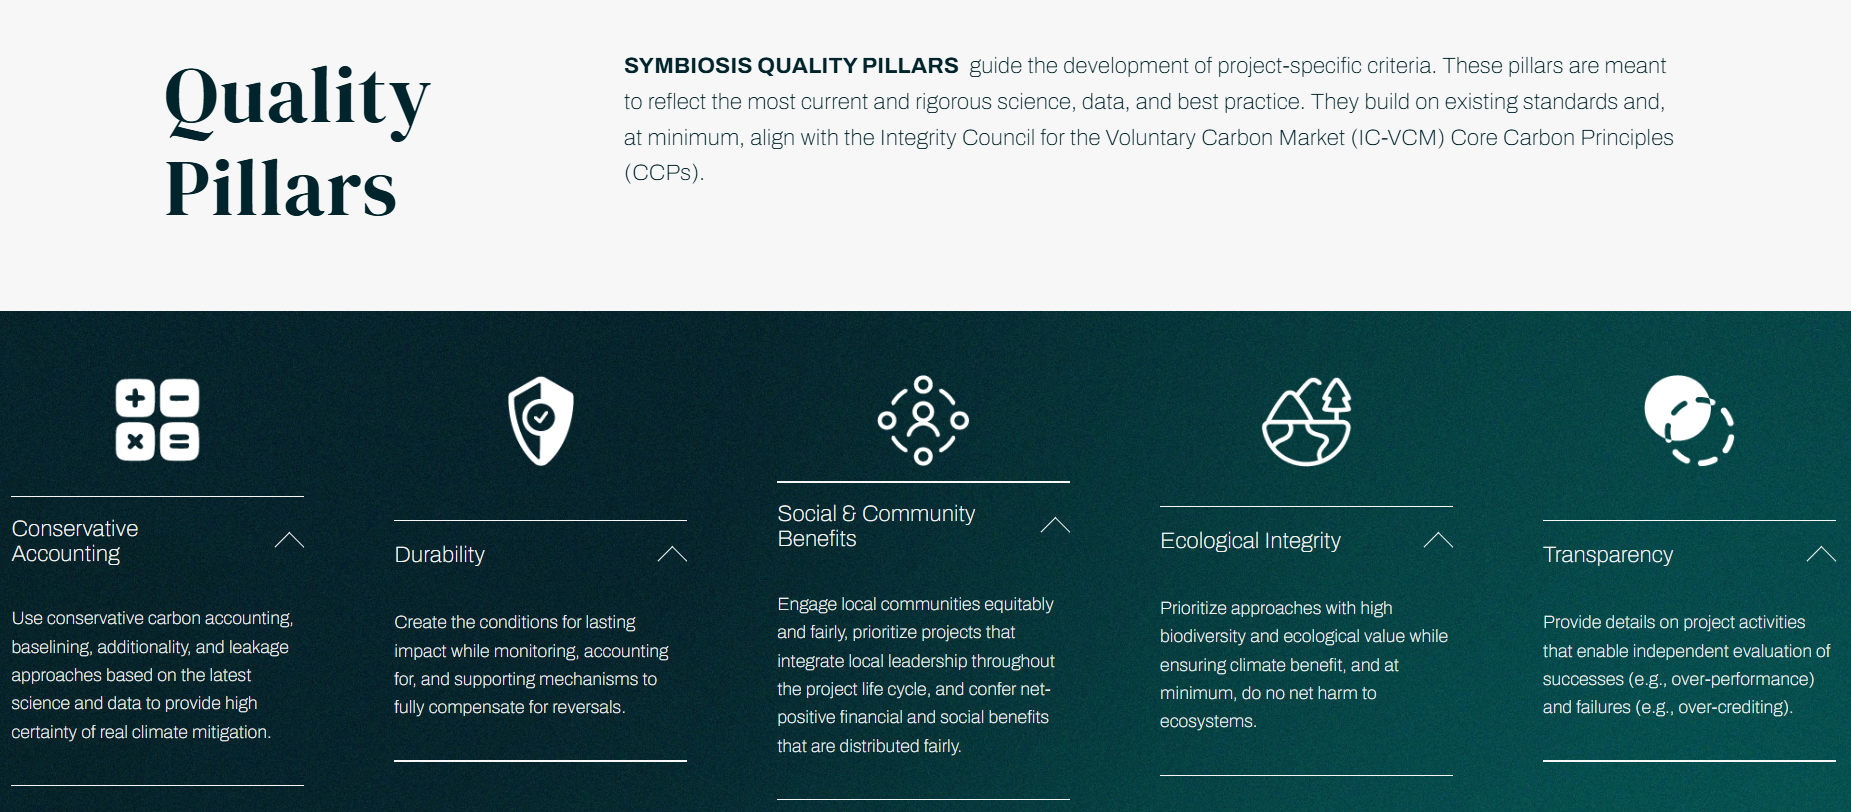
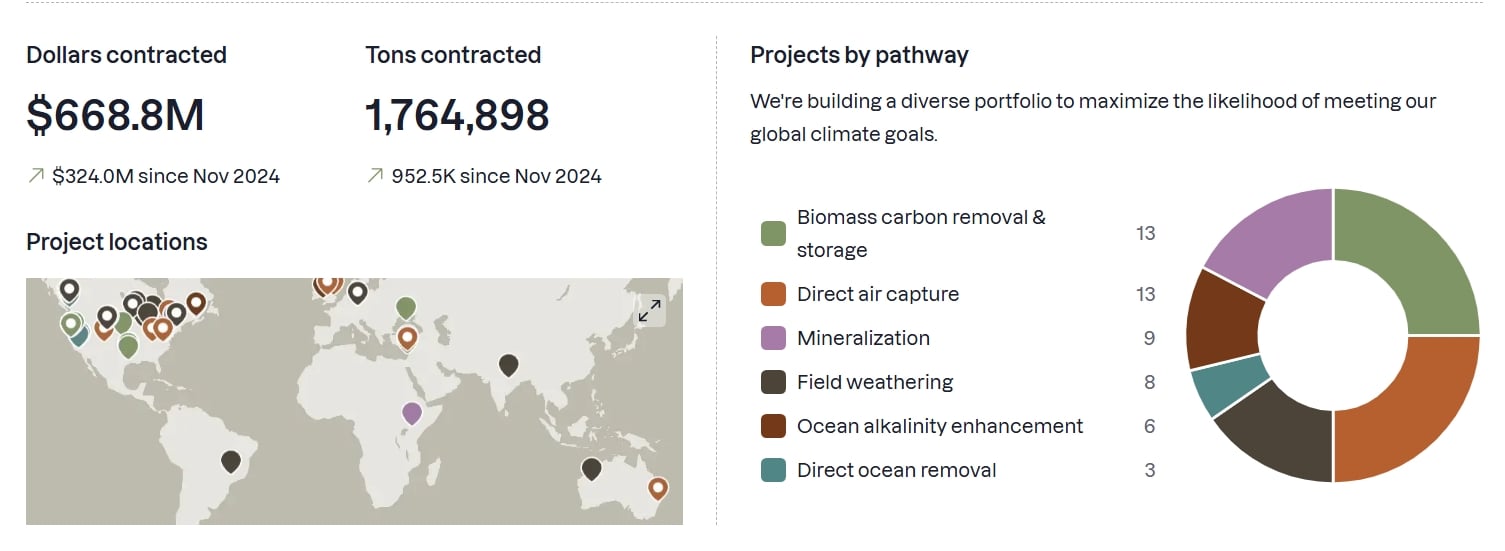
The deal is backed by the Symbiosis Coalition, a group of buyers that funds high-quality carbon removal projects. The coalition is an advance market commitment (AMC) launched in 2024 by Google, Meta, Microsoft, and Salesforce.
The group has pledged to contract up to 20 million tonnes of carbon removal credits by 2030. This commitment aims to create strong market demand and support the growth of high-impact, science-based restoration projects that can help advance global climate goals.
The agreements they have give developers a steady demand. They also help unlock financing and allow projects to scale.
Symbiosis selected the Appalachian project after a strict review process. It looked at data, field conditions, and long-term risks. The group follows key standards such as durability, transparency, ecological integrity, and community impact. This helps ensure that every credit represents real and measurable carbon removal.
Julia Strong, Executive Director of the Symbiosis Coalition, remarked:
“Our support of Living Carbon reflects our belief that effective nature-based carbon removal requires both strong science and solid execution. Their project stands out for its rigor and for its thoughtful and scalable approach shaped around the needs of local communities, ecosystems, and economies in Appalachia.”
Why Appalachia Matters: From Coal Hubs to Carbon Heroes
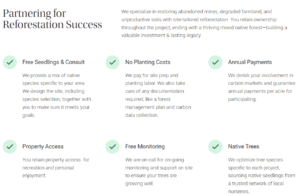
The Appalachia region, in the eastern United States, was once a center of coal mining. Today, many of these lands remain unused and degraded. Living Carbon is working to restore them by planting native hardwood and pine trees on former mine sites and damaged farmland.
The project uses a mix of careful site preparation, invasive species control, and strategic planting. This helps trees grow in areas where nature cannot easily recover on its own. The goal is not just to plant trees, but to rebuild entire ecosystems and support long-term carbon storage.
The benefits go beyond carbon removal. Restoring forests improves soil health, water quality, and biodiversity. Native trees help rebuild habitats for local plants and wildlife. These changes can also reduce erosion and improve land stability over time.
The project also creates real economic value. Landowners earn lease payments from land that was once unproductive. Local workers are hired for planting and land restoration.
-
In some cases, old mining equipment is reused to support ecological recovery. This helps turn former industrial sites into productive carbon sinks.
Community engagement is a key part of the project. Living Carbon works closely with landowners, local groups, and government agencies. This helps build long-term support and ensures the project fits local needs. Strong local partnerships also improve the chances that the forests will be maintained over time.
The project stands out for its strong science and clear execution plan. It uses careful monitoring and conservative estimates to ensure carbon removal is real. It also applies new methods for tracking results, including advanced baselines and lifecycle analysis.
This type of approach shows that high-quality nature-based carbon removal can deliver more than climate impact. It can restore ecosystems, support local economies, and scale across similar regions. In places like Appalachia, it offers a way to turn damaged land into a long-term climate solution.
Big Business Bets on Carbon Credits
More corporations are now buying carbon removal credits to meet climate goals. For example, Microsoft bought 45 million tonnes of carbon removal in fiscal year 2025. This is nearly double the amount from 2024 and nine times what they bought in 2023.
These purchases are part of a broader climate strategy. Companies are combining emissions reductions with long-term removal commitments. Durable carbon removal credits, which permanently store CO₂, are becoming more important. Businesses feel pressure to deal with emissions that they cannot completely eliminate.
A major supporter of these deals is Frontier, launched in 2022 by Stripe, Alphabet (Google’s parent company), Meta, Shopify, and McKinsey Sustainability. Frontier wants to boost early demand and funding for promising carbon removal technologies.
The company does this through long-term purchase agreements. Its initial goal was $1 billion in purchases by 2030, sending a strong signal to the market about future demand.
By 2025, Frontier signed contracts for various technologies. These include bioenergy with carbon capture and storage (BECCS), direct air capture (DAC), and enhanced weathering. Several contracts are worth tens of millions of dollars. These agreements help developers survive the early “valley of death,” when financing is hardest to secure.
Market Trends: From Niche to Necessity
The carbon removal market is still small compared with global climate goals, but it is evolving quickly. Industry forecasts say that demand for durable carbon removal credits might hit 100 million tonnes of CO₂ each year by 2030.
This growth is fueled by corporate commitments and government purchases. This is roughly double the supply currently announced, showing a large gap between demand and delivery.
Globally, carbon removal is still a tiny fraction of what is needed. Scientific assessments show that to meet the Paris Agreement, carbon removal needs to increase. By 2050, it should reach 7–9 billion tonnes of CO₂ each year. This is about 4,000 times more than what we do now.

Market projections show strong growth in the next decade. A report by Oliver Wyman and the UK Carbon Markets Forum estimates that the global carbon removal market could grow from $2.7 billion in 2023 to $100 billion per year by 2030–2035, provided policies and standards evolve to support it.
Local and Global Wins
The Appalachia project highlights how carbon removal can benefit both the climate and communities. Restoring degraded lands improves water filtration, soil health, and wildlife habitats. Communities also gain jobs and income through forest management.
Nature-based projects, including reforestation and forest management, currently dominate removal activity. However, they do not offer the same permanence as engineered removals like BECCS or DAC, which store carbon for centuries or longer. Still, both approaches are necessary to scale the carbon removal market.
From Milestones to Market Momentum
The Google, Meta, and McKinsey deal is a milestone for corporate climate action. Long-term agreements help projects secure funding and expand. They also send strong signals to developers and investors. These deals can shift the market from short-term offsets to long-term, permanent carbon removal solutions.
The industry must grow significantly to meet global climate targets. Expanding beyond early adopter companies is essential. Continued policy support, strong standards, and wider sector participation will help scale removals.
In the next decade, how fast carbon removal technologies grow and the amount of credits produced will be key to achieving net-zero goals. Deals like the Appalachia reforestation project are early steps in building a foundational, long-term carbon removal industry.
The post Google, Meta and McKinsey Lead Carbon Removal Boom and Turn Appalachia Green appeared first on Carbon Credits.


IPCC: ‘Frustrating and disappointing’ meeting leaves AR7 timeline in deadlock
Texas-Based EnergyX’s Project Lonestar™ Signals a Turning Point for U.S. Lithium Supply
Canada Doles Out Almost C$29M for CCUS and Renewables as Clean Energy Market Surges
-
Climate Change8 months ago
Guest post: Why China is still building new coal – and when it might stop
-
Greenhouse Gases8 months ago
Guest post: Why China is still building new coal – and when it might stop
-

 Greenhouse Gases2 years ago
嘉宾来稿:满足中国增长的用电需求 光伏加储能“比新建煤电更实惠”
-
Climate Change2 years ago
Bill Discounting Climate Change in Florida’s Energy Policy Awaits DeSantis’ Approval
-

 Climate Change2 years ago
嘉宾来稿:满足中国增长的用电需求 光伏加储能“比新建煤电更实惠”
-
Climate Change Videos2 years ago
The toxic gas flares fuelling Nigeria’s climate change – BBC News
-

 Renewable Energy5 months ago
Sending Progressive Philanthropist George Soros to Prison?
-

 Carbon Footprint2 years ago
US SEC’s Climate Disclosure Rules Spur Renewed Interest in Carbon Credits