

In 2025, China’s automotive maker BYD became the world’s largest seller of electric vehicles (EVs), overtaking U.S. EV pioneer Tesla for the first time. Data from multiple industry trackers shows that BYD sold about 2.26 million battery electric vehicles (BEVs) in 2025.
In contrast, Tesla delivered about 1.64 million EVs in the same year, marking a decline from its 2024 figures. This shift marks a major change in the global EV market.
From Challenger to Market Leader: BYD’s Breakthrough Year
BYD’s EV sales showed strong momentum throughout 2025. Its pure battery electric vehicle deliveries rose by roughly 28% year on year, reaching more than 2.25 million units worldwide. This steady growth allowed BYD to move ahead of Tesla in total annual BEV sales.
Tesla, by comparison, reported a decline of about 9-10% in overall vehicle deliveries versus the previous year. As a result, 2025 marked the first full calendar year in which BYD sold more battery electric vehicles than Tesla.

The gap became more visible in the second half of the year. Demand for EVs softened in some of Tesla’s key markets, particularly as higher interest rates and reduced incentives affected consumer spending. BYD, however, continued to benefit from strong demand in China and improving sales abroad.
By year’s end, the gap in total EV deliveries between the two companies grew to several hundred thousand units. This marked a clear shift in market leadership.
Quarterly data reinforced this trend. In the fourth quarter of 2025, Tesla delivered around 418,000 vehicles, representing a 15–16% drop from the same period in 2024. This decline reflected slower sales growth and increased competition.
BYD’s fourth-quarter BEV deliveries, in contrast, continued to rise. Its consistent quarterly growth helped push its full-year sales past Tesla’s and confirmed its position as the world’s largest EV seller by volume.
Why China’s EV Champion Is Scaling Faster
Several factors helped drive BYD’s expansion in global EV sales during 2025. A key driver was strong domestic demand in China, the world’s largest electric vehicle market.
Chinese automakers lead in local EV sales. This is thanks to consumer trust in domestic brands and a strong charging network in big cities. BYD benefited directly from this environment.
From January to November, industry estimates China’s NEV wholesale sales are about 13.78 million units. This shows a 29% increase compared to last year, and BYD captured a dominant 32% domestic share. This home-market strength fueled its global BEV leadership.

The product range also played an important role. BYD offers a wide lineup of EV models, including many lower-priced options that appeal to cost-conscious buyers. These vehicles attracted customers looking for practical electric cars rather than premium models. This broader appeal helped BYD reach a larger customer base than some competitors.
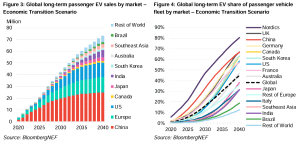
At the same time, BYD’s exports hit 1.05 million units in 2025, up 200% from the previous year. Europe and Latin America are key drivers of this growth. Globally, BYD claimed 12.1% of the BEV market in 2025, ahead of Tesla’s 8.8% and Volkswagen’s 5.2%, cementing the competitive shift.
Competitive pricing and improving vehicle quality helped BYD gain traction in these markets. Policy support also contributed, as incentives and trade policies in several regions made imported EVs more competitive.
Together, these factors allowed BYD to sustain sales growth even as demand softened for some rival brands.
Tesla Under Pressure in a Crowded EV Arena
Tesla’s sales declines in 2025 were linked to several challenges, including:
- Reduced demand after EV tax incentives ended in the United States, particularly the federal EV tax credit that expired in late 2025. This had encouraged buyers to purchase earlier in the year.
- Stronger competition from Chinese brands, not only BYD but also other manufacturers, is entering global markets.
- Market saturation in some regions, where potential customers postponed purchases or chose alternatives.
Tesla remains a major EV maker, but it saw its first consecutive annual drop in deliveries. By contrast, BYD increased its volume while expanding into new regions.
The EV Market Is Still Growing—But Leadership Is Shifting
The global EV market continues to grow, with total EV sales rising annually as more countries push toward cleaner transport. Analysts see strong demand for electric cars continuing this decade. Climate goals and stricter emissions rules in many areas support this trend.
Industry forecasts say global EV deliveries might keep growing until 2030. This growth is due to lower battery costs and more models from various automakers.
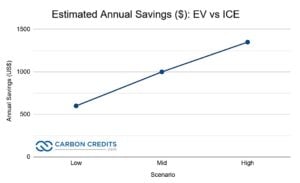
Industry forecasts project global EV sales reaching 40–50% of total car sales by 2030, up from ~20 million units in 2025. Battery pack prices have fallen to $115/kWh in 2024. They could further drop to $80–$99/kWh by 2026 (50% decline), enabling price parity with gas cars.
Nations in Europe and Asia are pushing zero‑emission vehicle targets as part of their climate commitments, which may further expand EV adoption.
Europe targets 90% CO2 cut by 2035 for new cars (easing from 100%, allowing some e-fuels/PHEVs). China aims for ~60–90% EV/NEV sales by 2030.
Still, challenges remain. EV buyer incentives vary by country and can affect sales patterns, as seen in the U.S. when federal credits expired. Some regions face infrastructure gaps, like limited charging networks, which can slow growth. Continued cost reductions and broader infrastructure rollouts will be key to sustaining EV adoption long term.
Emissions, Energy, and the Bigger Climate Picture
Electric vehicles are central to efforts to reduce greenhouse gas emissions from transport by 70–90% over their lifecycle compared to gasoline cars. This holds even with current grids.
- For EVs, emissions range from 200–500 gCO2/km, while ICEVs emit 200–300 gCO2/km.
Global transport represents 24% of CO2 emissions (8 GtCO2e). EVs could slash this by 40% by 2030 at 40% adoption. Clean grids, renewables >60% by 2030, boost EV advantage to near-total decarbonization.

Also, EVs produce zero tailpipe emissions and can lower overall carbon output when charged with renewable electricity. As more power grids shift toward clean energy sources, the lifetime emissions advantage of EVs grows.
BYD’s sales surge contributes to this global transition. As one of the largest EV producers, its growth means more EVs are on the road worldwide. This supports international efforts to cut emissions from passenger cars, which remain a major source of global greenhouse gases.
However, the environmental impact of EV manufacturing, especially battery production, remains a focus of industry and policy discussions. Sustainable practices in sourcing materials and recycling batteries will be crucial to maximizing the environmental benefits of EV growth.
A New Global Auto Order Takes Shape
BYD’s rise to the top reflects broader changes in the global auto sector:
- Chinese carmakers are gaining ground internationally, not just in their home market.
- Competition in EV segments is increasing, pushing companies to innovate faster on cost, range, and technology.
- Tesla’s leadership is challenged, even as it pushes into areas like autonomous driving and energy products.
The shift also highlights how consumer preferences are evolving, with buyers showing strong interest in different EV brands and models beyond traditional market leaders. As EV technology matures, more brands are expected to capture market share and expand globally.
The post BYD Overtakes Tesla as World’s Biggest EV Seller in 2025 appeared first on Carbon Credits.
Carbon Footprint
Verra to Launch Scope 3 Standard in 2026: A New Era for Value Chain Carbon Tracking

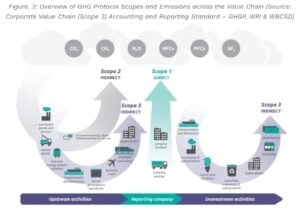
The post Verra to Launch Scope 3 Standard in 2026: A New Era for Value Chain Carbon Tracking appeared first on Carbon Credits.

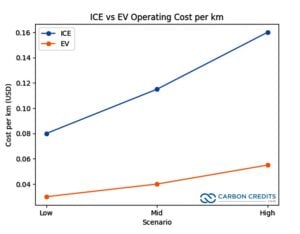
Rising global oil prices are driving up demand for electric vehicles (EVs), with Chinese brands emerging as key beneficiaries. Recent spikes in crude prices are driven by heightened tensions in the Middle East and disruptions in the Strait of Hormuz, a critical oil shipping route.
These factors have pushed Brent crude above $100 per barrel and created instability in fuel markets. This has pushed many consumers to rethink fuel costs and consider EV alternatives. Higher fuel prices increase running costs for gasoline and diesel cars, making EV ownership more economical in many markets.
Chinese EVs Gain Speed Abroad
Dealers in countries like Australia and parts of Southeast Asia see growing interest in Chinese EVs. This rise comes as fuel prices increase.
Showrooms selling Chinese new energy vehicles (NEVs) are seeing more test drives, customer inquiries, and rising order volumes. In Australia, the EV market share hit a record high of 11.8% for vehicle sales. Analysts say this jump is partly due to rising petrol prices.
Chinese manufacturers like BYD, GWM, and Chery are rapidly growing abroad. Some dealers see more walk-ins and more customers buying EVs.
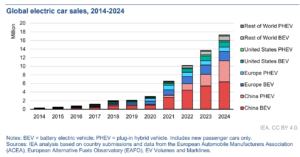
China’s EV industry is now the largest in the world. In 2024, Chinese automakers produced over 12.87 million plug‑in electric vehicles (PEVs), including battery electric (BEV) and plug‑in hybrid models, accounting for nearly 47.5% of total automobile production. That figure marked a strong year‑on‑year rise and underscored China’s industrial scale and export readiness.
By late 2025, more than 51% of all new vehicles sold in China were electric — a major shift from just a few years earlier.
This domestic scale provides an export advantage. Chinese EVs often cost less than similar European and North American models. This helps them succeed in markets where fuel costs hit household budgets hard.
Fuel Costs Drive Behavior Shift
Rising oil prices are a major driver of these sales trends. Global crude prices have fluctuated due to geopolitical tensions. The Strait of Hormuz route carries around 20% of the world’s oil trade. These disruptions pushed crude prices sharply higher in early 2026.
In many countries, higher retail fuel prices translate into more immediate cost pressures for consumers. Reports from countries like Australia show petrol prices over $2.50 per litre. This rise is making consumers think about EVs to lower long-term costs.
Global EV Market Trends and Forecasts
The surge in Chinese EV exports aligns with broader global trends. Major industry forecasts suggest that global sales of battery electric and plug-in hybrid vehicles may top 22 million units by 2025. This could represent about 25% of all new car sales worldwide.
Global electric vehicle sales in 2025 reached nearly 21 million units, including both battery electric vehicles and plug‑in hybrid electric vehicles. This total represents a significant increase, roughly 20 % more than in 2024.
China’s share in this global growth is large. In 2024, Chinese manufacturers made up around 70% of all EV exports. This shows China’s key role in supply chains and manufacturing.
As oil demand growth slows due to EV uptake, some forecasts suggest that EVs could displace millions of barrels of global oil demand each day in the coming decade. By 2030, EV adoption could cut about 5 million barrels per day of oil use, according to major energy outlooks.
Trade Barriers vs Expansion
Despite strong export gains, barriers remain. Some regions have imposed tariffs and trade restrictions on Chinese EVs, and infrastructure gaps in charging networks can slow adoption. For example, tariffs exceeding 100% on certain Chinese EV imports in the U.S. have limited market share there.
However, Chinese OEMs are developing supplier and shipping capacity to support overseas demand. In 2025, China’s electric car makers expanded shipping through roll‑on/roll‑off carriers capable of transporting more than 30,000 vehicles, improving export logistics.
Emerging markets in Southeast Asia, Latin America, and Oceania are also showing rising EV interest. In the Philippines and Vietnam, dealerships see EV orders growing quickly. Some are even doubling their weekly sales, thanks to high fuel costs.
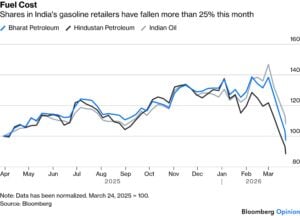
In India, where oil imports make up a big part of the economy, rising petrol costs make running traditional fuel vehicles more expensive. This has helped boost interest in electric vehicles, which are cheaper to operate when fuel is costly. Notably, the share of ICE retailers fell by over 25% in March.
Indian consumers and businesses view EVs as a way to shield against unstable oil prices. This also helps lower fuel costs, supporting the country’s move to electric transport.
What This Means for Energy and Transport Futures
The convergence of high oil prices and strong EV supply from China is creating a feedback loop. Higher fuel costs push consumers to consider EVs more seriously. Chinese manufacturers are well positioned to fill that demand with competitive pricing and large production scale.
The shift could speed up the move from fossil fuel cars to electric vehicles worldwide. This is especially true in price-sensitive and emerging markets. EV adoption also has implications for oil demand trends.
- As battery and charging tech get better and EV markets grow, oil use — especially in transport — might slow down or peak sooner than we thought.
At the same time, governments and industry groups are tracking these shifts closely. Policies that support charging infrastructure, EV incentives, and emissions standards will influence how quickly the global fleet electrifies.
Ultimately, the current oil price shock may have sparked a shift in global automotive markets — one where Chinese EVs take an increasingly central role in transport electrification worldwide.
The post Oil Shock Ignites Chinese EV Export Surge Around the World appeared first on Carbon Credits.
The U.S. is witnessing a surge in utility-scale solar development, driven by growing corporate demand for clean energy. Major tech companies like Meta and Google are securing long-term deals in Texas, combining renewable energy growth with economic and grid benefits.
This trend highlights how corporate commitments are shaping the future of the clean energy transition. Let’s find out.
Zelestra and Meta’s $600 Million Solar Deal
Madrid-based renewable energy firm Zelestra secured a massive $600 million green financing facility, signaling strong investor confidence in utility-scale solar. The funding, backed by Société Générale and HSBC, will support two large solar projects in Texas—Echols Grove (252 MW) and Cedar Range (187 MW).
These projects are not standalone efforts. Instead, they are part of a broader clean energy partnership with Meta, one of the world’s largest corporate renewable energy buyers. Together, they form a portion of a seven-project portfolio totaling 1.2 GW under long-term power purchase agreements (PPAs).
Sybil Milo Cioffi, Zelestra’s U.S. CFO, said:
“This financing marks a significant milestone in the delivery of our largest U.S. solar projects to date. It reflects strong confidence from Societe Generale and HSBC in our strategy and execution capabilities and reinforces our ability to attract first-class capital to support our growth platform in the U.S. market.”
Zelestra is strengthening its presence in the U.S. energy market with innovative solutions for hyperscalers and corporate clients. It is developing around 15 GW of renewable projects across key markets. In February 2026, BloombergNEF ranked Zelestra among the top 10 PPA sellers to U.S. corporations.
Solar Powering Meta’s Climate Strategy
Meta continues to aggressively expand its clean energy footprint. The company has made renewable energy procurement a core part of its climate roadmap—and the numbers clearly reflect that shift.
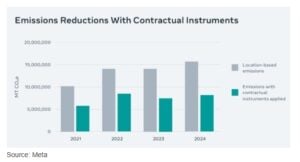
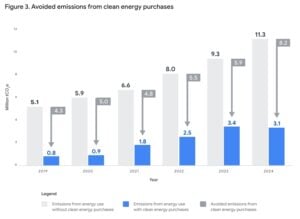
In 2024, Meta reported emissions of 8.2 million metric tonnes of CO₂e after accounting for clean energy contracts. In comparison, its location-based emissions stood at 15.6 million tonnes. This marked a sharp 48% reduction, largely driven by renewable energy purchases.
Moreover, the company has consistently maintained momentum:
- Since 2020, it has matched 100% of its electricity consumption with renewable energy.
- Over the past decade, it has secured more than 15 GW of clean energy globally.
- Overall, renewable energy procurement has helped cut 23.8 million MT CO₂e emissions since 2021.
As a result, Meta cut operational emissions by around 6 million tonnes in 2024 alone. At the same time, it tackled value chain emissions using Energy Attribute Certificates (EACs), reducing Scope 3 emissions by another 1.4 million tonnes.
Most of these deals were concentrated in the U.S., highlighting the country’s growing importance in corporate decarbonization strategies.
Importantly, this collaboration goes beyond just energy supply. It also aims to deliver broader economic benefits, including:
- Local job creation during construction
- Long-term tax revenue for the region
- Continued investment in local infrastructure
David Lillefloren, CEO at Sunraycer, said:
“These agreements with Google represent a significant milestone for Sunraycer and underscore the strength of our development platform. We are proud to support Google’s clean energy objectives while delivering high-quality renewable infrastructure in Texas.”
Additionally, the deal was facilitated through LevelTen Energy’s LEAP process, which simplifies and speeds up PPA execution. This highlights how innovative platforms are now playing a key role in scaling renewable deployment.
“Google’s data centers are long-term investments in the communities we call home,” said Will Conkling, Director of Energy and Power, Google. “This collaboration with Sunraycer will fuel local economic growth while helping to build a more robust and affordable energy future for Texas.”
Google, like Meta, has built a strong clean energy portfolio over time. Since 2010, it has signed over 170 agreements totaling more than 22 GW of capacity worldwide. Its long-term ambition is even more ambitious—achieving 100% carbon-free energy, every hour of every day, by 2030.
Why Texas Is Becoming the Center of Energy Transformation
All these developments point to one clear trend—Texas is rapidly becoming a global hub for clean energy and data center growth.
On one hand, the state offers strong solar resources, vast land availability, and a deregulated power market. On the other hand, it is witnessing a surge in electricity demand, especially from data centers and AI-driven workloads.
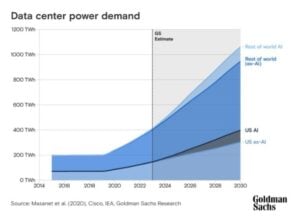
According to projections from the EIA, U.S. electricity demand could rise by 20% or more by 2030. Data centers are expected to play a major role in this growth. In fact, energy consumption from data centers increased by over 20% between 2020 and 2025.
As a result, energy infrastructure in Texas is facing growing pressure. Rising industrial activity, extreme weather events, and rapid digital expansion are all contributing to grid stress. Yet, at the same time, this demand is driving unprecedented investment in renewable energy.
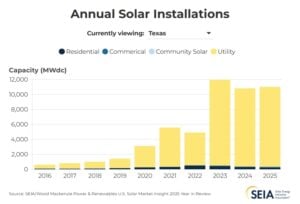
The EIA expects Texas to lead solar expansion in the coming years, accounting for nearly 40% of new solar capacity in the U.S. California will follow closely, and together, the two states will drive almost half of total additions.
Even though the sector has faced temporary slowdowns, the long-term outlook for U.S. solar remains highly positive.
In 2025, the U.S. added 53 GW of new electricity capacity—the highest annual addition since 2002. Notably, wind and utility-scale solar together generated 17% of the country’s electricity, a massive jump from less than 1% two decades ago.
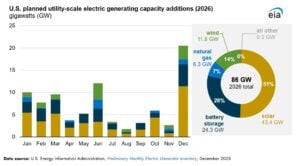
Looking ahead, growth is expected to accelerate again. Developers are planning to add around 86 GW of new capacity in 2026, which could set a new record. Solar alone is projected to account for more than half of this expansion.
Breaking it down further:
- Solar is expected to contribute 51% of new capacity
- Battery storage will make up 28%
- Wind will account for 14%
Utility-scale solar capacity additions could reach 43.4 GW in 2026, marking a 60% increase compared to 2025 levels.
Analysis: Corporate Demand Is Reshaping Energy Markets
Overall, the developments from Zelestra, Meta, Google, and Sunraycer highlight a broader transformation underway in global energy markets.
First, corporate buyers are no longer passive participants. Instead, they are actively shaping energy infrastructure through long-term PPAs. These agreements provide stable revenue for developers while ensuring a clean power supply for companies.
Second, financing is becoming more accessible. Large-scale funding deals, like Zelestra’s $600 million facility, show that banks are increasingly willing to back renewable projects with strong contractual support.
Third, regions like Texas are emerging as strategic energy hubs. The combination of rising electricity demand and favorable renewable conditions is attracting both developers and corporate buyers.
However, challenges remain. Grid reliability, permitting delays, and policy uncertainty could still impact the pace of deployment. Even so, the overall trajectory remains clear.
Clean energy demand is rising fast. Big Tech is leading the charge. And solar power is set to play a central role in meeting future electricity needs.
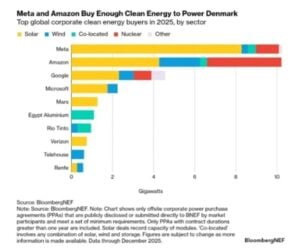
- READ MORE: Meta, Amazon, Google, and Microsoft Dominate Clean Energy Deals as Global Buying Slips in 2025
The post Texas Solar Market Heats Up with Meta and Google Investments appeared first on Carbon Credits.


Sustainability In Your Ear: Schneider Electric’s Steve Wilhite Maps the Renewable Energy Transition

The West Is Burning Before Summer Even Starts, and It’s No Accident
Island nations fight to save cultural heritage from climate change
-
Climate Change8 months ago
Guest post: Why China is still building new coal – and when it might stop
-
Greenhouse Gases8 months ago
Guest post: Why China is still building new coal – and when it might stop
-

 Greenhouse Gases2 years ago
嘉宾来稿:满足中国增长的用电需求 光伏加储能“比新建煤电更实惠”
-
Climate Change2 years ago
Bill Discounting Climate Change in Florida’s Energy Policy Awaits DeSantis’ Approval
-

 Climate Change2 years ago
嘉宾来稿:满足中国增长的用电需求 光伏加储能“比新建煤电更实惠”
-
Climate Change Videos2 years ago
The toxic gas flares fuelling Nigeria’s climate change – BBC News
-

 Renewable Energy5 months ago
Sending Progressive Philanthropist George Soros to Prison?
-

 Carbon Footprint2 years ago
US SEC’s Climate Disclosure Rules Spur Renewed Interest in Carbon Credits