

Power-sector emissions have fallen by 20% across the EU since the last European parliamentary election in 2019, according to Carbon Brief analysis.
Between 6-9 June, around 360 million people across the EU will vote for representatives from national parties to sit in the European Parliament.
The grouping or coalition with the most seats will help to shape the leadership of the next European Commission. The overall composition of parliament will also influence the bloc’s priorities between 2024-2029.
Climate change and energy once again feature prominently in the manifestos of the major parties, with mounting pressure to secure energy supplies in the wake of Russia’s invasion of Ukraine drawing particular focus.
Core to this is a transition to decarbonised domestic energy. Carbon Brief’s analysis shows that the relatively small nations of Portugal, Latvia and Finland have led the way since the last EU election, with the largest percentage drop in power-sector emissions between 2019 and 2023.
Malta and the Netherlands have led in increasing their renewables shares, with the Netherlands also seeing the largest absolute increase in renewable generation.
Meanwhile, fossil-fuel generation fell in all but three countries when comparing 2019 and 2023.
Other key findings from the analysis include:
- All national power systems across the EU are cleaner than in 2019, with EU renewables share increasing from 34% in 2019 to 44% in 2023.
- Germany saw the largest fall in power-sector emissions in absolute terms since the last EU emissions.
- There were just three EU countries where fossil fuel use has increased since 2019 – Malta, Croatia and Lithuania.
- The Czech Republic remains the biggest per-capita emitter in the EU, but per-capita emissions fell in all but three countries.
- Overall, all of the EU’s power systems have become cleaner since 2019, with the most carbon-intensive grid (Poland) making the fourth most progress in absolute terms.
- Malta and the Netherlands have increased their renewables share by more than 150% relative to 2019.
- Spain added the most solar generation in absolute terms. Poland increased its solar generation by more than 1,500%, increasing generation by 12TWh.
In this analysis, Carbon Brief looks at how the electricity sector has changed since the last election.
All of the EU’s power systems cleaner than 2019
Every national power system across the EU has become cleaner since the last European Parliamentary election in 2019, Carbon Brief analysis shows.
Finland led the way in terms of reducing grid intensity – the measure of how clean the electricity within national grids is – halving its intensity between 2019 and 2023 to become the third cleanest in the EU, behind France and Sweden.
In absolute terms, Greece reduced its grid intensity the most since 2019, Carbon Brief shows. The country hit a new record high level of clean energy generation, with power grid operator IPTO announcing that renewables and hydroelectric plants accounted for 57% of the country’ energy in 2023.
Germany saw the largest fall in power-sector emissions in absolute terms – namely, the overall volume of CO2 emissions produced. Like Greece, the country had a “landmark” 2023 for renewable generation, according to thinktank Ember.
Carbon Brief analysis shows that power-sector emissions in Germany fell by 43.23m tonnes of carbon dioxide (MtCO2), or 18.4%, of 2019 values by 2023.
Despite this significant drop, the country’s power sector is still the most polluting of all EU countries, responsible for 29.3% of EU power-sector emissions. This places it far ahead of Poland, the second largest polluter, which is responsible for 17% of emissions.
Germany has one of the largest populations in Europe and its energy demand sits at 514TWh (19% of EU total). When looking at per-capita emissions (as shown below), the country sits fourth in the EU for emissions, seeing a reduction of 0.51tCO2 in 2023 compared with 2019.
Portugal, Latvia and Finland decarbonised their power sectors the most relative to 2019, analysis shows.
Portugal saw renewables supply 61% of its electricity consumption in 2023, according to the country’s grid operator Redes Energéticas Nacionais. This totaled 31.2TWh – the most it has ever recorded. This included a period in November where the country ran on just renewables for six days in a row.
Carbon Brief’s analysis of Ember data placed the 2023 figure even high, with 73% of electricity from renewable sources.
As shown in the chart below, there were just three EU countries where power-sector emissions have increased since 2019 – Malta, Croatia and Lithuania. These countries are some of the smallest in Europe, collectively accounting for less than 1% of total EU power generation in 2023.

Malta increased its power-sector emissions by 0.11MtCO2, or 10.3%, of 2019 emissions. As an island nation, Malta’s energy system is still heavily dominated by imported oil and gas, making up nearly 90% of power generation. (Malta has some of the lowest per-capita emissions in Europe, with 5.3 tonnes CO2 equivalent (tCO2e) per inhabitant in 2019, well below the EU average of 8.4tCO2e.)
Croatia, where emissions increased by 0.4MtCO2 or 13%, is similarly reliant on fossil fuels, with coal still dominating its power sector. While power demand has remained stable in recent years, net imports of electricity have dropped likely due to higher electricity prices in neighbouring countries.
Although renewable generation offset most of this, it did lead to a small jump in fossil fuel use of ~1TWh.
Lithuania saw emissions increase by 0.32MtCO2, from 0.57MtCO2 in 2019 to 0.89MtCO2 in 2023, Carbon Brief analysis shows. The country is currently heavily reliant on electricity imports, after the closure of its only nuclear power plant in 2010 changed it from a net exporter to a net importer.
Chris Rosslowe, senior energy and climate data analyst at Ember, tells Carbon Brief:
“Trends in generation in Lithuania don’t tell you as much as in other countries as it imports most of its electricity since shutting down nuclear power in 2010. Import dependence is slowly lowering though – from ~75% in 2019 to ~55% in 2023 – and, like Croatia, renewables are growing faster than fossils.”
It is undergoing a particularly key period of transition. Lithuania’s electricity grid currently operates synchronously with the Russia-Belarus power system, but it is planning to de-synch by 2025 and instead run with the continental Europe grid.
Additionally, it is among the countries that are seeing the fastest expansion of wind generation. It is also targeting halving its imports and generating 70% of its electricity from domestic sources by 2030, as it pushes for increased energy sovereignty and security.
Rosselowe notes that Malta, Croatia and Lithuania are all expected to reduce their dependence on fossil fuels in the coming years, offset in large part by growing renewables.
Overall, the Czech Republic remains the biggest per-capita emitter in the EU, as shown in the chart below. Between 2019 and 2023, emissions in the country did drop from 4tCO2 to 3.2tCO2, but it still sits 0.9tCO2 above the second highest per-capita emitter Cyprus (3.1tCO2).

The three countries that saw an increase in per-capita emissions match those where there was an increase in fossil fuel generation – Malta, Croatia and Lithuania.
Renewable generation grows in all but one country
Between 2019 and 2023, the share of renewable generation in the EU increased in all by one country, according to Carbon Brief analysis.
Italy saw renewable generation fall from 115.83 terawatt hours (TWh) in 2019 to 114.8TWh in 2023. This was broadly due to the impact of droughts in the country affecting hydropower generation, which hit in 2022, but had a continued impact in 2023.
This was a wider dynamic seen globally, which kept the world from hitting peak electricity generation emissions in 2023.
Slovakia, meanwhile, was the only country to see a dip in its share of renewable energy when comparing 2019 and 2023. This was minor, falling just 0.65% from 23.57% to 22.92%. The country has one of the smallest energy demands in Europe and, like Italy, saw a drop in hydro driven by droughts in 2022.
Malta and the Netherlands saw their share of renewables increase by more than 150% in 2023 relative to 2019, Carbon Brief analysis shows.
The Netherlands increased its absolute share of renewable generation by close to 30% since 2019, as shown in the chart below. The country seeing the largest absolute increase in renewable generation, closely followed by Spain.

Nearly half the electricity produced in the Netherlands is now renewable, according to the Dutch Central Bureau for Statistics.
This was predominantly wind generation, with the country adding more wind power than any other country in the EU between 2019 and 2023, both relatively and in absolute terms. Overall, the Netherlands increased its wind generation by 152% and Finland followed closely behind with a 143% rise.
Latvia, similarly, saw significant growth, with the share of renewables jumping from 49.5% in 2019 to 76.6% in 2023. This 27.1% increase is particularly key for the country, as it continues to target reducing its dependence on energy imports from Russia.
Spain added more solar generation in absolute terms over the four-year period than any other country in the EU, tripling its overall renewable generation.
Poland increased its solar generation by more than 1,500%, increasing generation by 12TWh albeit from a low starting point of just 0.71TWh in 2019. Renewables generated a record 26% of electricity in the country in 2023. However, coal still produces most of the country’s electricity and continues to have a powerful impact on policy due to powerful lobbies.
Hungary has increased its solar share of generation the most since 2019, with an increase of 14%. It was followed closely by the Netherlands, with a 12.8% increase. Luxembourg increased wind power share of generation by more than the Netherlands – 17%.
Just three EU countries see fossil fuel generation increase
Overall, just three EU countries – Malta, Croatia and Lithuania – saw an increase in the share of fossil fuel generation in 2023 relative to 2019, according to Carbon Brief analysis.
Over the same period, Luxembourg and Finland reduced fossil generation by more than 60%.
The Netherlands has reduced its fossil fuel share in the electricity system the most since 2019, falling by close to 30%. As shown in the chart below, this fall was mirrored by a significant increase in renewable energy generation.

In comparison with 2019, Ireland saw an increase in coal generation in 2023 making it the only EU nation to do so. In 2019, coal generation was at a record low in the country (0.51TWh) before jumping to 2.72TWh in 2022 due to a drop in wind generation.
However, since that point coal power generation has been continuing to fall again, in line with the wider trend seen over the past few decades.
Ireland has seen total electricity demand increase by more than 60% since 2019, Carbon Brief analysis shows. The country’s energy demand has been particularly driven by the growth of data centres, which accounted for 18% of energy demand in 2022, for example.
Despite the blip in coal generation, the share of fossil fuels fell by 2.5% between 2019 and 2023.
Portugal reduced its use of coal the most, relative to 2019, while Germany reduced the most in absolute terms. As discussed above, this was supported by surging renewable generation in both countries.
Pieter de Pous, programme lead in E3G’s fossil fuel transition programme, tells Carbon Brief:
“Europe’s phaseout of coal has been one of its biggest, most historical, monumental success stories of the last couple of years when you think about it. We’ve dropped consumption since 2016 by 50%, right? It’s really enormous and it’s a story that’s rarely told.”
The last European Parliament elections saw a “green wave” of climate-focused politicians winning seats across the continent. In the years that followed, the EU approved a European Green Deal, including goals to cut emissions by 55% from 1990 levels by 2030 and reach net-zero by 2050.
European member states now have a “critical role” to play in implementing what has been agreed, notes Rosslowe. He adds:
“The next legislative agenda is likely to be built around themes of security and competitiveness. The first main task regarding energy and climate for the new parliament will be to appoint a team of commissioners who will tackle these – and any other new policy priorities – in a way that complements rather than competes with the objectives of the Green Deal.”


The post Analysis: European power-sector emissions fall by 20% since last EU election appeared first on Carbon Brief.
Analysis: European power-sector emissions fall by 20% since last EU election

Drought and heatwaves occurring together – known as “compound” events – have “surged” across the world since the early 2000s, a new study shows.
Compound drought and heat events (CDHEs) can have devastating effects, creating the ideal conditions for intense wildfires, such as Australia’s “Black Summer” of 2019-20 where bushfires burned 24m hectares and killed 33 people.
The research, published in Science Advances, finds that the increase in CDHEs is predominantly being driven by events that start with a heatwave.
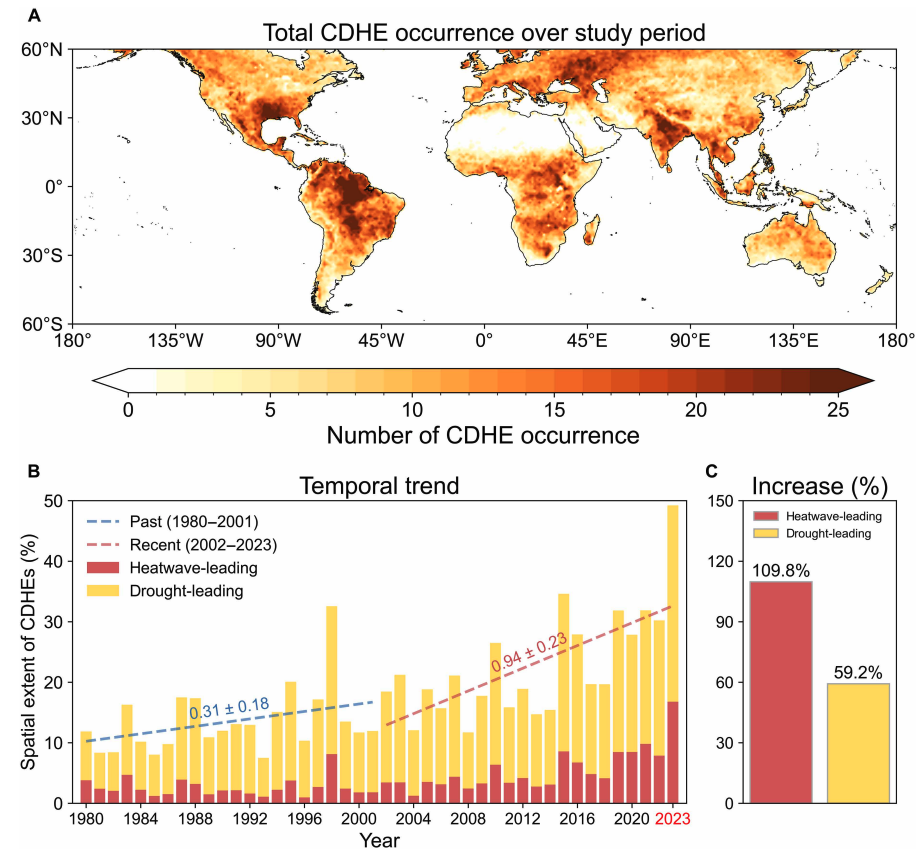
The global area affected by such “heatwave-led” compound events has more than doubled between 1980-2001 and 2002-23, the study says.
The rapid increase in these events over the last 23 years cannot be explained solely by global warming, the authors note.
Since the late 1990s, feedbacks between the land and the atmosphere have become stronger, making heatwaves more likely to trigger drought conditions, they explain.
One of the study authors tells Carbon Brief that societies must pay greater attention to compound events, which can “cause severe impacts on ecosystems, agriculture and society”.
Compound events
CDHEs are extreme weather events where drought and heatwave conditions occur simultaneously – or shortly after each other – in the same region.
These events are often triggered by large-scale weather patterns, such as “blocking” highs, which can produce “prolonged” hot and dry conditions, according to the study.
Prof Sang-Wook Yeh is one of the study authors and a professor at the Ewha Womans University in South Korea. He tells Carbon Brief:
“When heatwaves and droughts occur together, the two hazards reinforce each other through land-atmosphere interactions. This amplifies surface heating and soil moisture deficits, making compound events more intense and damaging than single hazards.”
CDHEs can begin with either a heatwave or a drought.
The sequence of these extremes is important, the study says, as they have different drivers and impacts.
For example, in a CDHE where the heatwave was the precursor, increased direct sunshine causes more moisture loss from soils and plants, leading to a drought.
Conversely, in an event where the drought was the precursor, the lack of soil moisture means that less of the sun’s energy goes into evaporation and more goes into warming the Earth’s surface. This produces favourable conditions for heatwaves.
The study shows that the majority of CDHEs globally start out as a drought.
In recent years, there has been increasing focus on these events due to the devastating impact they have on agriculture, ecosystems and public health.
In Russia in the summer of 2010, a compound drought-heatwave event – and the associated wildfires – caused the death of nearly 55,000 people, the study notes.

The record-breaking Pacific north-west “heat dome” in 2021 triggered extreme drought conditions that caused “significant declines” in wheat yields, as well as in barley, canola and fruit production in British Columbia and Alberta, Canada, says the study.
Increasing events
To assess how CDHEs are changing, the researchers use daily reanalysis data to identify droughts and heatwaves events. (Reanalysis data combines past observations with climate models to create a historical climate record.) Then, using an algorithm, they analyse how these events overlap in both time and space.
The study covers the period from 1980 to 2023 and the world’s land surface, excluding polar regions where CDHEs are rare.
The research finds that the area of land affected by CDHEs has “increased substantially” since the early 2000s.
Heatwave-led events have been the main contributor to this increase, the study says, with their spatial extent rising 110% between 1980-2001 and 2002-23, compared to a 59% increase for drought-led events.
The map below shows the global distribution of CDHEs over 1980-2023. The charts show the percentage of the land surface affected by a heatwave-led CDHE (red) or a drought-led CDHE (yellow) in a given year (left) and relative increase in each CDHE type (right).
The study finds that CDHEs have occurred most frequently in northern South America, the southern US, eastern Europe, central Africa and south Asia.
Threshold passed
The authors explain that the increase in heatwave-led CDHEs is related to rising global temperatures, but that this does not tell the whole story.
In the earlier 22-year period of 1980-2001, the study finds that the spatial extent of heatwave-led CDHEs rises by 1.6% per 1C of global temperature rise. For the more-recent period of 2022-23, this increases “nearly eightfold” to 13.1%.
The change suggests that the rapid increase in the heatwave-led CDHEs occurred after the global average temperature “surpasse[d] a certain temperature threshold”, the paper says.
This threshold is an absolute global average temperature of 14.3C, the authors estimate (based on an 11-year average), which the world passed around the year 2000.
Investigating the recent surge in heatwave-leading CDHEs further, the researchers find a “regime shift” in land-atmosphere dynamics “toward a persistently intensified state after the late 1990s”.
In other words, the way that drier soils drive higher surface temperatures, and vice versa, is becoming stronger, resulting in more heatwave-led compound events.
Daily data
The research has some advantages over other previous studies, Yeh says. For instance, the new work uses daily estimations of CDHEs, compared to monthly data used in past research. This is “important for capturing the detailed occurrence” of these events, says Yeh.
He adds that another advantage of their study is that it distinguishes the sequence of droughts and heatwaves, which allows them to “better understand the differences” in the characteristics of CDHEs.
Dr Meryem Tanarhte is a climate scientist at the University Hassan II in Morocco, and Dr Ruth Cerezo Mota is a climatologist and a researcher at the National Autonomous University of Mexico. Both scientists, who were not involved in the study, agree that the daily estimations give a clearer picture of how CDHEs are changing.
Cerezo-Mota adds that another major contribution of the study is its global focus. She tells Carbon Brief that in some regions, such as Mexico and Africa, there is a lack of studies on CDHEs:
“Not because the events do not occur, but perhaps because [these regions] do not have all the data or the expertise to do so.”
However, she notes that the reanalysis data used by the study does have limitations with how it represents rainfall in some parts of the world.
Compound impacts
The study notes that if CDHEs continue to intensify – particularly events where heatwaves are the precursors – they could drive declining crop productivity, increased wildfire frequency and severe public health crises.
These impacts could be “much more rapid and severe as global warming continues”, Yeh tells Carbon Brief.
Tanarhte notes that these events can be forecasted up to 10 days ahead in many regions. Furthermore, she says, the strongest impacts can be prevented “through preparedness and adaptation”, including through “water management for agriculture, heatwave mitigation measures and wildfire mitigation”.
The study recommends reassessing current risk management strategies for these compound events. It also suggests incorporating the sequences of drought and heatwaves into compound event analysis frameworks “to enhance climate risk management”.
Cerezo-Mota says that it is clear that the world needs to be prepared for the increased occurrence of these events. She tells Carbon Brief:
“These [risk assessments and strategies] need to be carried out at the local level to understand the complexities of each region.”




The post Heatwaves driving recent ‘surge’ in compound drought and heat extremes appeared first on Carbon Brief.
Heatwaves driving recent ‘surge’ in compound drought and heat extremes
Greenhouse Gases
DeBriefed 6 March 2026: Iran energy crisis | China climate plan | Bristol’s ‘pioneering’ wind turbine
Welcome to Carbon Brief’s DeBriefed.
An essential guide to the week’s key developments relating to climate change.
This week
Energy crisis
ENERGY SPIKE: US-Israeli attacks on Iran and subsequent counterattacks across the Middle East have sent energy prices “soaring”, according to Reuters. The newswire reported that the region “accounts for just under a third of global oil production and almost a fifth of gas”. The Guardian noted that shipping traffic through the strait of Hormuz, which normally ferries 20% of the world’s oil, “all but ground to a halt”. The