
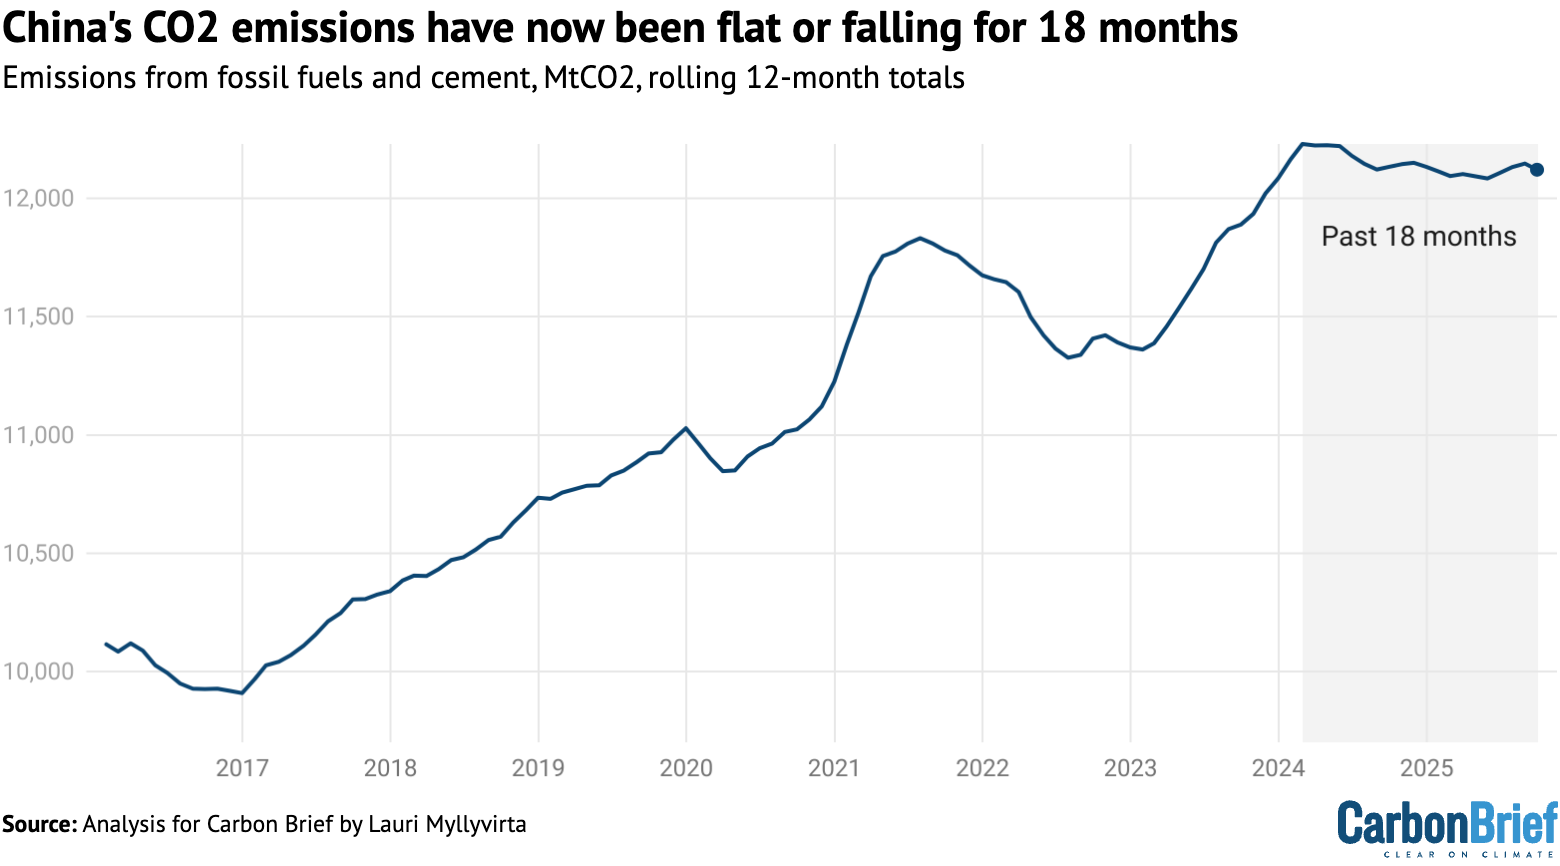
China’s carbon dioxide (CO2) emissions were unchanged from a year earlier in the third quarter of 2025, extending a flat or falling trend that started in March 2024.
The rapid adoption of electric vehicles (EVs) saw CO2 emissions from transport fuel drop by 5% year-on-year, while there were also declines from cement and steel production.
The new analysis for Carbon Brief shows that while emissions from the power sector were flat year-on-year, a big rise in the chemical industry’s CO2 output offset reductions elsewhere.
Other key findings include:
- Power-sector CO2 emissions were flat in the third quarter, even as electricity demand growth accelerated to 6.1%, from 3.7% in the first half of the year.
- This was achieved thanks to electricity generation from solar growing by 46% and wind by 11% year-on-year in the third quarter of 2025.
- In the first nine months of the year, China completed 240 gigawatts (GW) of solar and 61GW of wind capacity, putting it on track for a new renewable record in 2025.
- Oil demand and emissions in the transport sector fell by 5% in the third quarter, but grew elsewhere by 10%, as the production of plastics and other chemicals surged.
After the first three quarters of the year, China’s CO2 emissions in 2025 are now finely balanced between a small fall or rise, depending on what happens in the last quarter.
A drop in the full-year total became much more likely after September, which recorded an approximately 3% drop in emissions year-on-year.
Electricity demand – and associated emissions – have tended to grow fastest during the summer months, due to rapidly rising demand for air conditioning amid hotter summers.
If this pattern repeats, then China’s CO2 emissions will record a fall for the full year of 2025.
While an emission increase or decrease of 1% or less might not make a huge difference in an objective sense, it has heightened symbolic meaning, as China’s policymakers have left room for emissions to increase for several more years, leaving the timing of the peak open.
Either way, China is set to miss its target to cut carbon intensity – the CO2 emissions per unit of GDP – from 2020 to 2025, meaning steeper reductions are needed to hit the county’s 2030 goal.
Finely balanced emissions
China’s CO2 emissions have now been flat or falling for 18 months, starting in March 2024. This trend continued in the third quarter of 2025, when emissions were unchanged year-on-year.
This picture is finely balanced, however, with contrasting trends in different sectors of the economy underlying the ongoing plateau in CO2 emissions, shown in the figure below.
Emissions from the production of cement and other building materials fell by 7% in the third quarter of 2025, while emissions from the metals industry fell 1%. This is due to the ongoing real-estate contraction, as the construction sector uses most of the country’s steel and cement output.
Emission reductions from steel production continued to lag the reductions in output, which fell 3%. This is because the fall in demand was absorbed by the lower-carbon electric-arc steelmakers, whereas carbon-intensive coal-based steel production was less affected.
China has struggled to increase the share of electric-arc steelmaking despite targets, due to the large capacity base and entrenched position of coal-based steelmaking crowding out the lower-emission producers.
Power-sector emissions were unchanged year-on-year in the third quarter, as strong growth from solar and wind generation, along with small increases from nuclear and hydro, nearly matched a rapid rise in demand.
Emissions from transport fell by 5% over the period, but oil consumption in other sectors grew by 10%, driven by chemical industry expansion. This resulted in a 2% rise in oil consumption overall.
Gas demand and emissions grew by 3% overall in the three-month period, with consumption in the power sector up by 9% and by 2% in other sectors.
The figure below shows how emissions in each of these sectors has changed in the first nine months of 2025, for example, power-sector CO2 output is down 2% in the year so far.
The rapid recent growth of CO2 emissions in the chemical industry is a continuation of recent trends and, as such, the sector’s coal and oil use have both surged in 2025 to date.

The outlook for emissions in the final quarter of 2025 – and the year as a whole – depends on whether further declines in cement, transport and power are enough to offset increases elsewhere.
Solar and wind growth keep power sector emissions flat
In the power sector, China’s dominant source of CO2, emissions remained flat in the third quarter even as electricity demand grew strongly.
Electricity generation from solar and wind grew by 30%, with solar up 46% and wind power generation increasing 11%. With small increases from nuclear and hydropower, non-fossil power sources covered almost 90% of the increase in demand, even as demand growth accelerated to 6.1% in the third quarter, up from 3.7% in the first half of the year.
This is illustrated in the figure below, where the columns show the change in generation by each source of non-fossil power every quarter and the line shows the increase in electricity demand.

Despite a small increase in electricity generation from fossil fuels to cover the remaining 10% of demand growth, power sector emissions stayed unchanged in the third quarter of 2025.
This is because the average thermal efficiency of coal power – the amount of fuel per unit of output – improved slightly, while the share of gas-fired generation increased at the expense of coal.
The figure above shows that the growth in clean-power sources has been covering all or nearly all of the rise in electricity demand in recent quarters, but once again there is a fine balance.
As such, the outlook for the final quarter of 2025 and for power-sector emissions over the years ahead depends on the relative strength of rising demand and clean-power output.
From 2021 to 2025, there has been a marked seasonal pattern in electricity demand growth, with more rapid rises in the summer peak “cooling season”, from June to August.
In these months, residential electricity consumption grew by a striking 13% per year, compared with just 6% during other parts of the year. Industry and service-sector consumption also grew faster in the summer months.
As a result, growth in total power demand has been significantly faster, at 6.8% during the summer months, compared with 4.6% in the rest of the year.
This is due to both increased prevalence of air conditioning and to hotter summers, with the average number of “cooling-degree days” increasing by one third from 2015–16 to 2024–25, as shown in the figure below.

This seasonal pattern implies that electricity consumption might ease off in the final quarter of 2025, which would set a lower bar for clean-power growth to meet or exceed rising demand.
On the generation side, the first nine months of 2025 has seen China adding 240GW of solar and 61GW of wind power capacity. While the rate of new installations has slowed down sharply since May, China is still on track for a new record for the whole year as developers rush to complete projects included in the 14th five-year plan, which finishes at the end of 2025.
China had 181GW of wind and 234GW of utility-scale solar under construction in early 2025, according to the Global Energy Monitor. After the capacity additions in the first nine months of 2025, this leaves 120GW of wind and 123GW of utility-scale solar under construction, much of which is likely to be commissioned this year.
The rate of new wind and solar additions in 2025 to date is shown in the figure below, alongside comparable figures for each year since 2020.

The slowdown in installations in recent months is due to a new pricing system that requires developers of new solar and wind-power plants to secure contracts directly with buyers, instead of being guaranteed the benchmark price for coal power, which was the case until May.
The change in pricing led to a major rush to complete projects faster than originally scheduled, seen in the May 2025 bump in the figure above.
This left few projects to complete in the third quarter, meaning that the current slow pace in installations does not yet reflect the capacity growth that can be expected under the new system.
China’s power-sector emissions have been falling slowly since early 2024, due to the rapid growth of solar and wind power generation. The unprecedentedly large capacity additions have enabled non-fossil power generation to cover electricity demand growth, but only barely.
Any sustained slowdown in solar and wind deployment would mean that power-sector emissions would begin to creep up again, unless electricity demand slows sharply. This is not expected – the State Grid has forecast 5.6% annual demand growth until 2030, compared with 6.1% from 2019 to 2025.
One indicator pointing towards robust ongoing solar capacity growth is that the production of solar cells has continued at or above 2024 levels – even after the slowdown in installations in recent months – growing 8% year-on-year in the third quarter.
The amount of new solar-cell capacity produced in Chinese factories each month, minus exports, has tended to predict new domestic solar installations, with a lag.
However, the outlook for wind and solar growth in China is clouded by a large gap between industry and government expectations for the sector.
The China Wind Energy Association is targeting at least 120GW of wind-power capacity added per year in the next five years, while the China Photovoltaic Industry Association projects 235-270GW of solar added in 2026, rising to 280-340GW in 2030.
In contrast, president Xi Jinping recently announced that China would “strive to” bring the county’s installed solar and wind capacity to 3,600GW by 2035. This implies just 200GW of capacity added per year over the next decade, extending a target set earlier for 2025-27.
The pace of solar and wind deployment under the new pricing system depends heavily on the implementation of the national-level rules at the provincial level, particularly the choice of minimum pricing. Most provinces are yet to finalise their rules and only six provinces have published results from auctions for “contracts for difference” – the key policy instrument under the new rules – so far, with nine more auctions underway.
Meanwhile, the additions of new coal and gas-fired power capacity have accelerated, as the projects started after the government loosened permitting and started to promote coal-fired power projects in 2020 are starting to complete.
The result has been that the utilisation of coal-fired power capacity – the share of hours during which each unit is in operation – has begun to fall significantly, as power generation from coal has declined since April 2024. Utilisation peaked at 54% in the 12 months to February 2024 and fell to 51% in the 12 months to September 2025.
Another 230GW of coal-fired power capacity is under construction. If power generation from coal continues to stay stagnant and if all of this new capacity is added to the system, then utilisation would fall to 43%. This could prompt a rethink of the government’s promotion of coal-fired power projects.
Chemical industry’s runaway growth pushes up oil demand
In the oil sector, there are once again competing factors at work. China’s transport oil consumption has been falling since April 2024, driven in large part by the rapid adoption of EVs.
However, total oil consumption still increased 2% in the year to September, as a 4% fall in transport fuel use was more than offset by an 8% rise elsewhere, dominated by industrial demand.
Consumption fell by 4-5% across each of the three main transport fuels: diesel, used in trucks and other heavy vehicles; petrol, mainly used in cars; and jet fuel.
The reduction in petrol consumption accelerated in October, falling 8% year-on-year, erasing the usual spike seen at this time of year related to the week-long national holiday.
Within industry, the production of primary plastics grew 12% year-on-year in the first three quarters of 2025, while the production of chemical fibres grew by 11% and the production of ethylene by 7%. The increase in the output of these products accounts for the entire increase in oil use outside the transportation sector.
These sharp increases in chemical production are shown in the figure below.

One clear driver of the growth in plastics production is import substitution – replacing equivalent products imported from overseas – as well as growing exports.
China is still a net importer of primary plastics by value in 2025 so far, but only just. The value of imports fell by 8% while the value of exports increased by 8% in the first nine months of the year.
The five-year plan for 2021-25 targeted an increase in chemicals production to reduce the imports of key raw materials to less than 40% of demand, with projects launched to meet this target coming online this year.
More recently, the government has encouraged oil refineries to shift from the production of transport fuels to chemicals, in order to adapt to falling demand for oil in transportation. It set a target for the petrochemical and chemical sector’s economic output to grow by more than 5% per year in 2025-26.
The US-China tariff tit-for-tat has added further momentum to import substitution. The US has been China’s largest source of imports of polyethylene – the most widely used plastic in the world – since 2023, but China has expanded its domestic production in response to the trade spat.
Still, the change in China’s net exports of plastics cannot account for more than a fraction of the increase in output volume, however, as estimated based on reported polymer prices. This indicates that growing domestic demand is a major driver of the rapid growth in plastics production.
Packaging is the largest use of plastics in China, with the booming online retail and food delivery industry driving rapid growth.
Express parcel volumes grew 21% in 2024 and 17% through September 2025. The value of the single-use plastic tableware market averaged 21% annual growth from 2017 to 2022 and the revenue of the online food delivery industry is projected to grow 11% in 2025.
The government is taking measures to curb single-use plastics, but these would need to be intensified to fully counteract the growth rates seen in food deliveries and other drivers. The demand for high-performance materials in new manufacturing industries is also a significant driver.
Will China’s emissions peak early or rebound?
After the third quarter of 2025, it is clear that the plateau or slow decline of China’s CO2 emissions that started in early 2024 continues.
Whether emissions increased or decreased marginally in the first three quarters of the year is too close to call, given the uncertainties involved, but a drop in full-year emissions became much more likely after September, which recorded an approximately 3% drop in emissions year-on-year.
Still, either a small increase or decrease in the calendar year of 2025 remains possible and will be ultimately be decided by developments in the fourth quarter.
China’s emissions from fossil-fuel use are highly likely to increase this year, with the increase of coal and oil use in the chemical industry outweighing the reductions in emissions from the power, metals, building materials and transportation sectors. This will be balanced out by a fall in cement process emissions.
What is already clear is that the 2025 carbon-intensity target will be missed, as it would have required absolute emission reductions of 4% or more this year, after slow progress during the earlier years of the five-year period.
This also means that the carbon-intensity target in the next 15th five-year plan for 2026-2030 would need to be more ambitious than the one that China missed during the current period, to close the shortfall to the country’s 2030 intensity target.
China targeted an 18% reduction in 2021-25, but will only have achieved around 12% by the end of this year. It would then need a reduction of around 22-24% in the next five years to achieve its headline climate commitment for 2030, a 65% carbon-intensity reduction on 2005 levels.
Whether emissions fall this year – or not – has high symbolic significance. Having committed to peaking emissions “before 2030”, China’s policymakers have left their specific peaking year open.
China’s new greenhouse gas emission target for 2035, announced by Xi in September, was set as a reduction of 7-10% below an undefined “peak level”, making it clear that policymakers are still planning for – or at least leaving the door open to – a late peak, only just before 2030.
Setting this target from “peak levels” means that the timing and level of China’s emissions peak affects not only the path of its CO2 output in the next few years, but also the size of cuts needed to meet the 2035 goal – and presumably also subsequent targets thereafter.
The target of reducing emissions from “peak levels” could also create an incentive for provinces to increase emissions before the expected peak year, known as “storming the peak” in Chinese.
This incentive could be curbed by the creation of the “dual control” system for carbon intensity and total carbon emissions. The Central Committee of the Communist Party recently reiterated that this should happen during the next five-year period, but the specific timeline is an open question.
If the system is not operational from 2026, with annual carbon intensity and possibly absolute carbon emission targets allocated to provinces, then that could further allow for and incentivise emissions increases in the short term.
At the same time, China has made commitments to peak emissions before 2030, reduce coal consumption gradually during the 2026-30 period and to reduce carbon emissions per unit of GDP by more than 65% by 2030, from 2005 levels.
Meeting the last target – which China has made internationally as part of its 2030 Paris pledge – would require, in practice, that emissions in 2030 are limited at or below their 2024 level, given progress to date and expected GDP growth rates.
Realising these targets, in turn, would require clean-energy growth rates well above the minimum of 200GW of new wind and solar capacity per year, set by China’s 2035 pledge – unless the rate of energy-demand growth sees a sharp and unexpected slowdown.
Beating these minimum clean-energy growth rates would also be necessary if policymakers want to maintain the tailwind that these sectors have provided to China’s economy in recent years.
About the data
Data for the analysis was compiled from the National Bureau of Statistics of China, National Energy Administration of China, China Electricity Council and China Customs official data releases, from WIND Information, an industry data provider, and Sinopec, China’s largest oil refiner.
Wind and solar output, and thermal power breakdown by fuel, was calculated by multiplying power generating capacity at the end of each month by monthly utilisation, using data reported by China Electricity Council through Wind Financial Terminal.
Total generation from thermal power and generation from hydropower and nuclear power was taken from National Bureau of Statistics monthly releases.
Monthly utilisation data was not available for biomass, so the annual average of 52% for 2023 was applied. Power sector coal consumption was estimated based on power generation from coal and the average heat rate of coal-fired power plants during each month, to avoid the issue with official coal consumption numbers affecting recent data.
CO2 emissions estimates are based on National Bureau of Statistics default calorific values of fuels and emissions factors from China’s latest national greenhouse gas emissions inventory, for the year 2021. Cement CO2 emissions factor is based on annual estimates up to 2024.
For oil consumption, apparent consumption of transport fuels (diesel, petrol and jet fuel) is taken from Sinopec quarterly results, with monthly disaggregation based on production minus net exports. The consumption of these three fuels is labeled as oil product consumption in transportation, as it is the dominant sector for their use.
Apparent consumption of other oil products is calculated from refinery throughput, with the production of the transport fuels and the net exports of other oil products subtracted. Fossil-fuel consumption includes non-energy use, as most products are short-lived and incineration is the dominant disposal method.


The post Analysis: China’s CO2 emissions have now been flat or falling for 18 months appeared first on Carbon Brief.
Analysis: China’s CO2 emissions have now been flat or falling for 18 months
Mae Buenaventura is the manager of the debt justice programme of the Asian Peoples’ Movement on Debt and Development, a regional alliance of peoples’ movements, community organizations, coalitions, NGOs and networks
A potentially historic shift in public debt governance is set to unfold in Washington DC this week as Global South governments take a collective stand to stop a “silent killer” of development financing.
The first-ever UN-hosted borrowers’ forum will officially be launched on April 15 on the sidelines of the 2026 Spring Meetings of the International Monetary Fund (IMF) and the World Bank. Led by five convening countries – Zambia, Egypt, Nepal, the Maldives and Pakistan – the initiative is one of the key wins of last year’s 4th Financing for Development Conference (FFD4) in Sevilla, Spain.
The forum’s mandate is to establish a platform for borrower countries, supported by a UN secretariat, “to discuss technical issues, share information and experiences in addressing debt challenges, increase access to technical assistance and capacity-building in debt management, coordinate approaches and strengthen borrower countries’ voices in the global debt architecture”.
Instead of facing lenders alone, these countries will now use a UN-backed platform to share technical expertise and coordinate their approach to a global debt system that is fundamentally broken.
Debt grips climate-vulnerable nations
The human cost of the current debt architecture is staggering. According to the UN trade and development agency, UNCTAD, more than 40% of the global population – roughly 3.4 billion people – live in countries where the government is forced to spend more on debt payments than on the health, education and social protection of its citizens.
In so-called low-income countries, governments spend an average of 7.5% of their total budgets on debt service, with interest payments consuming up to 20% of total government revenue in these regions.
The Philippines is a case study in this financial stranglehold. It is part of a global majority forced to watch its public services crumble and infrastructure lag while its wealth is siphoned off to satisfy foreign lenders.
The policy of automatic appropriations – a legacy of the rule of late former President Ferdinand Marcos Sr. – mandates that debt servicing takes precedence over any other public expenditure, effectively placing the demands of lenders above the needs of the Filipino people. Even as it faces a $1.5 trillion regional financing gap to achieve the Sustainable Development Goals (SDGs) by 2030, its hands remain tied by a legal framework that values credit ratings over human lives.
-
GEF raises $3.9bn ahead of funding deadline, $1bn below previous budget
Amid aid cuts, donor governments pledge less nature and climate funding to the Global Environment Facility (GEF), with the four-year package to be finalised in late May -
Charging worries, high prices put brakes on EV growth in Bangladesh
Sales of e-bikes and rickshaws are up amid queues at fuel stations, but a lack of charging infrastructure and high prices still deter many Bangladeshis from going electric


As a “middle-income country” (MIC), the Philippines is stuck in a frustrating purgatory. It is often deemed “too wealthy” for the G20’s debt-relief framework, yet too poor to absorb global economic shocks. Last year, Finance Undersecretary Joven Balbosa hit the nail on the head when he called for support that goes “beyond the simplistic income categorization” that ignores a country’s actual vulnerabilities.
Without an inclusive and equitable global debt architecture, nations including the Philippines are left to navigate catastrophic climate risks and economic shocks with zero fiscal breathing space.
No respite during climate disasters
The regional evidence of this systemic failure is everywhere. Take Pakistan, which in 2022 was hit by catastrophic flooding that submerged a third of the country and caused billions in losses. Despite this climate-driven disaster, World Bank data shows that Pakistan made payments in 2023 of $11.8 billion for public and publicly guaranteed (PPG) external debt, while its PPG external debt reached $93 billion that same year, surpassing pre-pandemic debt of $87 billion (2020).
Sri Lanka followed IMF prescriptions throughout 16 lending programs since 1991, only to become the first Asian country this century to default. Its MIC status prevents application for debt relief and restructuring measures. Today, the Sri Lankan people bear the brunt of harsh conditionalities, including raising VAT from 8% to 15%, slashing food and fuel subsidies, and the erosion of hard-earned worker pensions.

Currently, the global rules of lending and borrowing are set by a “creditors’ club” composed of the IMF, the World Bank and the Global Sovereign Debt Roundtable it set up, and the Paris Club.
These institutions measure “debt sustainability” through a narrow lens of a country’s capacity to make timely repayments. They largely ignore internal economic inequalities, gender disparities and the existential threat of climate change.
Crises should trigger debt service cancellation
By organising the new borrowers’ forum, the Global South is signalling that the era of passive “standard-setting” by lenders is over.
The ultimate goal for global civil society and debt justice movements is the establishment of a UN Debt Convention; a democratic, binding and inclusive framework that governs both lenders and borrowers. This mechanism would ensure that debt restructuring and cancellation are sufficient to allow countries to fulfill their international human rights obligations and implement necessary climate actions.
Green Climate Fund picks locations for five developing country hubs
To be truly transformative, debt sustainability analyses must align with human rights and sustainable development needs. This means conducting impact assessments – both before and after loans are issued – to identify “illegitimate” debts that do not benefit the public.
Crucially, we need an automatic debt service cancellation mechanism that triggers during extreme climatic, environmental or health shocks. We also need a binding global debt registry to ensure that every loan is transparent and subject to public scrutiny.
Whether the borrowers’ forum becomes a true milestone depends on its courage to challenge the status quo. We can no longer allow debt to act as a “silent killer” of our future. It is time to demand a financial system that serves humanity, not just the balance sheets of the powerful.
The post Broken debt system must be fixed to confront future climate shocks appeared first on Climate Home News.
Broken debt system must be fixed to confront future climate shocks
Greenpeace and allies will be protesting outside Woodside’s Annual General Meeting to show the WA and federal governments strong community opposition to Woodside’s proposal to drill for gas at Scott Reef.
What: Protest outside Woodside Energy’s Annual General Meeting
When: 8am Thursday 23rd April 2026Where: Kagoshima Park (on the corner of Great Eastern Highway and Bolton Avenue)
What’s at stake
Scott Reef is a pristine ocean ecosystem off the north-west coast of Australia.
It is home to endangered and endemic species, including pygmy blue whales and the dusky sea snake, and a nesting ground for green sea turtles. Scott Reef is a place of extraordinary natural beauty, and a vital marine environment that supports a wide range of marine life.
What Woodside is proposing
Dirty fossil fuel corporation, Woodside Energy, is seeking approval to drill more than 50 gas wells underneath and around Scott Reef as part of its Browse project.
The gas would be extracted and transported to the Burrup Hub, the most polluting fossil fuel project in Australia. This proposal would industrialise the doorstep of Australia’s largest freestanding oceanic reef system – threatening the marine life that relies on it and the climate.
Why this can’t go ahead
The WA Environmental Protection Authority has already identified the risks of this project as “unacceptable”, issuing a preliminary rejection.
Serious concerns include:
- The risk of an oil spill
- Impacts on pygmy blue whales
- Damage to green sea turtle nesting grounds
These risks are severe, and potentially irreversible. But the decision hasn’t been made yet. The project is still being assessed.
The Federal Environment Minister is approaching a decision that will determine whether Scott Reef is protected – or vulnerable to decades of industrial gas destruction.
This is a defining moment.
Make opposition visible
Across Australia, people are speaking out to protect Scott Reef and oppose Woodside’s Browse project.
Showing that opposition is visible, coordinated and growing helps increase pressure on decision-makers ahead of this critical decision.
Join the protest
A protest outside Woodside’s AGM is a key public moment to demonstrate opposition and help protect Scott Reef.
Kagoshima Park (on the corner of Great Eastern Highway and Bolton Avenue) 8am, Thursday 23rd April 2026
Join the protest and help show how many people support protecting Scott Reef before the government makes its decision.
Join Greenpeace to save Scott Reef from Woodside’s dirty gas
As demand for whale meat declines at home, Norway exports it to Japan, markets it to tourists and sells it online as dog food.
Norway reopened its annual whale hunting season earlier this month, continuing a practice most countries abandoned decades ago.
Norway Reopens Annual Whale Hunt Despite Pressure to End Commercial Whaling


-
Climate Change8 months ago
Guest post: Why China is still building new coal – and when it might stop
-
Greenhouse Gases8 months ago
Guest post: Why China is still building new coal – and when it might stop
-

 Greenhouse Gases2 years ago
嘉宾来稿:满足中国增长的用电需求 光伏加储能“比新建煤电更实惠”
-
Climate Change2 years ago
Bill Discounting Climate Change in Florida’s Energy Policy Awaits DeSantis’ Approval
-

 Climate Change2 years ago
嘉宾来稿:满足中国增长的用电需求 光伏加储能“比新建煤电更实惠”
-
Climate Change Videos2 years ago
The toxic gas flares fuelling Nigeria’s climate change – BBC News
-

 Renewable Energy6 months ago
Sending Progressive Philanthropist George Soros to Prison?
-

 Carbon Footprint2 years ago
US SEC’s Climate Disclosure Rules Spur Renewed Interest in Carbon Credits