


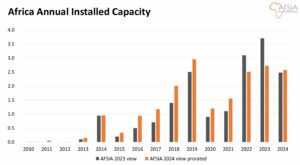
Africa is slowly stepping into the solar spotlight. According to the Africa Solar Industry Association (AFSIA) in 2024, the continent added 2.5 GW of new capacity, taking the total installed solar to 19.2 GWp. Yet, even with this growth, the divide between Africa and the rest of the world is still widening.
For decades, solar power has played a critical role across Africa—lighting rural homes, powering water pumps, running mini-grids, and keeping hospitals connected. Now, momentum is shifting from small-scale use to large-scale adoption. The question is no longer whether solar will expand, but how fast and how broadly it will spread.
China’s Solar Exports Drive Africa’s Growth
The clearest signal of Africa’s solar rise comes not from domestic capacity figures but from trade flows. According to new research, “The first evidence of a take-off in solar in Africa” by energy think tank Ember, in the 12 months ending June 2025, Africa imported 15,032 MW of solar panels from China—a 60% jump from the previous year.
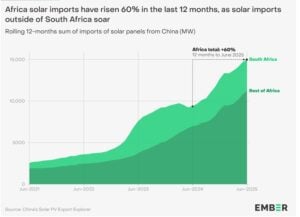
Notably, over the past two years, imports outside South Africa have nearly tripled, soaring from 3,734 MW in 2023 to 11,248 MW in 2025. This marks a structural shift: solar demand is no longer concentrated in a handful of markets but is spreading across the continent.
-
20 countries set new import records in the last year.
-
25 countries imported at least 100 MW, up from 15 the year before.
-
Countries such as Algeria, Zambia, Botswana, and Sudan experienced explosive growth, with imports increasing several times over.
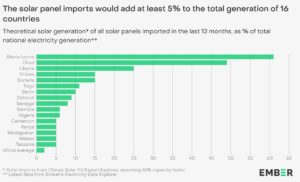
For countries with fragile electricity systems, the implications are enormous. In Sierra Leone, the panels imported in 2024 alone could supply 61% of the nation’s total 2023 electricity generation. In Chad, they could deliver nearly half of the annual demand.
Economics Now Favor Solar Over Diesel
The case for solar in Africa is no longer just environmental—it’s economic. Heavy reliance on diesel imports has left many countries vulnerable to price shocks and soaring fuel bills. Solar is fast becoming the cheaper, more resilient option.
In Nigeria, savings from avoiding diesel imports can pay off the cost of a solar panel in just six months. In several other countries, the payback is even quicker.
Despite the surge in solar imports, fossil fuels still dominate trade balances. In nine of the top ten solar panel importers, the value of imported refined petroleum outweighed solar panels by 30 to 107 times. This mismatch highlights the scale of opportunity: replacing even a fraction of fossil fuel imports with solar would transform energy security and economic resilience across Africa.
Installed Solar Capacity and The Concentration Challenge
While imports are spreading across the continent, installed capacity remains heavily concentrated. AFSIA says that of the 2.5 GW installed in 2024, a staggering 78% came from just two countries—South Africa and Egypt.
-
South Africa accounted for 50%.
-
Egypt added 29%, almost all from two mega-projects in Kom Ombo.
The dominance of these two nations reflects both their stronger policy frameworks and their ability to attract international finance. But it also underscores a challenge: outside of a few hotspots, large-scale solar development is still slow to take root.
Encouragingly, 2025 could change that narrative. A pipeline of landmark projects is now under construction in countries that have not traditionally led the solar charge. If delivered, these could shift the balance of Africa’s solar map in the coming years.
Utility-Scale Solar Makes a Comeback
After two years where commercial and industrial (C&I) projects led the way, utility-scale solar rebounded strongly in 2024, representing 72% of all new capacity.
This resurgence was powered by large, donor-backed projects, often financed by development finance institutions (DFIs) and built by international developers. National utilities, supported by governments, remain the primary off-takers.
Still, the C&I segment is far from disappearing. In South Africa, C&I accounted for 39% of new solar capacity, driven by both small embedded projects and larger wheeling initiatives that bypass strained grids.
By contrast, in Nigeria, weak transmission infrastructure makes utility-scale projects harder to sustain. Instead, C&I, residential rooftop systems, and mini-grids dominate the solar mix, with private companies and communities driving the transition from below.
Still China Remains Africa’s Solar Lifeline…
Africa’s solar boom would not be possible without China. In 2024, China produced 80% of the world’s solar panels and remains by far the largest exporter. Africa’s dependence on imports is heavy because local manufacturing capacity is still minimal.
-
Morocco has doubled its annual production to 1 GW.
-
South Africa maintains a similar capacity.
-
Egypt and Nigeria host small manufacturing lines, but volumes are limited.
Larger projects are in the works. Egypt will soon add significant capacity through EliTe Solar (3 GW in 2025), Sunrev Solar (2 GW in 2026), and a Masdar plant (4 GW, start date unannounced). These projects could eventually reduce Africa’s reliance on imports, but until then, Chinese exports remain the backbone of growth.
Solar’s Ripple Effects Across Economies
The Ember report further highlights that in 16 African countries, the solar panels imported in just one year could boost electricity generation by more than 5%. That is a game-changer for economies plagued by power shortages.
The shift also has profound fiscal consequences. Every dollar spent on solar reduces exposure to volatile global fuel prices, strengthens local currencies, and frees up budgets for critical investments in health, education, and infrastructure.
At a household and business level, distributed solar is breaking new ground. From small rooftop panels to mini-grids, decentralized systems are enabling energy access where traditional utilities have failed. For rural communities, that means lights in schools, refrigeration in clinics, and power for small businesses—building blocks for broader economic growth.
Is Africa’s Solar at a Crossroads?
The surge in imports shows that solar is no longer a niche or donor-driven sector in Africa. Instead, it is becoming a mainstream energy choice. The question now is whether governments can harness this momentum, ensure fair distribution, and scale up both infrastructure and financing to meet demand.
The risk is that growth remains uneven. If capacity stays concentrated in just a few countries, much of Africa could remain locked into fossil fuel dependence, missing out on the economic and social benefits of clean power.
But the opportunity is vast. With costs falling, technology advancing, and local manufacturing beginning to scale, Africa could leapfrog into a solar-powered future faster than many expect.
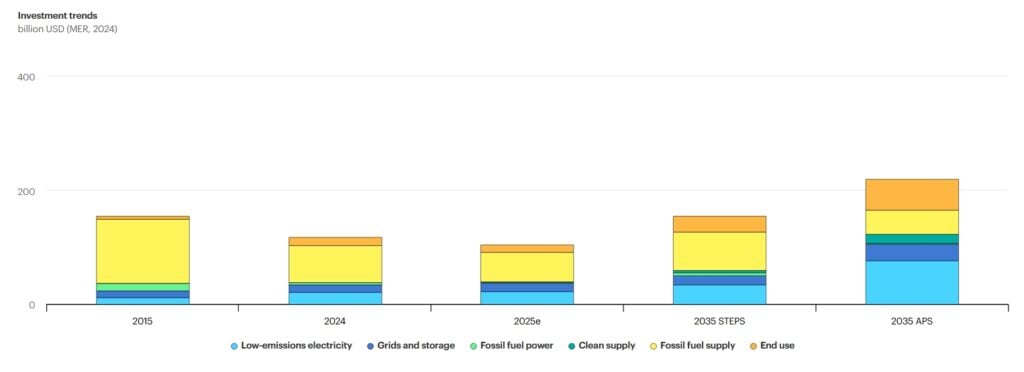
Yet, despite more than ~20 GW of installed capacity, the region still trails far behind the global curve. Concentration in South Africa and Egypt highlights both progress and fragility. To close the gap, policymakers must support broader adoption, attract investment beyond the usual markets, and accelerate local manufacturing.
If that happens, Africa’s energy future could change a lot. It might move from relying on expensive fossil fuels to a solar-driven system. This new system could provide power, stability, and growth all over the continent.
The post Africa’s Solar Imports from China Surge 60% in 2025, Pushing Clean Energy Goals appeared first on Carbon Credits.

EU carbon credit claims changed on 27 September 2026, the day the Directive (EU) 2024/825 began to apply across the European Union. The change is narrow. It changes how a company can talk about the credits it buys. A product can no longer be called neutral on the strength of compensation alone; however, every specific, evidenced statement about what a company measured, reduced, and funded stays fully available.

The post Promoting Improved Cooking Practices in Nigeria appeared first on Terrapass.



-
Climate Change1 year ago
Guest post: Why China is still building new coal – and when it might stop
-

 Greenhouse Gases2 years ago
嘉宾来稿:满足中国增长的用电需求 光伏加储能“比新建煤电更实惠”
-
Greenhouse Gases1 year ago
Guest post: Why China is still building new coal – and when it might stop
-

 Climate Change2 years ago
嘉宾来稿:满足中国增长的用电需求 光伏加储能“比新建煤电更实惠”
-

 Renewable Energy12 months ago
Sending Progressive Philanthropist George Soros to Prison?
-
Climate Change2 years ago
Bill Discounting Climate Change in Florida’s Energy Policy Awaits DeSantis’ Approval
-
Greenhouse Gases1 year ago
嘉宾来稿:探究火山喷发如何影响气候预测
-

 Climate Change2 years ago
Analysis: China’s CO2 falls 1% in Q2 2024 in first quarterly drop since Covid-19