


In 2025, China’s automotive maker BYD became the world’s largest seller of electric vehicles (EVs), overtaking U.S. EV pioneer Tesla for the first time. Data from multiple industry trackers shows that BYD sold about 2.26 million battery electric vehicles (BEVs) in 2025.
In contrast, Tesla delivered about 1.64 million EVs in the same year, marking a decline from its 2024 figures. This shift marks a major change in the global EV market.
From Challenger to Market Leader: BYD’s Breakthrough Year
BYD’s EV sales showed strong momentum throughout 2025. Its pure battery electric vehicle deliveries rose by roughly 28% year on year, reaching more than 2.25 million units worldwide. This steady growth allowed BYD to move ahead of Tesla in total annual BEV sales.
Tesla, by comparison, reported a decline of about 9-10% in overall vehicle deliveries versus the previous year. As a result, 2025 marked the first full calendar year in which BYD sold more battery electric vehicles than Tesla.

The gap became more visible in the second half of the year. Demand for EVs softened in some of Tesla’s key markets, particularly as higher interest rates and reduced incentives affected consumer spending. BYD, however, continued to benefit from strong demand in China and improving sales abroad.
By year’s end, the gap in total EV deliveries between the two companies grew to several hundred thousand units. This marked a clear shift in market leadership.
Quarterly data reinforced this trend. In the fourth quarter of 2025, Tesla delivered around 418,000 vehicles, representing a 15–16% drop from the same period in 2024. This decline reflected slower sales growth and increased competition.
BYD’s fourth-quarter BEV deliveries, in contrast, continued to rise. Its consistent quarterly growth helped push its full-year sales past Tesla’s and confirmed its position as the world’s largest EV seller by volume.
Why China’s EV Champion Is Scaling Faster
Several factors helped drive BYD’s expansion in global EV sales during 2025. A key driver was strong domestic demand in China, the world’s largest electric vehicle market.
Chinese automakers lead in local EV sales. This is thanks to consumer trust in domestic brands and a strong charging network in big cities. BYD benefited directly from this environment.
From January to November, industry estimates China’s NEV wholesale sales are about 13.78 million units. This shows a 29% increase compared to last year, and BYD captured a dominant 32% domestic share. This home-market strength fueled its global BEV leadership.

The product range also played an important role. BYD offers a wide lineup of EV models, including many lower-priced options that appeal to cost-conscious buyers. These vehicles attracted customers looking for practical electric cars rather than premium models. This broader appeal helped BYD reach a larger customer base than some competitors.
At the same time, BYD’s exports hit 1.05 million units in 2025, up 200% from the previous year. Europe and Latin America are key drivers of this growth. Globally, BYD claimed 12.1% of the BEV market in 2025, ahead of Tesla’s 8.8% and Volkswagen’s 5.2%, cementing the competitive shift.
Competitive pricing and improving vehicle quality helped BYD gain traction in these markets. Policy support also contributed, as incentives and trade policies in several regions made imported EVs more competitive.
Together, these factors allowed BYD to sustain sales growth even as demand softened for some rival brands.
Tesla Under Pressure in a Crowded EV Arena
Tesla’s sales declines in 2025 were linked to several challenges, including:
- Reduced demand after EV tax incentives ended in the United States, particularly the federal EV tax credit that expired in late 2025. This had encouraged buyers to purchase earlier in the year.
- Stronger competition from Chinese brands, not only BYD but also other manufacturers, is entering global markets.
- Market saturation in some regions, where potential customers postponed purchases or chose alternatives.
Tesla remains a major EV maker, but it saw its first consecutive annual drop in deliveries. By contrast, BYD increased its volume while expanding into new regions.
The EV Market Is Still Growing—But Leadership Is Shifting
The global EV market continues to grow, with total EV sales rising annually as more countries push toward cleaner transport. Analysts see strong demand for electric cars continuing this decade. Climate goals and stricter emissions rules in many areas support this trend.
Industry forecasts say global EV deliveries might keep growing until 2030. This growth is due to lower battery costs and more models from various automakers.
Industry forecasts project global EV sales reaching 40–50% of total car sales by 2030, up from ~20 million units in 2025. Battery pack prices have fallen to $115/kWh in 2024. They could further drop to $80–$99/kWh by 2026 (50% decline), enabling price parity with gas cars.
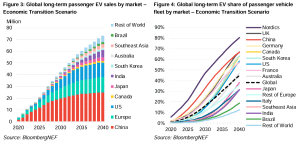
Nations in Europe and Asia are pushing zero‑emission vehicle targets as part of their climate commitments, which may further expand EV adoption.
Europe targets 90% CO2 cut by 2035 for new cars (easing from 100%, allowing some e-fuels/PHEVs). China aims for ~60–90% EV/NEV sales by 2030.
Still, challenges remain. EV buyer incentives vary by country and can affect sales patterns, as seen in the U.S. when federal credits expired. Some regions face infrastructure gaps, like limited charging networks, which can slow growth. Continued cost reductions and broader infrastructure rollouts will be key to sustaining EV adoption long term.
Emissions, Energy, and the Bigger Climate Picture
Electric vehicles are central to efforts to reduce greenhouse gas emissions from transport by 70–90% over their lifecycle compared to gasoline cars. This holds even with current grids.
- For EVs, emissions range from 200–500 gCO2/km, while ICEVs emit 200–300 gCO2/km.
Global transport represents 24% of CO2 emissions (8 GtCO2e). EVs could slash this by 40% by 2030 at 40% adoption. Clean grids, renewables >60% by 2030, boost EV advantage to near-total decarbonization.

Also, EVs produce zero tailpipe emissions and can lower overall carbon output when charged with renewable electricity. As more power grids shift toward clean energy sources, the lifetime emissions advantage of EVs grows.
BYD’s sales surge contributes to this global transition. As one of the largest EV producers, its growth means more EVs are on the road worldwide. This supports international efforts to cut emissions from passenger cars, which remain a major source of global greenhouse gases.
However, the environmental impact of EV manufacturing, especially battery production, remains a focus of industry and policy discussions. Sustainable practices in sourcing materials and recycling batteries will be crucial to maximizing the environmental benefits of EV growth.
A New Global Auto Order Takes Shape
BYD’s rise to the top reflects broader changes in the global auto sector:
- Chinese carmakers are gaining ground internationally, not just in their home market.
- Competition in EV segments is increasing, pushing companies to innovate faster on cost, range, and technology.
- Tesla’s leadership is challenged, even as it pushes into areas like autonomous driving and energy products.
The shift also highlights how consumer preferences are evolving, with buyers showing strong interest in different EV brands and models beyond traditional market leaders. As EV technology matures, more brands are expected to capture market share and expand globally.
The post BYD Overtakes Tesla as World’s Biggest EV Seller in 2025 appeared first on Carbon Credits.

EU carbon credit claims changed on 27 September 2026, the day the Directive (EU) 2024/825 began to apply across the European Union. The change is narrow. It changes how a company can talk about the credits it buys. A product can no longer be called neutral on the strength of compensation alone; however, every specific, evidenced statement about what a company measured, reduced, and funded stays fully available.

The post Promoting Improved Cooking Practices in Nigeria appeared first on Terrapass.



-
Climate Change1 year ago
Guest post: Why China is still building new coal – and when it might stop
-

 Greenhouse Gases2 years ago
嘉宾来稿:满足中国增长的用电需求 光伏加储能“比新建煤电更实惠”
-
Greenhouse Gases1 year ago
Guest post: Why China is still building new coal – and when it might stop
-

 Climate Change2 years ago
嘉宾来稿:满足中国增长的用电需求 光伏加储能“比新建煤电更实惠”
-

 Renewable Energy12 months ago
Sending Progressive Philanthropist George Soros to Prison?
-
Climate Change2 years ago
Bill Discounting Climate Change in Florida’s Energy Policy Awaits DeSantis’ Approval
-
Greenhouse Gases1 year ago
嘉宾来稿:探究火山喷发如何影响气候预测
-

 Climate Change2 years ago
Analysis: China’s CO2 falls 1% in Q2 2024 in first quarterly drop since Covid-19