

I composed this essay over much of 2026, as I was writing Beyond Vogtle — my detailed study (co-authored with James Boucher) of U.S. nuclear costs from the 1980s post-Three Mile Island reactors to the Vogtle 3 and 4 units completed earlier in this decade. It traces my journey from nuclear power doubter to proponent.
My story is both general and personal: what was changing in the wide world of nuclear power, energy policy and climate; and how I viewed those changes. I hope this mode of story-telling resonates with a wide audience and also provide a backdrop to “Beyond Vogtle.”
It’s in three parts.
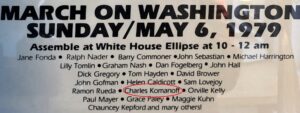
Detail from 1979 rally poster. Full poster appears below.
The first installment begins at the big Washington rally called to mark the Three Mile Island reactor accident, and covers the recession of nuclear dread, the advent of virtually always-on reactor operation, and nuclear’s status as the least carbon-emitting energy supply technology.
Installment #2 begins with the failure (to date) of carbon tax advocacy — “A Climate Cure No One Wanted” — and continues with the closure of Indian Point and the concurrent slow dissolve of my dream that renewable energy could do it all.
The third and final installment begins with a slight detour in which I contrast the appalling human damage from automobility with nuclear power’s increasingly remote dangers, and then return to energy policy with a fresh way to regard nuclear power’s potential contribution to decarbonizing U.S. grids.
Thank for reading. Enjoy. And be sure to look at Beyond Vogtle: What History Tells Us About the Cost of New Nuclear (yes, that’s the full title).
— C.K.
* * * * * * * * *
I’m pro-nuclear power. Big time.
I don’t just want the U.S. to keep running its 95 extant reactors. I want us to build more. Lots more. Hundreds.
I’m not alone. Public opinion is shifting toward nuclear power. But I came to that conclusion after spending years arguing the other side. From the mid-1970s to the late 1980s, I published a raft of critical analyses that got a good deal of public attention ― and even some traction within the nuclear industry itself. My core argument was that the cost of building nuclear plants was rising much faster than the costs of competing sources of energy. The main driver, I said, was a cascade of safety-requirement changes triggered by widespread fears of reactor accidents.
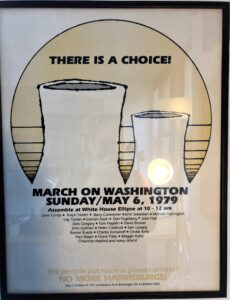
Here’s the full poster.
That work earned me a speaking spot at the massive May 6, 1979 rally in Washington demanding a halt to reactor construction in the wake of the March 28 meltdown at Three Mile Island in Pennsylvania. In the weeks before the rally, my research was cited in hundreds of news stories. At the Capitol, I stood alongside consumer advocate Ralph Nader, the leading figure in the U.S. antinuke movement; actress Jane Fonda, whose new film, “The China Syndrome,” had eerily foretold the Three Mile Island meltdown; and folk-rock icon Jackson Browne. I told the cheering throng that nuclear power was finished.
Cost overruns and canceled reactor projects were putting billions of dollars on the line, and I spent much of the next decade in courtrooms all over the country, explaining patiently to utility regulators why investors, not customers, should bear those losses. I eventually moved on to other public policy work, sparking big-city bicycling and helping bring congestion pricing to New York. But I kept watching nuclear power and the broader energy landscape. Over time, what I saw led me to turn from skeptic to supporter. Here’s why, in eight parts.
1. Fear and Dread Recede
Ask 100 random people today what “TMI” means, and at least 90 will say “Too Much Information.” Maybe one will mention the 1979 accident at Three Mile Island.
That’s a real shift.
The 1970s were commercial nuclear power’s first decade, and the Three Mile Island accident brought it to a terrifying close. Sixty hours into the slow-unfolding crisis, as fears grew that a “hydrogen bubble” in the reactor might explode and rupture the containment dome, CBS Evening News anchor Walter Cronkite captured the nation’s dread: “The world has never known a day quite like today. It faced the considerable uncertainties and dangers of the worst nuclear power plant accident of the atomic age. And the horror tonight is that it could get much worse.”[1]
The stricken reactor was eventually stabilized. But a combination of soaring costs and public apprehension brought an end to nuclear power’s rapid expansion in the United States.
Cronkite’s warning was about Three Mile Island itself, but it seemed to foreshadow more disasters to come. Yet since 1979, the U.S. nuclear industry has accumulated nearly 20 times as much reactor operating experience as it had built up in its entire history before the meltdown, without a sequel.[2] Like the dog that didn’t bark, this quiet fadeout of reactor calamities is an overlooked shift ― and it is prompting a rethink of long-held certitudes about nuclear power.
With each passing year there are fewer people who grew up with dread from Cold War-era A-bomb drills and weapons test fallout that got bundled into nuclear power. There are more young people like Zeke, a Brooklyn high-schooler who in 2019 went to Battery Park City to greet climate activist Greta Thunberg after her sail-powered trans-Atlantic voyage, but who this past May called fears about nuclear power “over-exaggerated.”[3] (Thunberg herself has said that Germany made a mistake by phasing out its nuclear plants, since it led to a sharp rise in coal-fired electricity.)
I’ve heard the same sentiment in hundreds of casual conversations over the past decade ― at climate rallies and on Trader Joe’s checkout lines, in California and in New York. These conversations suggest that the oppositional currents that once compelled federal nuclear regulators to keep piling on costly new safety requirements are losing force.
2. Permanent Peak Performance
Even before construction costs began to soar in the 1970s, nuclear power had another Achilles heel: spotty operating performance.
Throughout the 1970s and 1980s, the U.S. nuclear power sector struggled to maintain even a 60 percent “capacity factor” ― a measure of how much of a plant’s potential output it generates. That’s a dismal rate for equipment that’s expensive to build. I know this because I researched and wrote the first full-length study of shortfalls in U.S. nuclear plant performance, in 1976.[4]
That started to change in the mid-1980s. Plants finished safety upgrades required after Three Mile Island. The industry began sharing best practices ― and mistakes to avoid. Economic incentives helped too, as utility earnings became tied to how often plants actually ran.
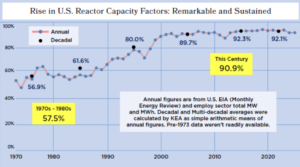
A remarkable turnaround, though seldom credited in climate and nuclear discourse.
The turnaround has been dramatic. Since 2000, U.S. nuclear plants have averaged 90 percent capacity factor ― a huge leap from the earlier 60 percent. In effect, downtime has dropped four-fold, from 40 percent of the time to just 10 percent. Repair jobs and retrofits that used to drag on are now precision-scheduled like the train heist in “Breaking Bad.”
The higher reliability brings a huge symbolic benefit. In the 1970s, U.S. reactors seemed to stumble from one fiasco to the next. In Alabama, a technician using a lit candle to locate an air leak started a fire that burned through a thousand cables and knocked two brand-new reactors offline for 19 months. At some ocean-cooled plants, saltwater corroded delicate heat-transfer tubes, forcing protracted repairs. Profits and industry morale took a beating, and nuclear power became a punchline on “The Simpsons.”
Those days are long past. Nuclear power, uniquely, has blossomed into both grid bulwark and climate hero. Thanks to those higher ― much higher! ― capacity factors, each nuclear plant now displaces 50 percent more carbon-emitting power generation than it used to.[5] In fact, at a 90 percent capacity factor, a kilowatt of nuclear power delivers double or triple the climate benefit of a kilowatt of wind power (which averages 30 to 40 percent capacity factor) and roughly five times that of solar (15 to 20 percent) ― a crucial distinction that’s often missing from gushing coverage of renewable energy.
3. Climate to the Fore
Nuclear power’s newfound operational mastery would matter much less but for the urgency of the climate crisis and the persistence of U.S. and global carbon emissions. Like wind and solar, nuclear power generates electricity without burning carbon.
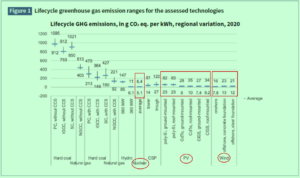
Squint to see that nuclear lifecycle greenhouse gas emissions range from 5.1 to 6.4 (in g CO2 equivalent per kWh); analogous range for solar-PV is 7.4 – 83.0; wind, 7.8 – 23.0. Source, Dinon et al., in report linked in this section’s second paragraph.
It is true that fossil fuels are implicated in nuclear power’s supply chain. Uranium mining uses petroleum, and enriching nuclear fuel requires electricity. But even counting upstream carbon, nuclear power’s climate footprint is smaller than that of wind, solar or hydropower, according to an authoritative 2022 analysis by a multinational team for the UN Economic Commission for Europe. (Their finding matched that of the similarly comprehensive 2018 report by the UN-chartered Intergovernmental Panel on Climate Change.[6])
That’s another big change. In nuclear power’s early years, uranium fuel enrichment was so energy-intensive that the three U.S. “gaseous diffusion” plants were said to consume 10 percent of all electricity used by American factories. But diffusion enrichment has given way to gas centrifuges and, more recently, laser isotopic separation ― methods that use 20 times less energy to isolate fissile U-235 from U-238.
The bottom line: kilowatt-hour for kilowatt-hour, nuclear-generated electricity is at least as effective as solar and wind at cutting climate pollution. Meanwhile, Hurricane Katrina, Superstorm Sandy, “heat domes” and wildfires, and, in August, the first Himalayan glacial collapse, have made once-hypothetical climate death and disruption a daily reality. More than rising electricity demand from A.I., it’s the climate crisis that’s driving renewed interest in nuclear power.
Click here for the second installment, Why I’m Pro-Nuke Now: Beginning.
[1] Quoted passage is from a local (PA) news site, though the an archived Channel 2 broadcast it cited is no longer on line.
[2] The sole “near-miss,” and a major one, was the 2002 discovery by operators at the Davis-Besse nuclear plant near Toledo, OH of extensive corrosion of the reactor vessel head — a vital barrier against loss of coolant and release of radiation. The U.S. General Accounting Office sternly rebuked the Nuclear Regulatory Commission for failing to identify and prevent the corrosion. See GAO, Nuclear Regulation: NRC Needs to More Aggressively and Comprehensively Resolve Issues Related to the Davis-Besse Nuclear Power Plant’s Shutdown, GAO-04-415, May 2004.
[3] In-person conversation at People’s Policy Conference at the New School for Social Research in New York, May 2, 2026.
[4] C. Komanoff, Power Plant Performance: Nuclear and Coal Capacity Factors and Economics (15 MB pdf), Council on Economic Priorities, 1976.
[5] Dividing today’s 90% uptime by the former 60% yields 1.50, indicating 50 percent more kilowatt-hours per kW.
[6] IPCC Annex III report, Technology-Specific Cost and Performance Parameters, 2018. See table on p. 1333.

Insetting program design starts with your supplier map. The carbon claim comes much later.
Consider a coffee procurement team that funds a farm intervention before checking its sourcing data. The supplier aggregates coffee lots from several regions. The buyer lacks farm-level traceability. Another purchaser expects to report the same outcome. A more attractive project brochure solves none of these problems.
If the distinction between a value-chain intervention and a purchased credit is still open, read CCC’s Insetting vs Offsetting guide before you set the brief.
Insetting program design begins with the purchasing relationship and works outward. You need to decide 1) where an intervention belongs, 2) what business problem it addresses, 3) who pays for it, 4) how results will be measured, and 5) what the evidence will let you say about them. This five-step playbook turns that sequence into a procurement plan.
Step 1: Insetting program design starts with supplier mapping
Start with the commodities that matter most to your Scope 3 inventory and sourcing continuity. Ask finance for spend by supplier, sustainability for the emissions baseline, and category managers for origin and volume records. Then identify which suppliers can trace material to a jurisdiction, sourcing region, producer group, or individual land-management unit.
The level of traceability affects what you can account for. Under the GHG Protocol Land Sector and Removals Standard, the spatial boundary for purchased land-based products depends on the traceability associated with each volume. Farm-specific factors or removals require physical traceability through an acceptable chain-of-custody model. A contract with a tier-one trader, by itself, does not establish a link to the farms behind its deliveries.[1]
Build a first-pass table with five columns: commodity and annual volume; supplier and origin; current traceability level; land-use and production risks; and the business owner who can change the purchasing terms. Mark missing data plainly. A blank cell is cheaper to fix before a program starts than after a claim is drafted.
If your company sets an SBTi Forest, Land and Agriculture target (FLAG), keep its land-related target boundary separate from energy and industry emissions. The current FLAG guidance also requires relevant companies to assess primary deforestation-linked commodities in their value chains.[2]
Step 2: Choose a commodity and jurisdiction for a pilot
Select one supply corridor where the sourcing connection can be established and procurement has a reason to stay. A useful pilot has repeat purchases, suppliers willing to share records, an intervention matched to a diagnosed problem, and a defined plan to measure the result. Carbon potential alone is a poor selection rule if the supplier cannot deliver the crop your business needs.
Compare candidate regions on land-use risk, supplier concentration, local rights and tenure, the availability of baseline data, and exposure to drought, erosion, or forest conversion. Check the relevant legal requirements separately. A nature project does not satisfy a due-diligence obligation merely because it has a carbon method attached.
Consider a coffee buyer sourcing from two districts. In the first, producer-group records identify the farms, while recent dry seasons have increased rejected green coffee lots. In the second, deliveries pass through several intermediaries and farm origins are unknown. Pilot shade management in the first district, with local agronomic advice and quality checks built into the plan. The buyer can trace purchases there and test the intervention against a defined sourcing problem.
Use a short decision memo to record why the selected corridor beats the alternatives, what remains uncertain, and what would stop the pilot. That memo is the first control against a project drifting toward whatever happens to photograph well.
Step 3: Design the supplier engagement and commercial model
The intervention needs an owner on each side of the contract. Decide who supplies planting material or training, who maintains the practice, who bears the cost if a harvest disappoints, and how long the buyer expects to purchase from participating suppliers. Where smallholders participate, budget cash flow and technical support for practices that offer a later return.
Put these terms in a supplier agreement or pilot addendum. It should cover eligible farms and volumes, consent to data collection, access for monitoring, any land or carbon rights that matter, benefit sharing, and what happens if the purchasing relationship ends. Ask local counsel and producer representatives to review the arrangement. The Accountability Framework is a useful reference for supply-chain work involving forests, ecosystems, and human rights.[3]
Avoid assigning an automatic carbon benefit to the buyer. The contract should say which party has the right to report each outcome, how overlapping claims will be checked, and how any issued credits will be handled. A reduction reported in a buyer’s inventory cannot simply be sold for someone else’s offset claim without an accounting review. SBTi FLAG guidance excludes purchased credits used as offsets from near-term FLAG target achievement.[2]
Set commercial measures beside environmental ones: delivered volume, rejection rate, supplier retention, and procurement cost. They tell you whether the program works as a supply-chain investment, even if carbon accounting takes longer to resolve.
Step 4: Build monitoring, reporting, and verification before rollout
Agree on the baseline and data flow before paying for a full rollout. Identify the land units or sourcing regions in scope, the practices that change, the records suppliers already keep, and the additional measurements the program requires. Decide which data can come from field visits, transaction records, or remote sensing, and who checks each source.
For carbon, separate three questions. Did the practice happen? Did emissions or removals change under an applicable method? Can the buyer attribute a defensible share to its purchased goods without double counting? The GHG Protocol’s 2026 guidance includes dedicated chapters on spatial boundaries, data and methods, evaluating actions, credited outcomes, and assurance.[1] These are distinct jobs. A photograph of a planted tree answers only part of the first.
CCC’s MRV and Additionality article explains the separate evidence questions a project reviewer will ask.
Create an evidence file for every reporting period: dated supplier and farm records, purchase volumes, methods and emission factors, uncertainty, quality checks, and changes from the baseline. Specify who can challenge the data and how corrections are recorded. If a project also seeks credit certification, keep project accounting and corporate inventory accounting separate. The GHG Protocol says its land standard focuses on entity-level inventories and does not set the rules for credit certification.[4]
Start with the minimum viable measurement design that can survive review. Add complexity when the pilot tells you which data actually changes a decision.
Step 5: Decide what can be reported and claimed
Insetting program design needs reporting rules before the marketing copy. Procurement, sustainability, finance, and legal should agree on four distinct outputs: operational performance; observed land or nature outcomes; inventory effects, if the accounting criteria are met; and any separately issued credits. One dashboard can display them, but they should not share a single unqualified headline.
SBTi FLAG guidance allows certain land-based removals within a company’s operations or supply chain to contribute to FLAG pathways, subject to criteria including permanence, traceability, data quality, and allocation. It does not allow purchased offsets to meet near-term FLAG targets.[2] Eligibility therefore depends on evidence and the applicable target rules, not on calling an activity “insetting.”
Draft a claims register. For each proposed sentence, record the period, boundary, data owner, calculation method, reviewer, and whether the result is measured, estimated, or still a goal. If the evidence supports only “we funded a pilot with 200 farms,” say that. Do not turn a funding fact into a verified emissions reduction.
What good looks like by year three
Treat year three as a review point, not a promised payback date. A mature pilot should have mapped participating supply volumes, a stable supplier agreement, a repeatable data collection process, and a comparison of commercial and environmental results against the baseline. It should also have a documented answer for outcomes that cannot be included in the buyer’s inventory.
Scale only where the pilot improves a sourcing decision and the evidence can follow the product. If neither condition holds, redesign the intervention or change the corridor. A disciplined program can conclude that a site is unsuitable. That is useful procurement intelligence.
Discuss your insetting program with CCC
Carbon Credit Capital designs nature-based supply chain investments around sourcing needs and measurable sustainability outcomes. Schedule a consultation with our carbon and sustainability experts to map your tier-one supplier network, FLAG exposure, and first pilot decision.
Sources
[1] GHG Protocol, Land Sector and Removals Standard, version 1.1, and companion Guidance, June 2026: https://ghgprotocol.org/land-sector-and-removals-standard ; https://ghgprotocol.org/land-sector-and-removals-guidance
[2] Science Based Targets initiative, Forest, Land and Agriculture Science-Based Target-Setting Guidance, version 1.2, March 2026, especially pp. 16–17, 37, and 41: https://sciencebasedtargets.org/resources/files/SBTiFLAGGuidance.pdf
[3] Accountability Framework initiative, Accountability Framework and guidance for companies: https://accountability-framework.org/
[4] GHG Protocol, Frequently Asked Questions: Land Sector and Removals Standard, questions 10 and 18: https://ghgprotocol.org/blog/frequently-asked-questions-land-sector-and-removals-lsr-standard
Nature-based carbon investments deserve consideration when they address a specific business dependency and produce outcomes you can measure. Imagine Moonbucks, a global coffee roaster planning next season’s espresso blend. It is considering natural Grade 4 coffee from Jimma, in southwestern Oromia, Ethiopia. Its sourcing decisions affect the roasting schedule and the cash tied up in coffee purchases. Moonbucks needs to understand which measures could protect that supply, what they would cost and how it would judge the results.
1. Define the sourcing problem before choosing a project
Moonbucks needs a dependable component for its espresso blend. Its procurement team wants continuity of volume and an agreed cup profile. Replacing a shipment at short notice could require new sample approval and changes to the blend, and given the schedules for cultivation, processing, and freight delivery, is practically impossible. Moonbucks needs to get this right, and its initial concern is inconsistent deliveries. It commissions an assessment of the supplying farms and post-harvest chain. The questions cover land condition, harvest availability and whether drying or storage problems are affecting saleable lots.
This distinction changes the investment brief. A tree-planting proposal cannot be assumed to fix drying problems. Better storage cannot restore eroded land. The team must establish which problem exists before selecting the response.
CCC’s guide to finding nature-based solutions in your supply chain explains where to look. Here, the next task is to turn a broad concern into a testable proposal.
2. Develop nature-based carbon investments around the actual supply chain
The assessment would trace Moonbucks’ purchases back through the exporter and supplying producer groups. Which farms supply the contracted lots? Who controls land-management decisions? How long does the buyer expect to maintain the purchasing relationship?
Furthermore, Jimma natural Grade 4 cannot be treated as interchangeable with every Ethiopian coffee. Moonbucks would need to test any substitute against its own blend and quality requirements.
Suppose Moonbucks’ assessment identifies an opportunity to maintain shade trees and restore vegetation along exposed streambanks. The IPCC describes agroforestry as a way to store carbon in vegetation and soil, with potential benefits for erosion control and water quality.1 Moonbucks would need local advice on species, growing conditions and maintenance before deciding how these measures fit its sourcing plan.
The proposal now has a defined sourcing connection and a candidate intervention. The next steps are to test its effect on production, assess carbon eligibility and build the financial case.
3. Compare the proposal with other ways to protect supply
WBCSD’s Nature-based Solutions Blueprint recommends comparing nature-based options with other responses across their benefits and costs.2 For Moonbucks, that means evaluating the landscape proposal alongside drying improvements, storage controls and alternative sourcing arrangements.
The product’s natural-process designation matters. Moonbucks should examine the drying and dry-milling chain alongside land conditions. Its team would check storage practices, contamination risks and incoming-lot quality to see whether problems arise before or after the coffee leaves the farms.
The revised proposal might combine land stewardship with separate post-harvest controls. Each component needs its own purpose and budget. A sustainability label should not obscure which activity is expected to solve which problem.
The project develops as the evidence improves. Its scope should follow the diagnosis rather than preserve the first idea unchanged.
4. Establish what the carbon outcome could count toward
Moonbucks’ sustainability team now tests the proposed carbon case separately from the sourcing case. Is the objective a measurable change in Moonbucks’ value-chain emissions, verified credits for separate voluntary use, or distinct outcomes under carefully defined arrangements?
Scope 3 covers value-chain emissions. A purchasing relationship alone does not prove that a farm intervention can be included in Moonbucks’ inventory. The team needs an applicable accounting method, defensible boundaries and evidence supporting attribution.
SBTi’s FLAG Guidance (forest, land and agriculture), version 1.2, says purchased credits used as offsets cannot meet near-term FLAG or energy and industry targets. Eligible land-based removals are subject to accounting requirements.3 Moonbucks needs to test its proposal against those rules before including an outcome in its targets.
For Moonbucks’ Jimma proposal, maintaining existing trees and establishing new vegetation could involve different carbon questions. Specialists must examine the baseline and additionality, meaning what changes because the project proceeds. They must also assess measurement and the risk that stored carbon is lost. CCC’s MRV and additionality article introduces those tests.
Until that work is complete, Moonbucks should not budget an assumed Scope 3 reduction or credit-sale receipt. Direct emissions reductions remain the priority.
5. Build a financial case that survives weaker assumptions
Moonbucks’ finance team would now build a multi-year budget. UNEP’s State of Finance for Nature 2023 compares current finance with the investment needed to meet climate, biodiversity and land-restoration goals.4 The company would cost its proposed activities, farmer participation and ongoing monitoring. Verification, where required, is a separate expense. Maintenance and responsibility for replacing failed plantings must remain visible after the initial establishment budget ends.
Operational benefits need equally careful treatment. If fewer rejected lots reduce emergency purchasing, count that saving once. Do not add “supply resilience” as another financial benefit when it represents the same avoided cost.
Moonbucks should compare a base case with slower benefits, higher implementation costs and no carbon revenue. It should also distinguish production outcomes from quality and shipment outcomes. A single good harvest would not prove that the landscape intervention caused better delivery performance.
A project can remain worth funding even when its carbon case needs more work. That decision must rest on the operational evidence and the company’s objectives, without unsupported environmental claims.
6. Fund a pilot with a clear expansion decision
Moonbucks’ first approval would fund a bounded pilot, rather than commit the entire sourcing program. Before spending, Moonbucks would agree on participating farms, responsibilities and the evidence needed at review.
Its scorecard could track farmer participation, implementation costs and plant survival, alongside accepted coffee volumes and lot-quality results. Carbon measurements would follow the selected method. Farm-level traceability must connect the intervention to the actual sourcing relationship.
Suppose Moonbucks’ review later finds that storage changes explain most quality improvements, while the land measures need longer observation. Those findings would shape the next decision: expand the proven component, adjust the landscape work or pause further spending. They would not justify crediting all improvements to tree planting.
This gives nature-based carbon investments a practical place in a multi-year strategy. Funding increases as the evidence supports it, and the project can change direction before a larger commitment.
Discuss a sourcing opportunity with CCC
Carbon Credit Capital’s nature-based supply-chain investment service uses its Dual-Value Model to examine supply-chain economics alongside potential sustainability outcomes.
Schedule a consultation to discuss your sourcing exposure and the questions to resolve before allocating capital.
Sources
- Intergovernmental Panel on Climate Change (IPCC), Climate Change 2022: Mitigation of Climate Change, Chapter 7, Agriculture, Forestry and Other Land Uses, section 7.4.3.3 (Agroforestry).
- World Business Council for Sustainable Development (WBCSD), Nature-based Solutions Blueprint, 5 June 2024.
- Science Based Targets initiative (SBTi), Forest, Land and Agriculture Science-Based Target-Setting Guidance, version 1.2, March 2026, section 3.1.4, pp. 37–38.
- United Nations Environment Programme (UNEP), State of Finance for Nature 2023, 2023.
A plastic credit funds the collection of plastic waste in places where no formal system exists to collect it. Each credit represents a measured, independently audited quantity of plastic taken out of the environment or returned to use, tracked on a public registry.



