

SYDNEY, Wednesday 27 May 2026 — A new report from Greenpeace Australia Pacific and independent expert Ketan Joshi reveals how the frenzied rollout of AI data centres in Australia is set to derail the renewable energy transition, entrench gas and turbocharge climate pollution, prompting calls for an urgent moratorium on data centre approvals until appropriate guardrails are in place.
The report, Energy Vampires: the AI data centres draining Australia, reveals the staggering scale of data centre growth in Australia, set to follow a US path of emissions blowout and rising community opposition to the resource-hungry facilities. The report exposes the links between the data centre lobby and the gas industry, who are using data centre growth to justify extracting more gas.
Greenpeace Australia Pacific is calling on the Federal Government to urgently implement a moratorium on the construction and approval of new data centres, until appropriate regulations and safeguards have been put in place to protect the climate and communities.
Key findings:
- Data centres are already failing to cover their own demand with additional renewable energy, and resisting calls to mandate that they do.
- At its peak, Australia’s biggest proposed data centre, the 1GW Mamre Road Data Centre Campus in Western Sydney, will generate annual emissions equivalent to 560,000 petrol cars, or all domestic flights within NSW in 2023.
- There are early signs of a data centre-fuelled gas boom in Australia, including proposals for new on-site gas, as seen in the US.
- Cloud Carrier’s proposed gas-fired data centre in NSW would wipe out the state’s entire projected 2028 emissions cuts.
- Even if only 1 in 4 new Australian data centres were powered by new on-site gas, it would result in 2.8x higher total emissions compared to using grid power.
Joe Rafalowicz, Head of Climate and Energy at Greenpeace Australia Pacific, said: “Australia is completely unprepared for the magnitude of impacts of the AI-driven data centre frenzy. Data centres are being rolled out at a feverish pace, with some of the largest planned for Australia consuming as much energy as Adelaide. The recent federal and state energy minister communique is a positive first step towards regulating the data centre industry, and managing its impact on the energy transition and the communities where they’re being built.
“But we should all be concerned by the extreme lack of scrutiny being applied to the companies leading the data centre charge in Australia and their proposals. Without strong, legislated standards, we risk replicating the disastrous US pattern, where Big Tech corporations have carte blanche to drain energy and water, and build new, polluting gas and diesel-powered plants to fuel their operations. This has seen mounting community opposition that transcends party politics, something we’re beginning to see here in Australia.
“Greenpeace is calling for a moratorium on new data centre approvals and construction until we have clearly defined, enforceable regulations and standards in place to govern this industry — essential if we hope to avoid the alarming outcomes outlined in this report.
“Australia is not a playground for Big Tech corporations. It is time our leaders stepped up and took seriously their role as custodians of our resources and protectors of our society and environment.”
Ketan Joshi, independent report author and climate expert said: “Impatience is not a virtue. The reckless data centre buildout is heaping massive new load onto the grid, meaning renewables have to run harder just to stay in the same spot. Currently data centres increase coal and gas output and delay shutdowns, while plugging polluting gas into data centres does the damage directly instead.
“Unless the data centre industry builds no new fossil fuels and far more new renewables than new demand, we end up worse off. Australia’s gas industry sees a lifeline in an unchecked data centre frenzy, and the feeling seems to be mutual.
“Data centre demand projections keep jabbing upwards each revision, and emissions projections keep getting worse. Everywhere in the world facing this frenzy sees the same trend.
“Data centre moratoria have bipartisan support in countries around the world as the only path to reintroducing careful, considered governance of data centre growth. In the context of an irrational, unjustified panic, a temporary pause brings reason and rationality, along with bringing power to communities.”
-ENDS-
Images and an interview clipreel of Greenpeace spokespeople at the Mamre Road data centre in Western Sydney available here.
Media contacts:
Lucy Keller on 0491 135 308 or lucy.keller@greenpeace.org
Kate O’Callaghan on 0406 231 892 or kate.ocallaghan@greenpeace.org

This is a republication of October’s edition of The Climate Agenda – a subscriber-only newsletter designed to keep you informed of the key events, negotiations and announcements happening every month. If you want to receive The Climate Agenda straight to your inbox at the start of each month, sign up as a subscriber today.
This month, we’ll be on the ground reporting from the Convention on Biological Diversity summit in Yerevan, Armenia later this month and following all the developments as we build towards COP31 in Antalya, Türkiye next month. Here’s what you need to know for October, why it matters and what to expect.

Brazilian Election
First round: Sunday 4 October – Second round: Sunday 25 October
This poll is being closely watched by Brazilian environmentalists as it’s likely to make a big difference to Brazil’s international climate politics and the health of the Amazon rainforest.
The two clear front-runners are current left-wing President Lula and right-wing Flávio Bolsonaro. Flávio is the son of Jair Bolsonaro, who ruled from 2019 to 2023 but was declared ineligible to hold public office because of his attacks on the electoral system and is now under house arrest.
In the unlikely event that either candidate wins more than half the votes in the first round, they will be elected as the country’s leader. Latest polls have Lula on 39% and Bolsonaro on 35% (though the numbers are shifting) with several minor candidates in the single-digits. If none of them get a majority, there will be a one-on-one run-off on October 25.
The Latin American nation is set to record its lowest-ever level of deforestation, as efforts to rein in illegal clearing and restore Indigenous rights progressed under Lula. But Brazilian experts are warning that the huge agribusiness lobby in Congress, whose interests shape what happens in the Amazon, will be emboldened if Bolsonaro takes power, with the Supreme Court also risking a turn to the right.
As for climate politics, some seasoned watchers fear that Flávio – a climate change denier like his dad – could even try to pull Brazil out of the Paris Agreement. That would leave other countries to take forward Brazil’s COP30 global roadmaps on transitioning away from fossil fuels (TAFF) and ending deforestation – both of which are due to be delivered by COP31.
For Brazil’s own TAFF roadmap – commissioned earlier this year but so far nowhere to be seen – the election may have less of an impact, given Lula is as keen as any other politician to extract oil and gas from the Amazon, amid cross-party support for fossil fuel production.
Read more: Brazil leads “encouraging” decline in global rainforest destruction in 2025

Pre-COP
Monday 5 October – Thursday 8 October – Fiji and Tuvalu
The annual Pre-COP meeting is usually a business-like gathering of government negotiators, sounding out each other’s positions and laying the groundwork for deals at the main COP summit. But this year’s “pre” has been jazzed up by Australia’s partnership with Pacific governments keen to elevate their climate issues on the international stage.
“We will bring the eyes of the world to our region, highlight the threat that climate change poses to it, and show how Pacific voices are shaping global action to counter it,” Australian PM Anthony Albanese said of the event.
On Monday, before the Pre-COP officially starts, a group of senior government figures – including a handful of leaders – will visit the world’s second lowest-lying nation Tuvalu, as UN boss Antonio Guterres did in 2019.
They will visit areas affected by sea level rise, see climate resilience projects and meet local communities before flying 2.5 hours south to Fiji to join up with the Pre-COP – which starts on Tuesday – and speak at a “Leaders’ plenary session” that evening.
The Pre-COP runs until Thursday. Governments are expected to try to advance on some kind of a roadmap for protecting oceans from climate change, while Fiji says Pacific nations will emphasise the need to follow science and step up efforts to limit warming to 1.5C.
Australia is also due to present an action plan to improve access to climate finance for small island nations and least-developed countries, so that governments, development banks and climate funds can endorse it ahead of the Antalya summit.
Alongside the official Pre-COP discussions, a “green zone” will host talks organised by civil society on topics like public transport, carbon markets and the International Court of Justice advisory opinion. Unfortunately, these events won’t be available to follow online.
Read more: Threatened by rising seas, small islands secure right to keep their statehood
Read more: At regional summit, Pacific islands ask for COP31 support for clean energy and finance
Article 6.4 Supervisory Body
Monday 5 October – Friday 9 October – Bonn, Germany
The UN carbon market’s rule-making body meets for one last jam-packed session ahead of COP31, with decisions pending on several high-stakes issues that could shape the future of the new crediting mechanism.
Top of the agenda is a rulebook for clean cooking projects, which aim to cut greenhouse gas emissions by distributing more efficient cookstoves. These projects generate some of the most popular carbon credits but have also drawn some of the heaviest criticism for overstating their climate benefits through lax accounting.
Technical experts have recommended the Supervisory Body tighten the rules compared to existing crediting programmes, including by forcing cookstove project developers for the first time to guard against the risk of the climate benefits of their credits – the trees saved from becoming cooking fuel – being wiped out by fire, drought or logging.
The proposal on the so-called reversal risk assessment has sparked a “coordinated” lobbying campaign from the industry, some conservation NGOs and UNEP, arguing that stronger protections could hike project costs and restrict the supply of credits.
Read more: Industry and NGOs lobby to weaken UN carbon credit rules in “coordinated” push
Intergovernmental Panel on Climate Change (IPCC) plenary
Monday 12 October – Friday 16 October – Addis Ababa, Ethiopia
Scientists and government officials will try, once again, to agree on a timeline to produce the highly influential AR7 assessment report from the UN’s climate science body.
The faultlines that have blocked a deal at several previous sessions are well established: a large group of predominantly developed countries, small island and progressive Latin American states and the poorest nations want the reports to be ready in time to inform the UN’s next global assessment of climate action, due to be completed in November 2028.
A small group of primarily big emerging economies disagree, claiming this timeline would put a burden on developing countries with limited resources and restrict their ability to provide scientific input into the process.
Three options will be on the table in Addis Ababa. Two of them would see all three flagship assessment reports approved by July 2028 and September 2028 respectively, just in time to feed into the second Global Stocktake.
The third, based on proposals from Saudi Arabia and India, would deliver only the Working Group 1 report, on the physical science of climate change, by May 2028. The reports from Working Groups 2 and 3, covering climate impacts and ways to cut emissions, would not be approved until mid-2029, well after the stocktake concludes at COP33.
Delegates are also expected to discuss the IPCC’s increasingly strained budget, made worse by a funding gap left by the withdrawal of the United States. The panel has warned that, without a sustained increase in contributions, its trust fund’s cash balance would run out by the end of 2028, putting the delivery of the AR7 set of reports at risk and forcing cuts to in-person meetings, translation and outreach.
Read more: Science ‘under attack’ from fossil fuel interests at UN climate talks
Read more: As science comes under attack at UN talks, climate movement splits over how to respond

World Bank & IMF Annual Meetings
Tuesday 12 October – Sunday 18 October – Bangkok, Thailand
With their biggest shareholder – the US – resolutely opposed to climate action, the World Bank and International Monetary Fund (IMF) are likely to try to avoid mentioning climate change at their annual meetings in Bangkok – and there are no headline events on the subject.
But they aren’t in complete control of the agenda. Thailand will host a discussion on financing a green resilient economy and World Bank President Ajay Banga is likely to be challenged on climate at a live-streamed civil society townhall on October 12.
With tricky negotiations on the World Bank’s climate finance target concluded earlier this year (it was dropped), talks are moving on to the sustainability framework of the World Bank’s International Finance Corporation, which invests in the private sector. Civil society is calling for its rules on protecting people and the planet to be maintained and strengthened.
The IMF’s guidance note to staff – which shapes the circumstances under which climate can be included in IMF programmes – will also be negotiated. Longer term, the Resilience and Sustainability Trust, which channels funding to green projects, will be reviewed but not before 2028 at the earliest.
Read more: World Bank’s climate work can endure without finance target, experts say
Convention on Biological Diversity (CBD) COP17
Monday 19 October – Friday 30 October – Yerevan, Armenia
The biodiversity COP – a sister convention to the UN climate process – will for the first time take stock of progress towards key goals in its 2022 landmark agreement, the Global Biodiversity Framework (GBF). These include a headline target to protect and conserve at least 30% of the planet’s land and marine ecosystems by 2030.
A draft report prepared by a scientific panel warns that “unless collective implementation accelerates rapidly, the 2030 targets and mission will not be achieved”. In fact, governments are failing on 22 out of 23 targets. The final report is expected to be published ahead of COP17, where governments are expected to react strongly.
UN biodiversity chief Astrid Schomaker told journalists earlier this month that the most significant progress is expected to occur towards the end of the decade, as 174 countries took the first four years to develop national targets.
Finance, meanwhile, is set to become a contentious issue, as the draft report says developed countries fell short on a target to provide $20bn per year in international public finance for nature protection, reaching only about $17bn per year from 2020 to 2023. They have also yet to meet a wider goal to mobilise $200bn per year counting all kinds of finance.
Much like in climate talks, the EU has proposed to broaden the base of donors to include emerging economies who want to “voluntarily assume the obligations” of developed countries. Saudi Arabia and Qatar want nothing to do with this proposal. China has said bringing in new contributors should not weaken the obligations of developed countries. Expect a fight in Yerevan.
A preliminary meeting in Nairobi in August resulted in a heavily bracketed text that delegates will have to unravel in Armenia. One observer said countries had “overall missed the level of urgency” needed.
Keep an eye out for our webinar live from Yerevan later this month, where we’ll provide an update on the talks and how governments are responding to science’s demands for quicker action.
Read more: Mombasa ocean summit drives progress on marine protection, but threats persist
Read more: UN biodiversity talks agree finance roadmap, postponing decision on a new fund
European Climate Resilience & Risk Management Framework
Wednesday 28 October – Brussels, Belgium
Following a torrid summer beset by recurring heatwaves, drought and outbreaks of forest fires across the continent, the European Commission will present its keenly awaited climate resilience and risk management framework to help member states protect their populations from worsening climate change impacts.
As part of the policy package, the Commission will identify 100 of Europe’s most climate-vulnerable territories. And alongside an assessment of the risks, there will be guidance at which level they should be managed – regional, national or by the EU. Currently, confusion often arises over who is responsible for preventing, preparing for and managing disasters across the bloc.
The framework will also aim to make Europe a “champion in adaptation technologies” – such as drought-resistant crops, flood prevention or energy-efficient cooling – which have been described by EU President Ursula von der Leyen as “a huge emerging market”.
With only around a quarter of catastrophe losses in Europe covered by private insurance, the Commission also plans to set up a Climate Insurance Alliance to boost that figure.
READ MORE: WHO issues new guidance on heat-health action plans, as El Niño sets in
The post What’s on the climate calendar for October 2026? appeared first on Climate Home News.
On the desert shores of the Red Sea, Jordan plans to build a vast desalination plant to send drinking water hundreds of kilometres across its arid interior to the capital, Amman – bolstering climate resilience and reducing the country’s reliance on Israel for the vital resource.
As climate change exacerbates water scarcity in Jordan, a deterioration in the country’s already prickly ties with Israel since the start of the Gaza war has underscored the strategic importance of the roughly $6-billion desalination initiative, billed by its backers as a strategic climate adaptation project.
But despite receiving $295 million in support for the project from the UN’s Green Climate Fund (GCF), the energy-hungry plant – which will double the power needs of Jordan’s water sector – will get no more than 27% of its electricity from a purpose-built solar farm in the desert near the plant in Aqaba. The rest will come from the grid, whose power is mostly generated by fossil gas.
To get salt out of sea water, it has to be pushed at high pressure through a membrane – a process requiring huge amounts of electricity.
-
Self-taught mechanics give second life to Jordan’s glut of spent EV batteries
As EV sales boom in Jordan, a lack of formal infrastructure for dealing with end-of-life batteries is leading to some innovative solutions -
Egypt seeks to unlock renewable potential to power regional clean energy hub
Europe is investing in Egypt’s bid to position itself as a clean electricity exporter to reduce its emissions and generate a new source of income -
Palestine: Israel’s bombing has left Gaza vulnerable to climate change
With homes, hospitals and water storage destroyed, Palestine’s government says that Gazans have little protection from climate impacts and sets conditional emissions targets


The annual planet-heating emissions from producing the non-renewable power needed for the plant would be equivalent to having 160,000 petrol-run cars on the road for a year, according to an analysis by Climate Home News of figures provided by the project’s developers to the GCF – the world’s largest multilateral fund to help developing countries tackle climate change.
Such forecasts prompted a warning from its independent technical advisory panel and criticism by climate campaigners, but the GCF board nevertheless approved the financing at a meeting late last year, with GCF Executive Director Mafalda Duarte hailing it as a “milestone project”.
A GCF spokesperson told Climate Home News its design “required the balanced optimisation of multiple objectives”, among them water security, financing considerations and climate-related benefits.
Asked to respond to concerns about the project’s sustainability, a spokesperson for Jordan’s Ministry of Water and Irrigation said the plant is key to tackling the nation’s water deficit, in tandem with other steps to conserve supplies such as managing leaks.
“We have carried out environmental impact studies for the Aqaba desalination plant,” the spokesperson added. “All donor countries reviewed and approved these studies.”
Dry and getting drier
Jordan is already one of the world’s most water-stressed countries, and climate change impacts mean the country of about 11 million people is getting less rain at a time of population growth, in part due to the arrival of refugees from the war in Syria.
Half of Jordanian homes currently receive water for less than 24 hours a week and many pay to get tanker trucks to deliver extra water despite the high cost.
“Every Jordanian living in a village or city … can feel, especially in the summer, that the amount of water reaching their home is not enough,” said University of Jordan water science professor Elias Salameh.

At the same time, heightened political tensions in the region are raising fears over a long-standing water supply accord with Israel.
Prominent Israeli news outlet Ynet quoted government officials as saying last year that – until Jordan ends its criticism of Israel’s actions in Gaza – it would no longer send Jordan 100 million cubic metres of water a year, as it has been doing since 2021.
Instead, media reports said Israel had decided to send just the 50 million cubic metres required by the 1994 Israel-Jordan peace agreement.
That makes the desalination project all the more urgent, Motasem Saidan, a former water minister who pushed it forward, told Climate Home News.
“Relying on neighbouring countries for sources of the most important resource for life is risky. You need to have self-sufficiency and water security,” Saidan added.
Largest single GCF investment
French multinationals Meridiam and Suez have been awarded the contract to lead construction of the desalination facility, which Suez says will be one of the largest of its kind globally.
Scheduled for completion in 2030, it will turn 300 million cubic metres of seawater a year – enough to fill 120,000 Olympic-sized swimming pools – into drinking water, which will then be carried by pipeline more than 400 km across the desert to reservoirs near Amman, home to nearly half of Jordan’s population.

The GCF will support it with a $220 million loan and a $75 million grant. While that represents a small share of the total cost, Duarte said last year it represented “the largest single investment in one project that we have made”.
But the GCF’s decision to pour millions into the project followed strong criticism from climate campaigners, initial opposition from some of the fund’s board members and a warning by its independent technical advisory panel (ITAP) over its potential impact on emissions.
The emissions it aims to avoid rest on the timely completion of a 65-km transmission line connecting the desalination plant to the solar farm. Without this, the plant will run entirely on Jordan’s gas-dominated grid, the ITAP said in its assessment report.
Moreover, while the government plans to make the power supplied by the national grid greener in the years ahead, there is no guarantee this will be achieved, the report added.
Such issues make the project “difficult to reconcile with climate finance objectives”, the ITAP said, adding there is a significant risk that “concessional resources could end up subsidising a high-carbon, high-cost water pathway”.
Still, the ITAP concluded that “given the dire water situation in Jordan”, the project’s benefits outweighed those concerns and recommended approval to the board.
Bigger renewables role deemed unfeasible
The possibility of producing more of the plant’s electricity from solar power and batteries was dismissed by the project’s proposer and co-funder – the World Bank’s International Finance Corporation (IFC) – and the GCF as too expensive and impractical, a decision critics see as a wasted opportunity to shift to clean energy.
The companies that carried out the project’s environmental and social impact assessment – Eco Consult and Energies Group – said the option of sourcing all power from renewables “was not studied in detail” because it was seen as unfeasible.
-
Nepal flood destruction shows “limits to adaptation”, scientists say
The rock-ice avalanche that caused the flood was very hard to predict, scientists from across the world have found -
Can new CEO steer Global Center on Adaptation back on course?
Madagascar’s Rindra Rabarinirinarison takes the helm of the troubled organisation promising to prioritise fundraising, rebuild trust with donors and hone its mission -
Business-as-usual: Donors pour climate adaptation finance into big infrastructure, neglecting local needs
A deep-sea port project in Bangladesh highlights how some major donor nations are labelling funds for industry-friendly transport and energy projects as adaptation finance, reporting by Climate Home News shows


Asked to comment, the GCF spokesperson said the fund supported that conclusion, citing renewable energy’s intermittency and noting that excess solar power produced would be wasted because there is no provision for it to be sold to the grid.
“The optimum design of such a critical life-line desalination project for Jordan is fundamentally a whole-of-system water optimisation challenge rather than a standalone energy storage exercise,” the spokesperson said.
Instead, the plan’s advocates have touted potential emissions reductions as the pipeline replaces water trucks. They say the solar farm set to supply more than a quarter of the desalination plant’s power will prevent 6.7 million tonnes of CO2-equivalent being emitted over its 26-year projected lifetime.
Saidan, the former water minister, said the urgency of providing water must take priority over gas dependency concerns.
“This is not the time to raise such issues,” he told Climate Home News.
But Kostanta Rangelova, a global electricity analyst at think-tank Ember, said the plant could “easily” get at least 80% of its power from solar with batteries, pointing to Jordan’s abundant sunshine and the plunging costs of the equipment needed.
Such systems are set to power large facilities elsewhere in the region, like a luxury Red Sea resort just over the Saudi border and a data centre near Abu Dhabi, she said. Jordan’s own energy sector strategy, published in May, lists increasing battery storage as a strategic target.
Rangelova noted that with battery prices falling significantly in recent years, the cost of solar plus battery storage is now competitive with grid power in many places, particularly in countries like Jordan that have a lot of sun but currently rely on expensive imported gas.
“With solar and batteries, Jordan (could) use homegrown electricity not just during daytime hours, but round-the-clock, which can significantly strengthen its energy security position,” she added.
Lesser of two evils
Using more renewables in the project could also help reduce demand for Israeli natural gas imports – a sensitive issue in Jordan.
“[The desalination plant] will not be viable if we depend on gas supplied by the Israeli occupation,” Mahmoud Amin Al-Hayari, an activist with the General Trade Union of Electricity Workers in Jordan, told Climate Home News.
Jordan’s government is working to develop new sources of gas imports to diversify its current supply, and also wants to boost domestic gas production, alongside renewables.
In the meantime, Jordan’s National Electric Power Company (NEPCO) remains heavily dependent on Israeli gas for electricity generation, industry experts say. Latest government figures from 2024 show the country got 58% of its electric power from gas.
Most of that gas is likely to be Israeli. “About 57% of the electricity that NEPCO supplies to distribution companies comes from gas imported from Israel,” a Jordanian energy and conflict analyst told Climate Home News, asking to speak anonymously due to the sensitivity of the subject.
The spokesperson for Jordan’s Ministry of Water and Irrigation declined to comment on the source of the gas that would help power the Aqaba desalination project.
The issue has gained attention due to several security-related gas supply disruptions from Israel related to the conflict in the Middle East.
For countries like Jordan, a net fuel importer, the energy security case for boosting renewables is a no-brainer, said Ember’s Rangelova. “Unlike imported fossil fuels, the sun cannot be turned off,” she said.
The post Jordan’s mega-plan for water security risks locking in fossil gas demand appeared first on Climate Home News.
Jordan’s mega-plan for water security risks locking in fossil gas demand
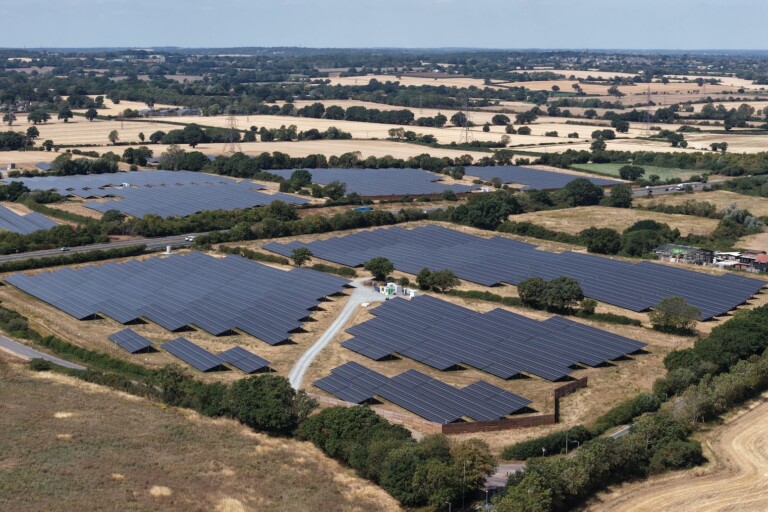
The UK has avoided the need for gas imports worth £5.9bn since the start of the Hormuz crisis as a result of record electricity generation from wind and solar, reveals Carbon Brief analysis.
While gas prices are surging towards levels not seen since the 2022 energy crisis, the UK has been generating record amounts of power from wind and solar, up 14% year-on-year.
This unprecedented clean-power generation is directly cutting the need for gas-fired electricity, which is down by nearly 10% year-on-year in 2026 to date.
In total, wind and solar have generated a record 41% share of the UK’s electricity needs in 2026 to date, compared with 25% from gas, according to Carbon Brief’s analysis.
The figure below shows that wind and solar generation has avoided the need for UK gas imports worth a total of £5.9bn since the outbreak of war between the US and Iran in February 2026.
The analysis shows that these avoided gas imports would have required the UK to secure the equivalent of more than 100 additional tanker deliveries of liquefied natural gas (LNG).
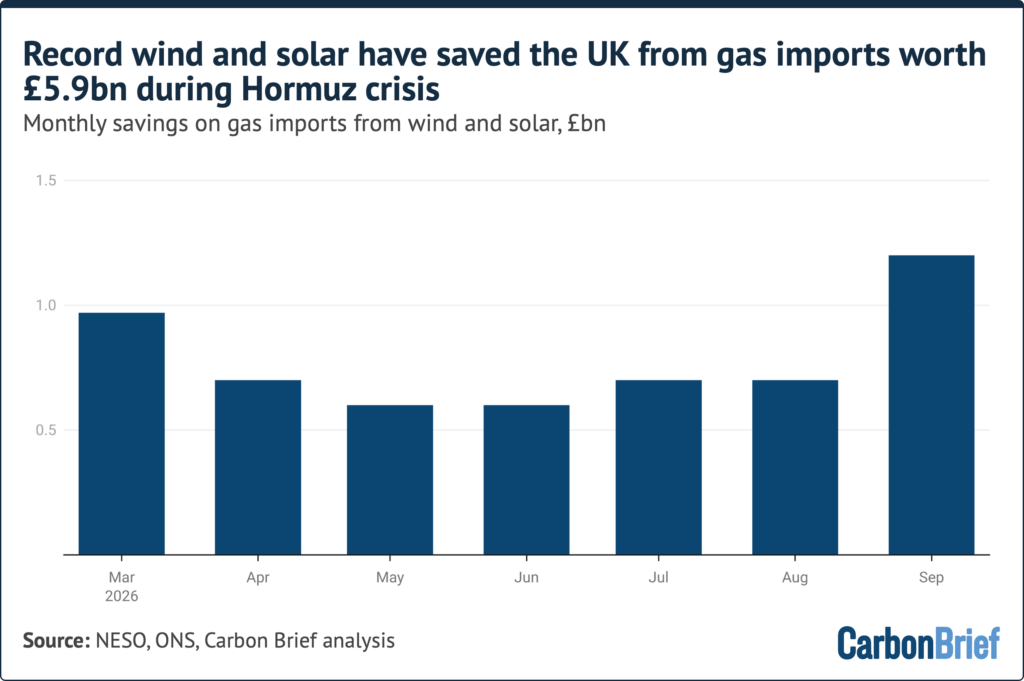
The £1.3bn import saving in September 2026 to date is the result of record wind and solar output, at nearly 10 terawatt hours (TWh), combined with surging gas prices.
Wholesale gas prices in the UK have remained elevated ever since Russia cut off supplies to Europe in the wake of its invasion of Ukraine in 2022. Gas averaged 90p per therm from 2023 until the start of this year, roughly three times above 2019 prices, before the Covid and Ukraine crises.
Since the outbreak of war in the Middle East in March, gas prices have climbed higher still, averaging 134p per therm or nearly four times the level seen in 2019.
In September 2026 to date, gas prices have averaged 189p per therm, reaching their highest level since the global energy crisis in 2022, as shown in the figure below.
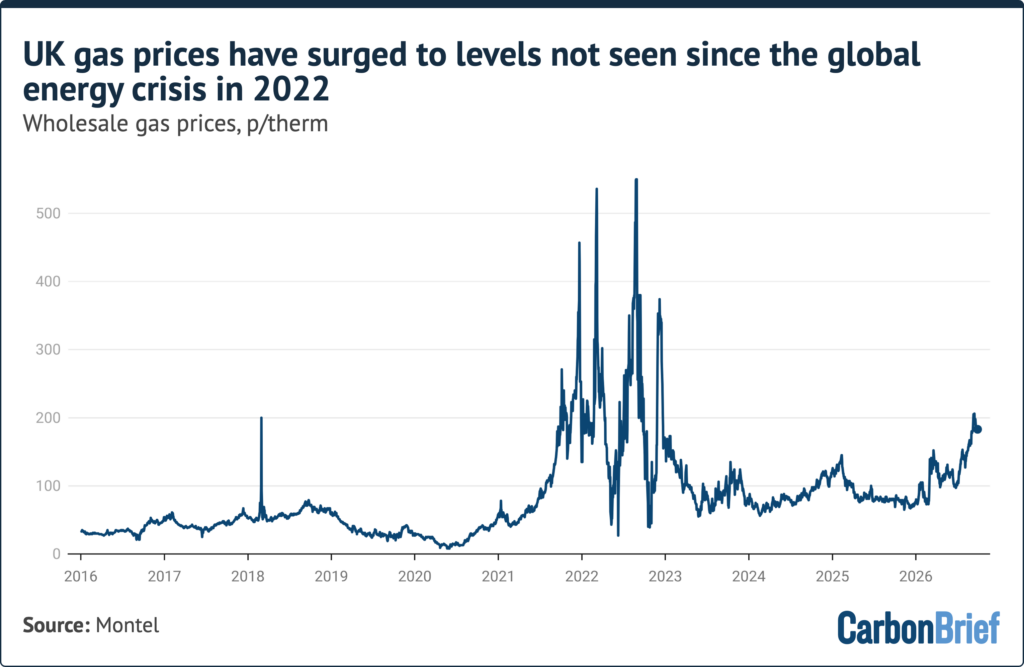
UK gas prices are spiking again because winter is approaching – meaning higher demand for heating – and there is no end in sight for the Hormuz crisis.
At the same time, European gas stocks are low. This means Europe will have to compete with Asia to secure the cargoes of LNG needed to keep warm.
In the UK, high wholesale gas prices are hitting household gas bills under the price cap set by energy regulator Ofgem – but thanks to clean energy, electricity bills have barely increased.
From this Thursday, 1 October, typical household gas bills will be 33% higher than they were in April, some £200 per year, according to thinktank Nesta.
In contrast, household electricity bills will only have risen 4%, according to Nesta’s analysis.
Andrew Sissons, director for sustainable future at Nesta, explained in a social media post that “the link between electricity and gas prices has already begun to break”.
The UK and other fossil-fuel importing nations are being hit not only by high gas prices, but also by high prices for oil, diesel and other refined fuels. The EU has reportedly had to pay an extra €100bn for fossil-fuel imports since the start of the crisis.
For example, UK diesel prices this week hit record levels of nearly £2 per litre. In contrast, recent Carbon Brief analysis shows that electric cars are up to nine times cheaper to drive.
In her speech to the Labour party conference this week, energy secretary Miatta Fahnbulleh said that energy bills were high because the UK is “exposed to global fossil-fuel markets”.
In his own conference speech, prime minister Andy Burnham said the expansion of clean energy was easing the impact of high gas prices on electricity bills. He said:
“We are already taking more control of our electricity prices with a massive expansion of home-grown renewables and nuclear. I have asked Miatta to speed up the breaking of the link between what we pay for power at home and the international gas market, to get bills down.”
The post Analysis: Wind and solar save UK from gas imports worth £5.9bn during Hormuz crisis appeared first on Carbon Brief.
Analysis: Wind and solar save UK from gas imports worth £5.9bn during Hormuz crisis



-
Climate Change1 year ago
Guest post: Why China is still building new coal – and when it might stop
-

 Greenhouse Gases2 years ago
嘉宾来稿:满足中国增长的用电需求 光伏加储能“比新建煤电更实惠”
-
Greenhouse Gases1 year ago
Guest post: Why China is still building new coal – and when it might stop
-

 Climate Change2 years ago
嘉宾来稿:满足中国增长的用电需求 光伏加储能“比新建煤电更实惠”
-

 Renewable Energy11 months ago
Sending Progressive Philanthropist George Soros to Prison?
-
Climate Change2 years ago
Bill Discounting Climate Change in Florida’s Energy Policy Awaits DeSantis’ Approval
-
Greenhouse Gases1 year ago
嘉宾来稿:探究火山喷发如何影响气候预测
-

 Climate Change2 years ago
Analysis: China’s CO2 falls 1% in Q2 2024 in first quarterly drop since Covid-19