

Article Contents

The country’s largest exporter of liquefied natural gas benefited from what critics say is a questionable IRS interpretation of tax credits.
Cheniere Energy, the largest producer and exporter of U.S. liquefied natural gas, received $370 million from the IRS in the first quarter of 2026, a payout that shipping experts, tax specialists and a U.S. senator say the company never should have received.
Cheniere Energy Received $370 Million IRS Windfall for Using LNG as ‘Alternative’ Fuel
Continue Reading
An older teaching about land acknowledgement
As I have come to understand the spirit and intention of land acknowledgement, I often return to fond memories of my grandmother and her words of wisdom. She taught that the health of the places we call home comes first, because the wellbeing of the people depends on it.
In her teaching, land acknowledgement began with the land. Long before it became a paragraph read at the start of a meeting, it was a way of recognizing a homeland: its waters, its species, its seasons, and the spirit that revealed whether the place was well.
Her teaching echoes a practice found across many Indigenous Nations. Haudenosaunee gatherings, for example, have long opened with the Ohén:ton Karihwatéhkwen, the Thanksgiving Address, often translated as “the words that come before all else.” The speaker greets and gives thanks to the people, the earth, the waters, the plants, the animals, the winds, the sun, the moon and the stars. Only after everything that sustains life has been acknowledged does the gathering turn to its own business.
That order changes what an acknowledgement is for. Its purpose was to share the story of a place with neighbours and to draw them into the work of tending it. People entered the story second, as the ones responsible for what had just been named.
Understood this way, an acknowledgement does more than open a meeting. It asks us to reconsider where we stand, and what we owe the ground beneath us.
Nations among nations
In her teaching, people are one nation among many. The salmon are a nation. So are the cedars, the bison, the medicine plants, and the pollinators. Each belongs to a place, carries its own responsibilities, and offers gifts no other nation can give.
This idea of kinship runs through many Indigenous philosophies. The phrase “all my relations,” heard in ceremonies and gatherings across Turtle Island, is a reminder that family extends beyond people to the animals, plants, waters and lands that make life possible. Some Indigenous languages carry the same understanding in their grammar, speaking of many plants, animals and natural forces as living beings rather than objects.
Sovereignty, understood through this relationship, is a kind of standing more than a form of control. Each nation belongs fully to its place and carries its share of that place’s life. No nation thrives alone, and none thrives by taking over the whole.
The land is also the source of instruction. Over generations, people watched how a river valley or a stretch of prairie kept itself well: who arrived when, who fed whom, and how much could be taken before the giving stopped. In my grandmother’s telling, those observations became instructions, and those instructions helped shape law and protocol. They guided when to harvest, where to camp, how to enter a neighbour’s territory, and what was owed in return.
Indigenous legal scholars today often describe this as law that comes from the land itself, learned by watching how living systems sustain one another. A plainer name for it is knowing how to live somewhere.
The host and the guest
One of the clearest teachings in this understanding of the world is the relationship between host and guest. My grandmother invited us to recognize that relationship in the lives of plants and animals.
A host prepares the place before anyone arrives. A beaver family dams a stream, and the pond becomes a home for fish, frogs, birds and plants. A fallen tree becomes a nurse log, feeding the next generation of seedlings as it returns to the soil.
A host offers first. A flowering plant sets out nectar. A berry bush ripens fruit. These provisions come in their own season, not whenever a visitor happens to want them.
A host also makes its presence known. Birdsong, scent and the marks left along a trail tell newcomers that a place is already inhabited. The visitor does not arrive in an empty world.
The guest has responsibilities too. A guest attends to the season and to what the place can offer. A guest does not assume that everything within reach is theirs to take. A guest leaves something that helps sustain the relationship.
A bee takes nectar and carries pollen. Read through this teaching, that exchange offers an image of visiting well: receiving a gift while helping the host continue its life.
Many Indigenous harvesting protocols carry the same ethic into daily practice: ask before taking, take only what is needed, offer thanks, and leave enough for others and for the plant or animal to recover.
None of this suggests that every relationship in nature is peaceful or generous. These are ways of seeing responsibilities that people can learn to carry.
Everyone is both
No being is only a host or only a guest.
A tree makes room for other life while depending on soil, water, sunlight, fungi, and relationships beyond itself. People, too, may welcome others into their homes while remaining dependent on the larger homeland that sustains them.
The distinction between host and guest is therefore about roles, not ranks. Everyone receives. Everyone has something to give.
The question is whether the exchange sustains the place.
A visitor who takes without restraint leaves less for those who come next. A host who neglects the place has less to offer. Both have responsibilities, and neither can fulfil them alone.
This is the heart of reciprocity, a principle found across Indigenous philosophies: relationships stay healthy when gifts move in both directions. The Haudenosaunee teaching of the seventh generation extends that exchange across time, asking that decisions made today leave the place well for those not yet born.
Mutual benefit begins here, with the recognition that different beings carry different gifts and obligations.
What people carry forward
My grandmother’s teaching connects these relationships to the ways people meet their neighbours.
The host prepares a place, offers food and rest, and explains where the visitor has arrived. The guest makes themselves known, explains why they have come, listens to the terms of the visit, and brings something in return. The gift may be material. It may also be labour, knowledge, news, or a commitment to help.
Nations around the Great Lakes carried this ethic into treaty. The Dish with One Spoon, an agreement among the Haudenosaunee, Anishinaabe and allied Nations, describes shared hunting grounds as a single dish. Everyone eats from it with one spoon, takes only what they need, leaves enough for others, and keeps the dish clean. The Two Row Wampum, between the Haudenosaunee and European newcomers, shows two vessels travelling side by side on the same river, each keeping its own ways and neither steering the other.
In this understanding, acknowledgement is more than naming the people associated with a territory. It is learning enough about a homeland to behave responsibly within it.
Whose home is this? What sustains it? What laws and agreements guide our presence? What can we receive, and what must we return?
These questions make acknowledgement a relationship rather than a recital.
They also make it diplomatic. A guest who recognizes the host’s homeland recognizes that they have entered a place with its own relationships and responsibilities. A host who welcomes the guest makes room for an encounter governed by those relationships.
Neither arrives without standing. Neither arrives without obligations.
Beginning with place
I write from the shores of the Bay of Quinte. Here, the teaching asks me to begin with the water, the shoreline, and the life they sustain. Before I describe myself, I must attend to where I am.
That does not make people or history less important. It places them within the homeland that gives them meaning. The people, their laws, their agreements, and their responsibilities all belong to the place.
In a time of longer fire seasons, troubled waters, and uncertainty about what the next season will bring, this teaching asks something difficult and useful of us: pay attention before you speak.
An acknowledgement cannot tell the story of a place if the speaker has stopped noticing it.
The land came first. Beginning there again means learning to name what sustains us, and accepting that what sustains us also asks something of us.
By Rye Karonhiowanen Barberstock
Photo by Andrik Langfield on Unsplash
The post The Land Came First appeared first on Indigenous Climate Hub.
Carbon dioxide (CO2) emissions from fossil fuels and cement are projected to fall by around 0.4% in 2026 to 38.2bn tonnes of CO2 (GtCO2), according to new figures from the Global Carbon Project.
This guest post is by:
- Dr Zeke Hausfather, Carbon Brief’s climate science contributor
- Prof Pierre Friedlingstein, chair of mathematical modelling of climate systems at the University of Exeter and part of the Global Carbon Project team.
Carbon dioxide (CO2) emissions from fossil fuels and cement are projected to fall by around 0.4% in 2026 to 38.2bn tonnes of CO2 (GtCO2), according to new figures from the Global Carbon Project.
The 21st edition of the annual “global carbon budget” report, published today, says that this small decline is largely due to a 1.9% drop in emissions from oil and the energy shock triggered by the Iran conflict and the closure of the strait of Hormuz.
Emissions from coal continue to increase slightly.
The Global Carbon Project’s projections for fossil fuel and cement CO2 emissions in 2026 are preliminary, with a range that spans a fall of -1.5% to a rise of +0.6%.
This means a small increase in emissions can not be ruled out.
Emissions from land-use change, such as deforestation, are projected to rise in 2026.
This is primarily driven by peat fires and forest degradation in south-east Asia and is linked to the development of a strong El Niño event this year.
As a result, total CO2 emissions from fossil fuels and land use are projected to reach a record high of 43.3GtCO2 in 2026 – marginally above 42.8GtCO2 in 2025.
Research published alongside the report by the same team in Nature Climate Change finds that the growth in solar, wind and electric vehicles (EVs) now offsets around two-thirds of the emissions that would otherwise come from rising energy demand.
However, the deployment of these technologies is not yet enough to push global emissions into a sustained decline, according to the study.
The 2026 global carbon budget report also estimates that:
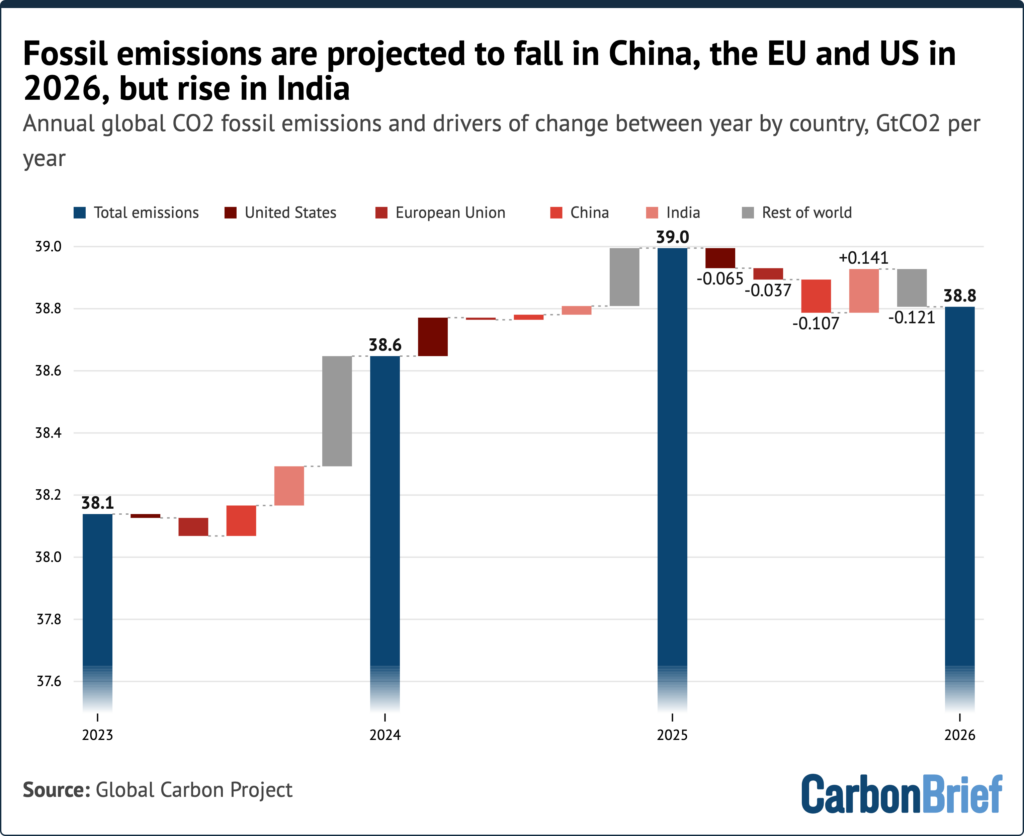
- Fossil emissions are projected to fall in China (-0.9%), the US (-1.3%) and the EU (-1.5%) in 2026, but rise by 4.4% in India.
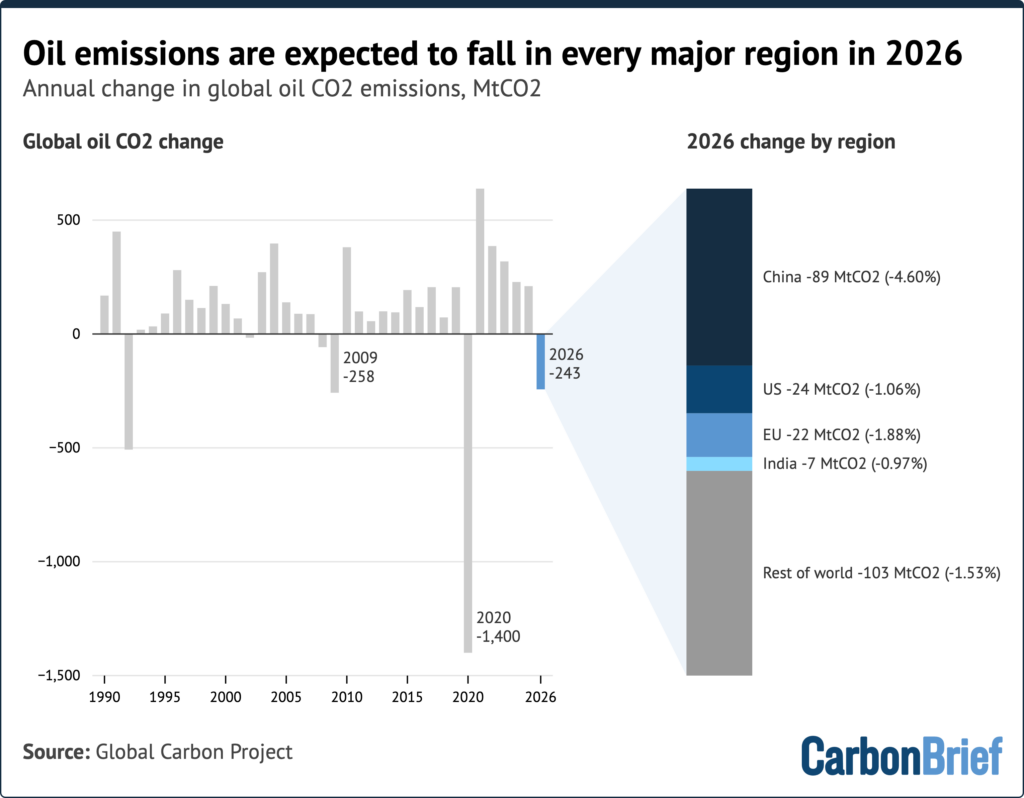
- Oil emissions are projected to fall in every major region, with the largest drop in China (-4.6%).
- Land-use emissions averaged 4.9GtCO2 per year over 2016-25, around 21% lower than the decade before.
- Total CO2 emissions (fossil and land-use) grew by an average 0.3% per year over the past decade (2016-25), compared with 1.7% per year over the decade before.
- The remaining carbon budget to limit warming to 1.5C is 150GtCO2, or less than four years of current emissions.
- The land sink in 2025 was the highest on record, rebounding after being weakened during the 2023-24 El Niño. The current El Niño is expected to weaken the land sink in 2027.
- The concentration of CO2 in the atmosphere is set to reach 427.7 parts per million (ppm) in 2026, 54% above pre-industrial levels.
(For more on previous editions of the Global Carbon Project’s annual report, see Carbon Brief’s coverage in 2025, 2024, 2023 and 2022.)
Total emissions edge up as land-use emissions rise
Total global CO2 emissions, which combines fossil fuels and land-use change, are projected to reach a record high of 43.3GtCO2 in 2026, up from 42.8GtCO2 in 2025.
The increase in 2026 comes entirely from a projected rise in land-use emissions, which are more challenging to estimate than fossil emissions.
(The global carbon budget groups emissions from fossil fuels and cement production as “fossil emissions”. Carbon Brief follows this convention throughout this piece.)
If land-use emissions had stayed at 2025 levels, total emissions would have fallen slightly in 2026 to around 42.6GtCO2.
Each edition of the global carbon budget updates the historical record as new data and methods become available. The chart below shows total emissions in this year’s budget compared with the five previous editions.
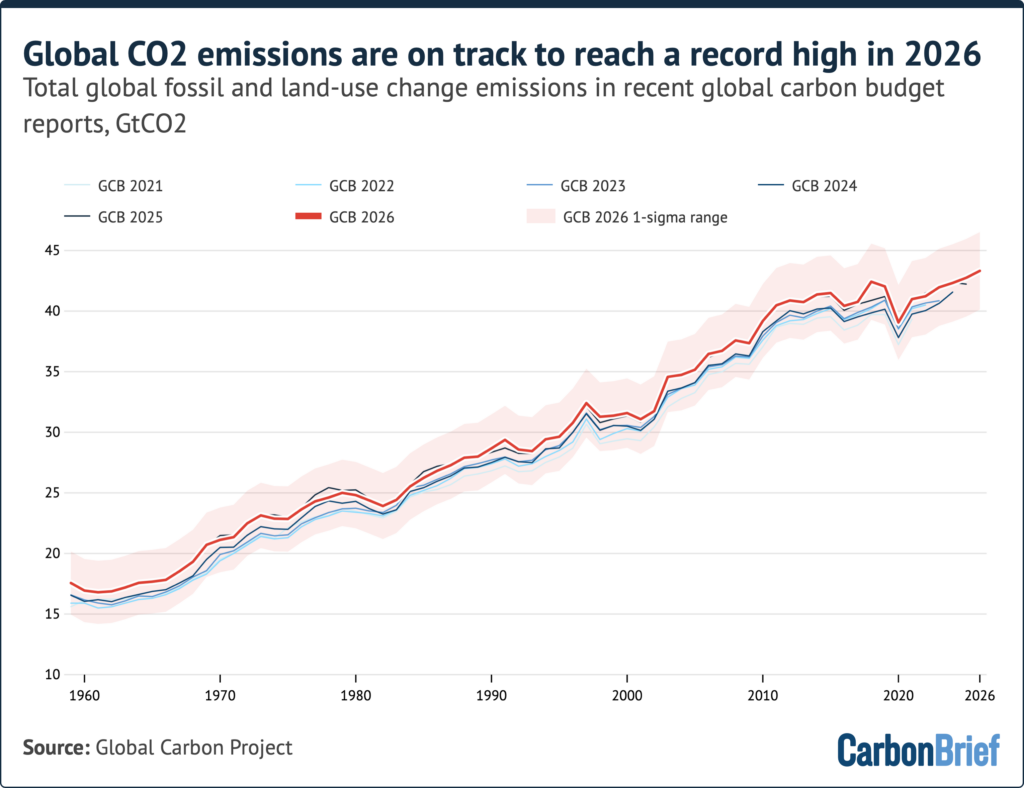
This year’s estimates of historical fossil emissions are around 0.3GtCO2 per year higher than in last year’s budget.
This is largely because the report now estimates a smaller “cement carbonation” sink in the wake of research published this year in Communications Sustainability. In other words, it estimates that cement is able to slowly reabsorb less CO2 over its lifetime than previously thought.
Estimates of land-use emissions have also been revised, including a spike in 2018 – visible in the chart above – linked to updated cropland data for Colombia.
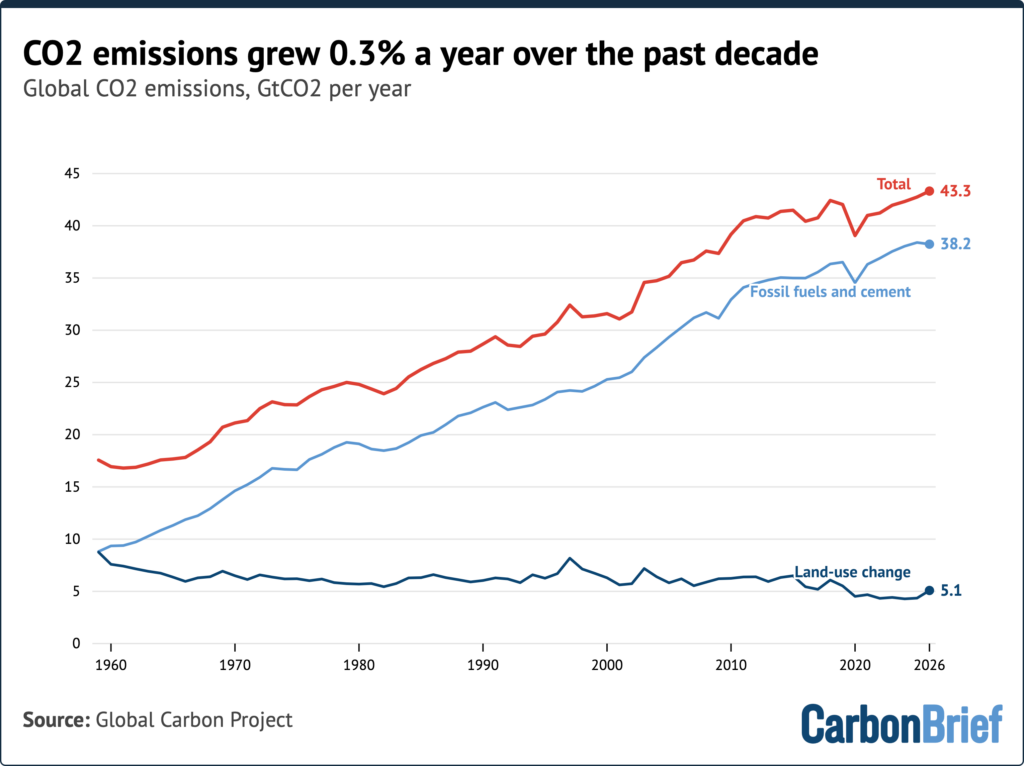
The updated numbers show that total emissions have grown by 0.3% per year over the past decade (2016-25), compared with 1.7% per year over 2006-15.
Fossil emissions grew about 0.9% per year in the past decade, compared with 1.9% the decade before. Over the same period, land-use emissions have declined.
While the slowdown reflects real progress, a plateau in emissions is still a long way from the rapid declines needed to reach net-zero emissions and stabilise global temperatures.
With human-caused warming reaching 1.37C above pre-industrial levels (1850-1900) in 2025, the report estimates that the remaining carbon budget to limit warming to 1.5C, with a 50% chance, is 150GtCO2 from the start of 2027. That is less than four years of 2026 emissions.
Meanwhile, the budgets for 1.7C and 2C are 510GtCO2 and 1,035GtCO2, respectively – or around 12 and 24 years of current emissions.
Fossil emissions made up around 88% of total CO2 emissions over the past decade, with land-use change making up the remaining 12%.
This is a marked change from the first half of the 20th century, when land-use emissions were larger than those from fossil fuels.
The figure below shows global emissions, split into fossil and land-use components.
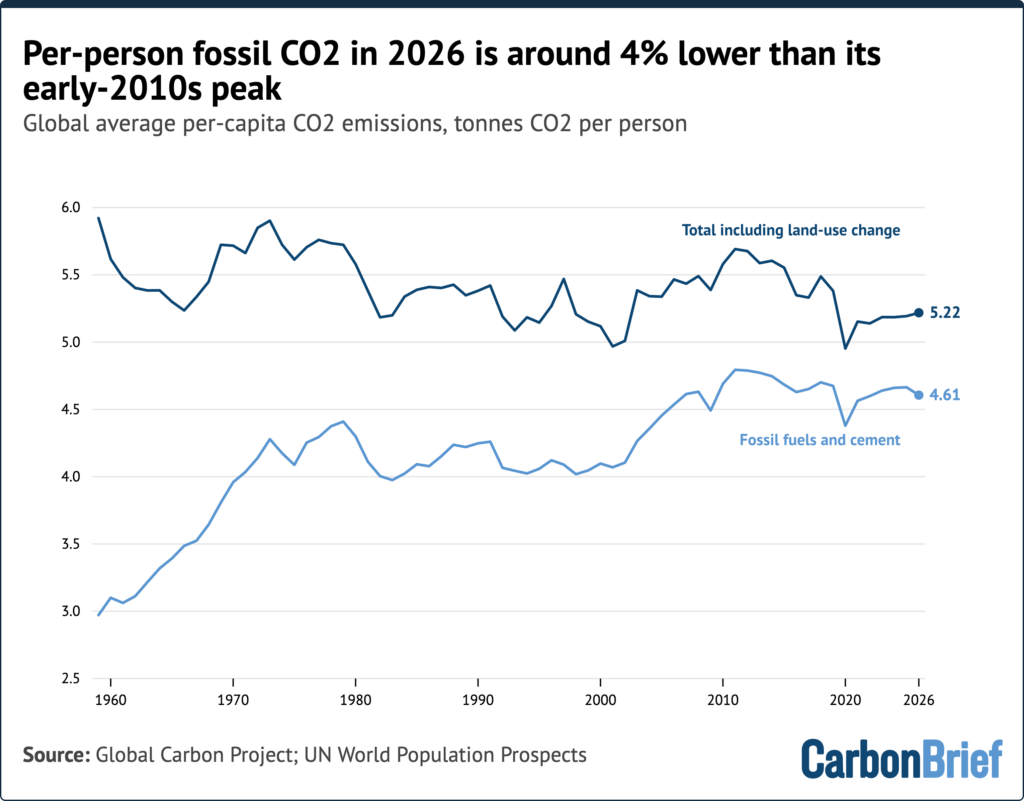
Global per-capita fossil emissions peaked in the early 2010s and have since slightly declined. At around 4.6 tonnes per person in 2026, they are about 4% below that peak.
It is worth noting that this global average hides very large differences between countries. For example, 2025 per-capita emissions in India are only 2.2 tonnes, compared with 14.5 tonnes in the US.
Land-use emissions rise in 2026
Land-use emissions come from deforestation, forest degradation, wood harvest, peatland drainage and fires. They are partly offset by forest regrowth and new forests.
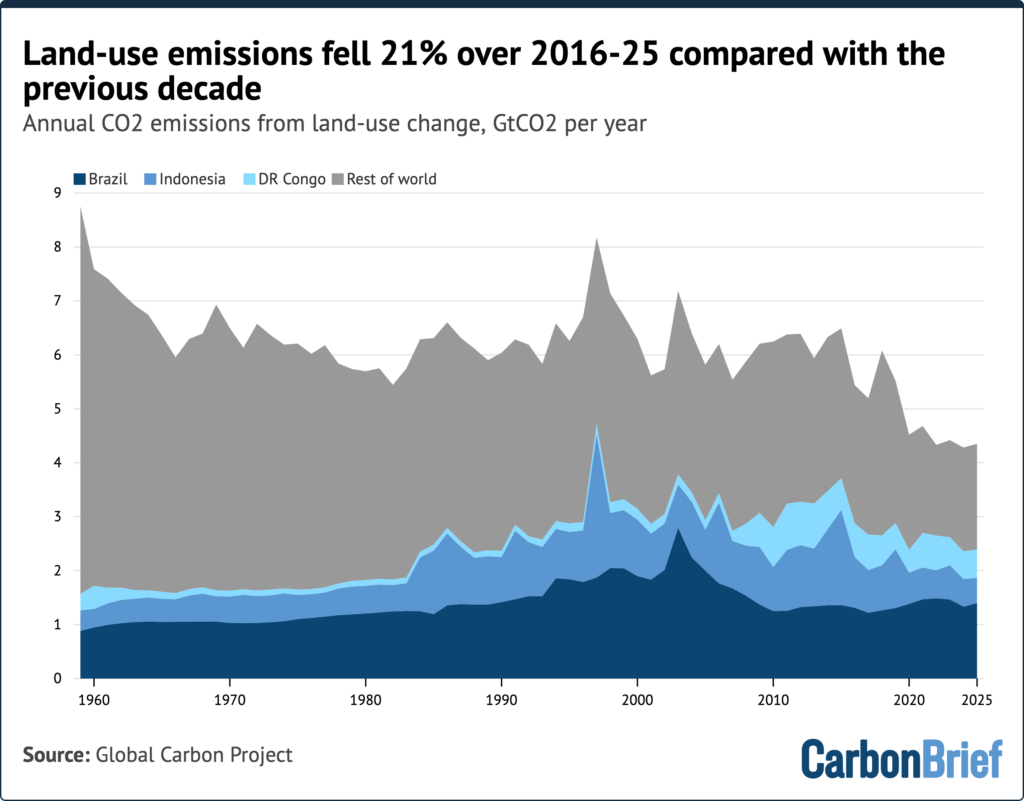
Net land-use emissions averaged 4.9GtCO2 per year over 2016-25, down from 6.2GtCO2 per year over 2006-15, marking a decline of around 21%. This decline holds across all three of the “bookkeeping” models used by the Global Carbon Project to track land-use emissions.
(For more on trends in global land-use emissions and how they are calculated, see Carbon Brief’s explainer.)
Land-use emissions are projected to rise to 5.1GtCO2 in 2026, up from 4.4GtCO2 in 2025.
The report attributes the increase to peat fires, almost all ignited by people, and forest degradation in south-east Asia due to drier conditions associated with El Niño.
Uncertainties in land-use emissions are much higher than for fossil emissions given the challenges in tracking them.
While 2026 shows a nominal increase, it is only slightly above the average over the past decade.
Brazil, the Democratic Republic of the Congo (DRC) and Indonesia together accounted for 2.6GtCO2 of land-use emissions per year over 2015-25, or around 54% of the global total.
The figure below shows how land-use emissions for these three countries and the rest of the world have changed since 1960.
Fossil emissions fall in most major economies
Global fossil CO2 emissions are projected to fall by around 0.4% in 2026. However, challenges associated with precisely measuring and projecting 2026 means this could end up anywhere between a 1.5% decline and a 0.6% increase.
The figure below provides a breakdown of fossil emissions over time by major country and region, including China, the US, the EU, India and the rest of the world.
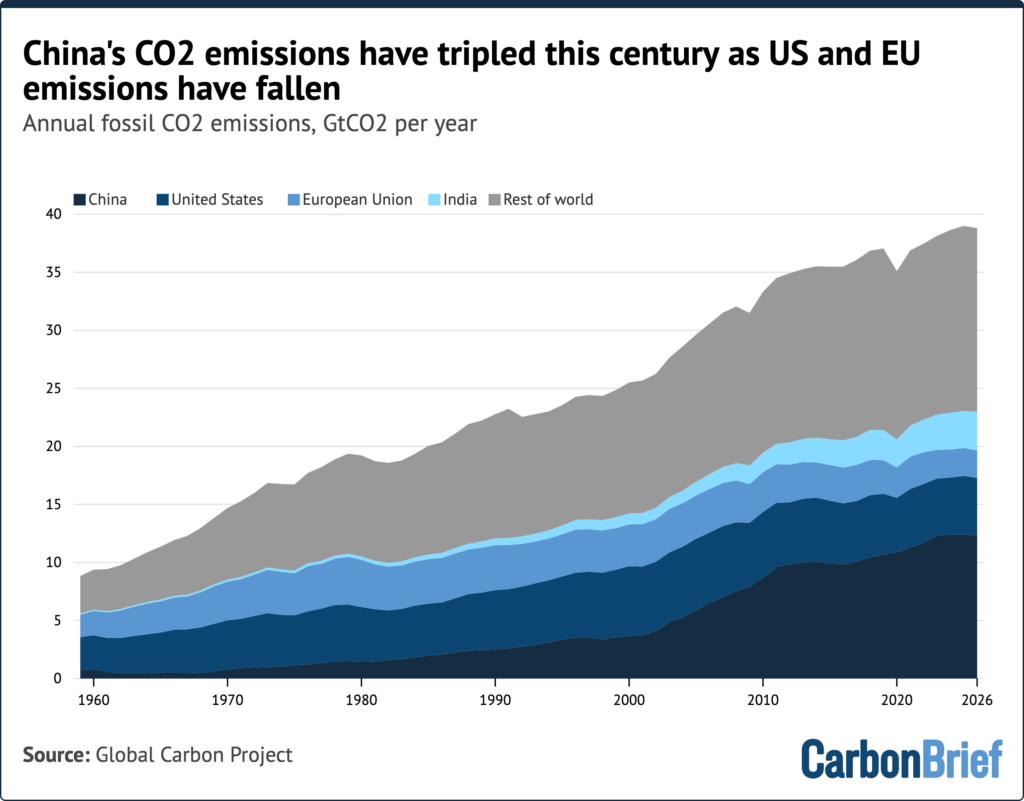
The global carbon budget report sets out the following projections for 2026 in major economies:
| Country, region or sector | Percentage of global emissions | 2026 emissions projection |
| China | 32% | China is projected to see emissions fall by 0.9% (with a range of -2.6% to +0.8%), after two years of low growth.
Oil emissions fall sharply by 4.6%, gas falls 0.9% and coal rises only slightly by 0.3%. The report attributes this to strong growth in renewables and milder summer temperatures than 2025’s record highs, which reduced demand for cooling. This is in line with Carbon Brief analysis showing that China’s emissions fell in the second quarter of 2026 as oil use dropped, though it remains too early to determine if this decline reflects a peaking of emissions. |
| US | 13% | The US is projected to see a 1.3% decline (-3.4% to +0.8%), mainly due to a 6.7% fall in coal emissions after an unusual rise in 2025 driven by high gas prices and cold weather. Oil fell 1.1%, while gas increased by 0.5%. |
| India | 8% | India is projected to see emissions rise by 4.4% (+1.7% to +7.1%), which is higher than its average growth of 3.5% per year over the past decade. Coal rises 5.9%, while oil emissions fall slightly by -0.9%. |
| EU | 6% | The EU is projected to see a 1.5% decline (-4.0% to +0.9%), with coal down 2.9% and oil down 1.8%. |
| Japan | 2.5% | Japan is projected to see a 1.0% decline, continuing a trend as transport is electrified, its population ages and nuclear power stations come back online. |
| International aviation and shipping | 3% | International aviation and shipping are each projected to fall by 1%, partly due to reduced air and sea traffic in the Middle East. |
| Rest of world | 38% | The rest of the world is projected to see a 0.7% decline (-2.9% to +1.5%), mostly from oil, which the report links to high prices and supply constraints. |
The figure below shows how each country or region contributed to changes in global fossil emissions in each year between 2023 and 2026.
A growing number of countries are cutting emissions while growing their economies.
The report finds that 40 countries, together accounting for 26% of global fossil emissions, significantly reduced their emissions while their economies grew over 2016-25. This compares with 22 countries in the previous decade.
Oil emissions fall as coal emissions slightly increase
Coal accounts for around 41% of global fossil CO2 emissions in 2026, oil 33% and gas 21%. Cement accounts for around 2%, after the carbonation sink is subtracted.
Oil is the main driver of the decline in global fossil emissions in 2026. Oil emissions are projected to fall by 1.9% (with a range of -2.6% to -1.2%), or 243m tonnes of CO2 (MtCO2).
The left panel of the figure below shows that this is one of the largest annual falls in the record, with the exception of 2020 during the Covid-19 pandemic. Other large declines occurred during the global financial crisis in 2009 and in the dissolution of the Soviet Union in 1992.
The chart on the right shows how oil emissions are projected to fall in every major region in 2026.
The global carbon budget links most of the oil decline to higher prices and reductions in output after the Iran conflict resulted in the closure of the strait of Hormuz.
Petrol and diesel prices in the US, China and EU were 10-50% higher than in 2025, depending on the fuel and the period.
A study published in parallel by the team behind the global carbon budget reveals that growth in EVs accounted for around a fifth of the overall drop in oil emissions in 2026.
This is consistent with Carbon Brief analysis published in September that estimated that global fossil-fuel emissions were set to fall in 2026 amid the Hormuz crisis.
By contrast, coal emissions are projected to rise by 0.6% (-0.6% to +1.7%), with a strong increase in emissions in India partly offset by sharp falls in the EU and US.
Gas emissions, meanwhile, are projected to fall by 0.3% (-1.6% to +0.9%) – making them effectively flat.
The figure below shows global emissions by fuel since 1959.
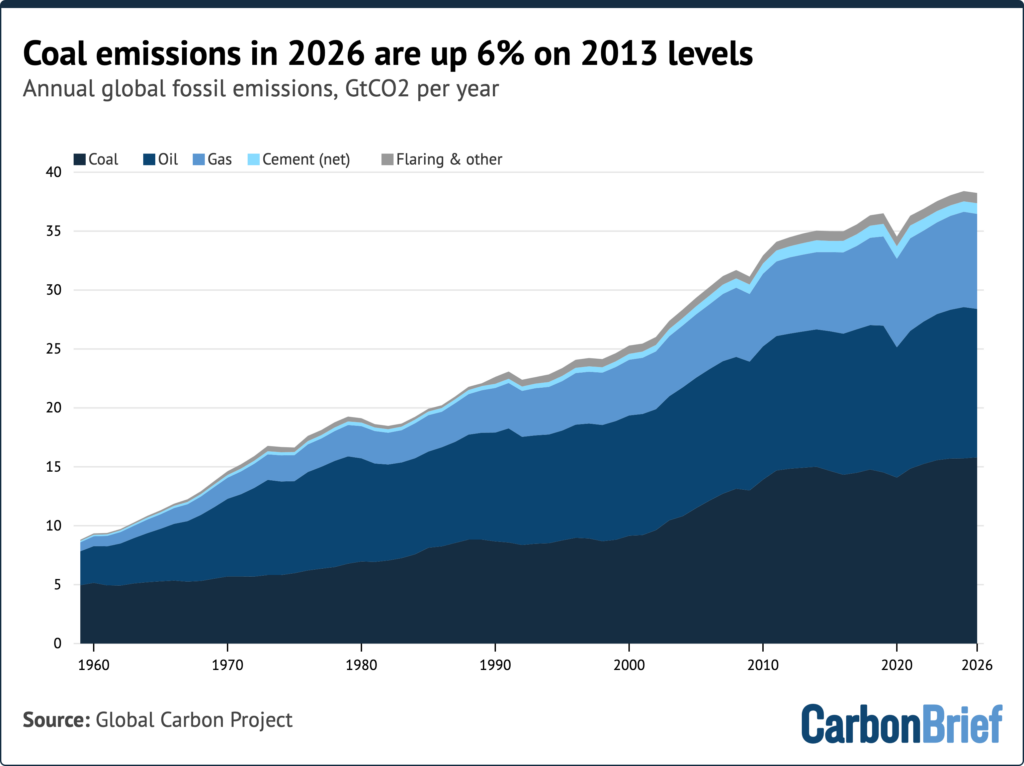
Coal emissions grew rapidly in the 2000