

The “wealthiest 10%” of people on the planet are “responsible” for 65% of the 0.61C increase in global average temperatures over 1990-2020, according to new research.
The study, published in Nature Climate Change, uses a field of climate science called “attribution” to determine the contribution of the world’s “wealthiest population groups” to climate change through the greenhouse gases they emit.
The authors also calculate the contribution of these high-income groups to the increasing frequency of heatwaves and droughts.
For example, the study finds the wealthiest 10% of people – defined as those who earn at least €42,980 (£36,605) per year – contributed seven times more to the rise in monthly heat extremes around the world than the global average.
In another finding, the Amazon rainforest faced a threefold increase in the likelihood of droughts over the period studied, most of which was driven by the wealthiest 10% of the world’s population.
The authors also explore country-level emissions, finding that from the wealthiest 10% in the US produced the emissions that caused a doubling in heat extremes across “vulnerable regions” globally.
One scientist not involved in the study tells Carbon Brief that efforts to attribute global warming to individual income groups is an “important step towards targeted policies” and could support climate litigation.
Emissions inequality
Humans emit more than 40bn tonnes of CO2 into the atmosphere every year. Developed countries are responsible for the majority of global emissions, as a result of the typically more carbon-intensive lifestyles of their residents.
Meanwhile, the most severe impacts of climate change are disproportionately felt by the poorest and most vulnerable people.
The new study uses an income and wealth inequality dataset from the World Inequality Database to track inequality over 1990-2019, showing how much the world’s wealthiest 10%, 1% and 0.1% of society have contributed to warming over 1990-2020. (For details on the method, see the modelling inequalities section below.)
The world’s wealthiest 10% all earn more than €42,980 (£36,605) per year, according to the database. Meanwhile, the world’s wealthiest 0.1% earn more than €537,770 (£458,011) per year.
Of the 0.61C increase in global average temperatures over 1990-2020, the authors estimate that 65% was due to the emissions of the wealthiest 10% of people on the planet. For the wealthiest 0.1%, the estimate is 8%.
The graph below shows how much global temperatures would have risen over 1990-2020 if everyone in the world emitted as much as the world’s poorest 50% (purple), middle 40% (green), richest 10% (orange), richest 1% (blue) and richest 0.1% (pink) people. The grey bar shows how much global temperatures actually rose.

How global temperatures would have risen if everyone in the world emitted the world produced the same amount of emissions, on average, as individuals in the bottom 50% (purple), middle 40% (green), top 10% (orange), top 1% (blue) and top 0.1% (pink) of the world’s emitters. Source: Schöngart et al (2025).
The authors find that if the whole world had emitted as much as the wealthiest 10% of people over 1990-2020, global average temperatures would have risen by 2.9C, instead of 0.61C. If the global population had emissions as large as the wealthiest 0.1%, temperatures would have risen by 12.2C.
Meanwhile, the study calculates that if the whole world had emissions as low as the poorest 50%, global temperatures would have remained close to 1990 levels.
Hot and dry extremes
As greenhouse gas emissions cause the climate to warm, extreme weather events such as heatwaves and droughts are becoming more intense, frequent and long-lasting.
The authors use attribution – a field of climate science that aims to identify the “fingerprint” of global warming on these events – to determine the contribution of the emissions of the world’s wealthiest people to the increasing frequency of heatwaves and droughts.
The authors assess “extremely hot” and “extremely dry” months, defined as the most extreme 1% of months in a pre-industrial climate during the hottest month of the year regionally. (In a pre-industrial climate, only one of each extreme would be expected every 100 years on average.)
The graphs below show the number of additional heatwaves (left) and droughts (right) that have occurred since 1990 due to climate change in different regions of the world.
The full bar shows the total number of additional heatwaves due to human-cased climate change in each region. The green bar shows additional occurrences due to the wealthiest 1%. The green and orange bars combined show the wealthiest 10%.
The numbers in green and orange show how much the wealthiest 1% and 10% of the planet contributed to the extreme, compared to the global average. (For example, an orange number of 7.0 means that the wealthiest 10% of people contributed seven times more to the extreme event than the global average.)

The study finds that an average of 11.5 additional heat events observed in August – the month where the rise in heat extremes is, on average, most pronounced – are attributable to the wealthiest 10%.
It also calculates that emissions from this group resulted in, on average, an additional 2.3 droughts in the Amazon in October – the month with the strongest attributable drying trend in the region.
Highest emitters
The authors also assess the contributions of the wealthiest people to climate extremes on a country level, identifying the US, the EU, China and India as the world’s four highest emitting regions.
The graphic below shows the increase in frequency of one-in-100 year peak summer heat extremes in selected regions attributable to the wealthiest 10% of people (left) and 1% of people (right) in China (red), the US (pink), the EU (peach) and India (blue).
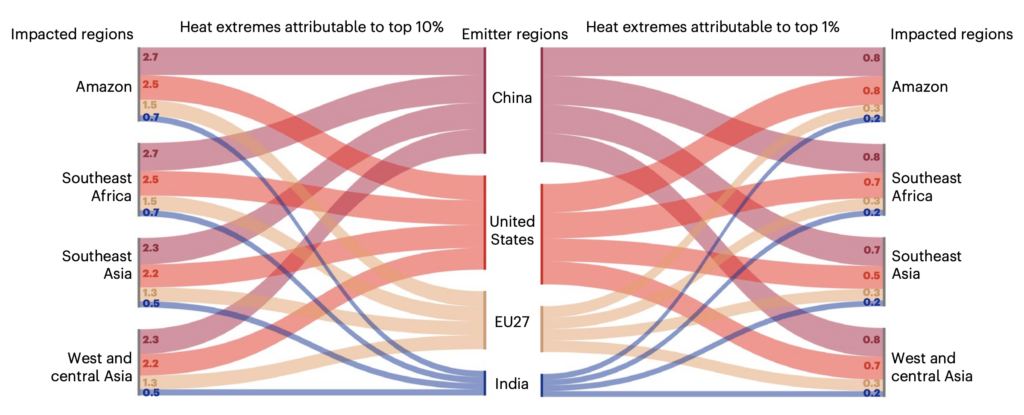
Emissions from the wealthiest 10% in the US resulted in an average of 1.3 extra heat events globally, the authors find. However, this increase is distributed unevenly across the globe.
For example, the authors find this income group was responsible for the emissions that contributed to 2.7 additional heat events in “heat-affected areas” such as the Amazon and south-east Africa.
Emissions from the wealthiest 10% of people in the EU resulted in an additional 1.5 heatwaves in both the Amazon and south-east Africa.
Meanwhile, the Amazon faces 2.1 more heat extremes in 2020 than in 1990 due to the emissions of the richest 1% in the US, China, EU and India.
While inequalities between one country or region and another are well documented, it should also be noted that “inequalities within developing countries are increasing”, Dr Carl Schleussner, study author and leader of the integrated climate impacts research group at the International Institute for Applied Systems Analysis (IIASA), tells Carbon Brief.
For example, he notes that the paper shows “very high levels” of emissions from “the Chinese middle and upper classes”.
However, he says that many existing global frameworks to address climate change “treat countries as a whole” and fail to “differentiate” between income groups within countries.
Schleussner argues that the study highlights the need for “progressive policies” for climate action, which involve “tackling particularly high emitters” in all countries.
Dr Sarah Schöngart, a researcher at ETH Zurich and lead author of the study, tells Carbon Brief that studies such as this could provide important evidence in loss and damage litigation.
Prof Jakob Zscheischler, an Earth system scientist at the Helmholtz Centre for Environmental Research who was not involved in the study, also highlights the ways the findings could be used in climate-change lawsuits. He tells Carbon Brief:
“Quantifying the contribution of individual income groups to global warming and changes in climate extremes is an important step towards targeted policies and further supports climate litigation. Supporting climate injustice with concrete numbers will hopefully help the most vulnerable and least responsible strengthen their case.”
Modelling inequalities
The study uses a range of methods to attribute changes in heat and drought to the emissions of particular wealth groups. To model global greenhouse gas emissions by wealth group, the paper uses a “wealth-based carbon inequality assessment” from a 2022 study.
(See Carbon Brief’s coverage of the 2022 study.)
The study uses income and wealth inequality dataset from the World Inequality Database to track inequality over 1990-2019. It combines economic data with information on per-capita carbon footprints – calculated using “input-output” methodologies combined with data from the “distributional national accounts” project.”
The model considers three factors. The first is private consumption – made up of emissions from the direct use of fossil fuels and emissions embedded into goods and services. The second includes emissions from government spending in that person’s country – such as government administration, public roads or defence. The final component of a person’s carbon footprint is from their investments.
The authors then created a series of “counterfactual” emissions pathways, which imagine the world without the emissions of the wealthiest 10%, 1% and 0.1% of society, respectively. The emissions pathways include CO2, methane and nitrous oxide emissions, expressed as CO2-equivalent.
Lead author Schöngart tells Carbon Brief that including methane in the models is important, because it has “really high potency and near-term warming”. However, she notes that the team needed to make some assumptions about methane emissions – for example, assuming that each income group emits the same relative amount of methane compared to other greenhouse gas emissions.
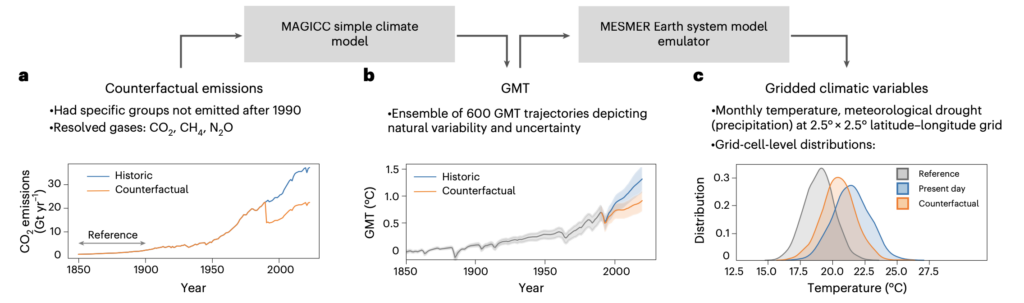
Using a “simple” climate model called MAGICC, the authors model global average temperatures under these counterfactual emissions pathways. This allows them to calculate how much the planet would have warmed over 1990-2020 without the emissions of the 10%, 1% and 0.1% of society, respectively.
The authors use the global average temperature trends to produce temperature and rainfall data for every land-based grid square on Earth via a climate model emulator called MESMER.
Schöngart tells Carbon Brief that an emulator is “an approximation of an Earth system model” which “allows us to generate incredible amounts of data”, while using less computing power and taking less time to run.
The study authors then use attribution methods to identify how the emissions from the world’s wealthiest members of society have affected the frequency of heatwaves and droughts, by comparing the world as it is to a “counterfactual” world without human-caused climate change.
The graphic below shows these steps.
Earth system scientist Zscheischler praises the methods in the study. He tells Carbon Brief that “the main innovation of work lies in its novel combination of relatively simple emulators that capture the most important relationships between emissions and global warming and changes in extremes”.
He adds that emulators have been evaluated in other studies and are “trustworthy for this type of delicate analysis”.
Prof Wim Thiery – an associate professor at Vrije Universiteit Brussel, who was not involved in the study – also commends the use of emulators. He tells Carbon Brief that “producing the information presented in this study with a suite of full-blown Earth system models is impossible from a computational cost and human effort perspective”.

The post Two-thirds of global warming since 1990 caused by world’s ‘wealthiest 10%’ appeared first on Carbon Brief.
Two-thirds of global warming since 1990 caused by world’s ‘wealthiest 10%’

Drought and heatwaves occurring together – known as “compound” events – have “surged” across the world since the early 2000s, a new study shows.
Compound drought and heat events (CDHEs) can have devastating effects, creating the ideal conditions for intense wildfires, such as Australia’s “Black Summer” of 2019-20 where bushfires burned 24m hectares and killed 33 people.
The research, published in Science Advances, finds that the increase in CDHEs is predominantly being driven by events that start with a heatwave.
The global area affected by such “heatwave-led” compound events has more than doubled between 1980-2001 and 2002-23, the study says.
The rapid increase in these events over the last 23 years cannot be explained solely by global warming, the authors note.
Since the late 1990s, feedbacks between the land and the atmosphere have become stronger, making heatwaves more likely to trigger drought conditions, they explain.
One of the study authors tells Carbon Brief that societies must pay greater attention to compound events, which can “cause severe impacts on ecosystems, agriculture and society”.
Compound events
CDHEs are extreme weather events where drought and heatwave conditions occur simultaneously – or shortly after each other – in the same region.
These events are often triggered by large-scale weather patterns, such as “blocking” highs, which can produce “prolonged” hot and dry conditions, according to the study.
Prof Sang-Wook Yeh is one of the study authors and a professor at the Ewha Womans University in South Korea. He tells Carbon Brief:
“When heatwaves and droughts occur together, the two hazards reinforce each other through land-atmosphere interactions. This amplifies surface heating and soil moisture deficits, making compound events more intense and damaging than single hazards.”
CDHEs can begin with either a heatwave or a drought.
The sequence of these extremes is important, the study says, as they have different drivers and impacts.
For example, in a CDHE where the heatwave was the precursor, increased direct sunshine causes more moisture loss from soils and plants, leading to a drought.
Conversely, in an event where the drought was the precursor, the lack of soil moisture means that less of the sun’s energy goes into evaporation and more goes into warming the Earth’s surface. This produces favourable conditions for heatwaves.
The study shows that the majority of CDHEs globally start out as a drought.
In recent years, there has been increasing focus on these events due to the devastating impact they have on agriculture, ecosystems and public health.
In Russia in the summer of 2010, a compound drought-heatwave event – and the associated wildfires – caused the death of nearly 55,000 people, the study notes.

The record-breaking Pacific north-west “heat dome” in 2021 triggered extreme drought conditions that caused “significant declines” in wheat yields, as well as in barley, canola and fruit production in British Columbia and Alberta, Canada, says the study.
Increasing events
To assess how CDHEs are changing, the researchers use daily reanalysis data to identify droughts and heatwaves events. (Reanalysis data combines past observations with climate models to create a historical climate record.) Then, using an algorithm, they analyse how these events overlap in both time and space.
The study covers the period from 1980 to 2023 and the world’s land surface, excluding polar regions where CDHEs are rare.
The research finds that the area of land affected by CDHEs has “increased substantially” since the early 2000s.
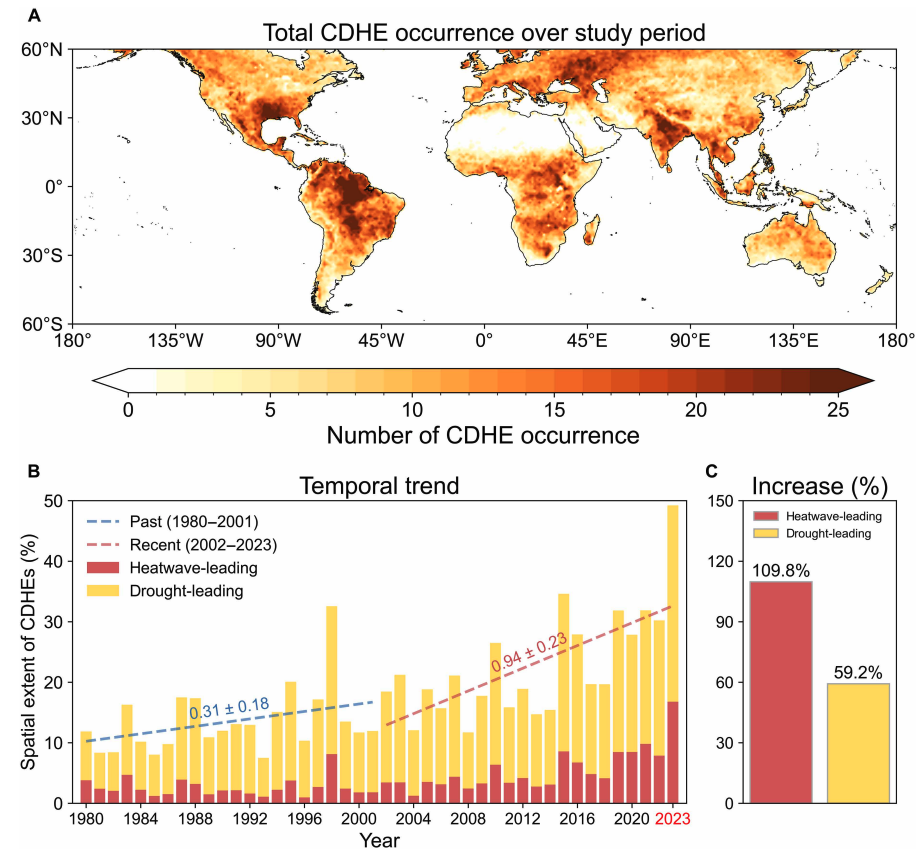
Heatwave-led events have been the main contributor to this increase, the study says, with their spatial extent rising 110% between 1980-2001 and 2002-23, compared to a 59% increase for drought-led events.
The map below shows the global distribution of CDHEs over 1980-2023. The charts show the percentage of the land surface affected by a heatwave-led CDHE (red) or a drought-led CDHE (yellow) in a given year (left) and relative increase in each CDHE type (right).
The study finds that CDHEs have occurred most frequently in northern South America, the southern US, eastern Europe, central Africa and south Asia.
Threshold passed
The authors explain that the increase in heatwave-led CDHEs is related to rising global temperatures, but that this does not tell the whole story.
In the earlier 22-year period of 1980-2001, the study finds that the spatial extent of heatwave-led CDHEs rises by 1.6% per 1C of global temperature rise. For the more-recent period of 2022-23, this increases “nearly eightfold” to 13.1%.
The change suggests that the rapid increase in the heatwave-led CDHEs occurred after the global average temperature “surpasse[d] a certain temperature threshold”, the paper says.
This threshold is an absolute global average temperature of 14.3C, the authors estimate (based on an 11-year average), which the world passed around the year 2000.
Investigating the recent surge in heatwave-leading CDHEs further, the researchers find a “regime shift” in land-atmosphere dynamics “toward a persistently intensified state after the late 1990s”.
In other words, the way that drier soils drive higher surface temperatures, and vice versa, is becoming stronger, resulting in more heatwave-led compound events.
Daily data
The research has some advantages over other previous studies, Yeh says. For instance, the new work uses daily estimations of CDHEs, compared to monthly data used in past research. This is “important for capturing the detailed occurrence” of these events, says Yeh.
He adds that another advantage of their study is that it distinguishes the sequence of droughts and heatwaves, which allows them to “better understand the differences” in the characteristics of CDHEs.
Dr Meryem Tanarhte is a climate scientist at the University Hassan II in Morocco, and Dr Ruth Cerezo Mota is a climatologist and a researcher at the National Autonomous University of Mexico. Both scientists, who were not involved in the study, agree that the daily estimations give a clearer picture of how CDHEs are changing.
Cerezo-Mota adds that another major contribution of the study is its global focus. She tells Carbon Brief that in some regions, such as Mexico and Africa, there is a lack of studies on CDHEs:
“Not because the events do not occur, but perhaps because [these regions] do not have all the data or the expertise to do so.”
However, she notes that the reanalysis data used by the study does have limitations with how it represents rainfall in some parts of the world.
Compound impacts
The study notes that if CDHEs continue to intensify – particularly events where heatwaves are the precursors – they could drive declining crop productivity, increased wildfire frequency and severe public health crises.
These impacts could be “much more rapid and severe as global warming continues”, Yeh tells Carbon Brief.
Tanarhte notes that these events can be forecasted up to 10 days ahead in many regions. Furthermore, she says, the strongest impacts can be prevented “through preparedness and adaptation”, including through “water management for agriculture, heatwave mitigation measures and wildfire mitigation”.
The study recommends reassessing current risk management strategies for these compound events. It also suggests incorporating the sequences of drought and heatwaves into compound event analysis frameworks “to enhance climate risk management”.
Cerezo-Mota says that it is clear that the world needs to be prepared for the increased occurrence of these events. She tells Carbon Brief:
“These [risk assessments and strategies] need to be carried out at the local level to understand the complexities of each region.”



The post Heatwaves driving recent ‘surge’ in compound drought and heat extremes appeared first on Carbon Brief.
Heatwaves driving recent ‘surge’ in compound drought and heat extremes
Greenhouse Gases
DeBriefed 6 March 2026: Iran energy crisis | China climate plan | Bristol’s ‘pioneering’ wind turbine
Welcome to Carbon Brief’s DeBriefed.
An essential guide to the week’s key developments relating to climate change.
This week
Energy crisis
ENERGY SPIKE: US-Israeli attacks on Iran and subsequent counterattacks across the Middle East have sent energy prices “soaring”, according to Reuters. The newswire reported that the region “accounts for just under a third of global oil production and almost a fifth of gas”. The Guardian noted that shipping traffic through the strait of Hormuz, which normally ferries 20% of the world’s oil, “all but ground to a halt”. The Financial Times reported that attacks by Iran on Middle East energy facilities – notably in Qatar – triggered the “biggest rise in gas prices since Russia’s full-scale invasion of Ukraine”.
‘RISK’ AND ‘BENEFITS’: Bloomberg reported on increases in diesel prices in Europe and the US, speculating that rising fuel costs could be “a risk for president Donald Trump”. US gas producers are “poised to benefit from the big disruption in global supply”, according to CNBC. Indian government sources told the Economic Times that Russia is prepared to “fulfil India’s energy demands”. China Daily quoted experts who said “China’s energy security remains fundamentally unshaken”, thanks to “emergency stockpiles and a wide array of import channels”.
‘ESSENTIAL’ RENEWABLES: Energy analysts said governments should cut their fossil-fuel reliance by investing in renewables, “rather than just seeking non-Gulf oil and gas suppliers”, reported Climate Home News. This message was echoed by UK business secretary Peter Kyle, who said “doubling down on renewables” was “essential” amid “regional instability”, according to the Daily Telegraph.
China’s climate plan
PEAK COAL?: China has set out its next “five-year plan” at the annual “two sessions” meeting of the National People’s Congress, including its climate strategy out to 2030, according to the Hong Kong-based South China Morning Post. The plan called for China to cut its carbon emissions per unit of gross domestic product (GDP) by 17% from 2026 to 2030, which “may allow for continued increase in emissions given the rate of GDP growth”, reported Reuters. The newswire added that the plan also had targets to reach peak coal in the next five years and replace 30m tonnes per year of coal with renewables.
ACTIVE YET PRUDENT: Bloomberg described the new plan as “cautious”, stating that it “frustrat[es] hopes for tighter policy that would drive the nation to peak carbon emissions well before president Xi Jinping’s 2030 deadline”. Carbon Brief has just published an in-depth analysis of the plan. China Daily reported that the strategy “highlights measures to promote the climate targets of peaking carbon dioxide emissions before 2030”, which China said it would work towards “actively yet prudently”.
Around the world
- EU RULES: The European Commission has proposed new “made in Europe” rules to support domestic low-carbon industries, “against fierce competition from China”, reported Agence France