

Nickel has moved from being a niche industrial metal to a critical pillar of the global energy transition, along with copper, lithium, and uranium.
Once primarily used in stainless steel, nickel is now critical for high-energy-density batteries, electric vehicles (EVs), grid storage, aerospace alloys, and emerging hydrogen infrastructure.
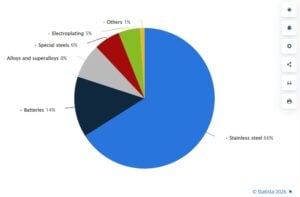
Essentially, it’s now another mineral on that list, albeit one that seems to have largely flown under most investors’ radars thus far. However, it’s understandable why that’s been the case – after all, the primary use for mined nickel has long been industrial, with over three-quarters of global nickel demand being for things like alloy production or electroplating.
Distribution of primary nickel consumption worldwide in 2024, by industry
Nickel Basics: Types, Grades, and Industrial Uses
Nickel is a silvery-white transition metal with high corrosion resistance, ductility, and thermal stability. Its unique properties make it indispensable in alloys and electrochemical applications.
Nickel is generally classified into two main categories:
- Class 1 nickel: High-purity nickel metal, powders, briquettes, and salts such as nickel sulfate. These are essential for battery cathodes, advanced alloys, and aerospace applications.
- Class 2 nickel: Ferronickel and nickel pig iron (NPI), primarily used in stainless steel production.
Historically, stainless steel accounted for roughly two-thirds of nickel consumption, providing a stable demand base. However, batteries have emerged as the fastest-growing segment, particularly for nickel-rich cathode chemistries such as NMC (nickel-manganese-cobalt) and NCA (nickel-cobalt-aluminum).
Aerospace, defense, and superalloys also rely heavily on nickel for high-temperature and corrosion-resistant applications.
This dual-market nature—spanning bulk industrial use and high-tech energy transition applications—makes nickel one of the most structurally complex metals in the critical minerals ecosystem.
Nickel Processing Technologies: The Backbone of the EV and Steel Boom
Not all nickel is equal, and processing technology determines where it ends up. Nickel processing is the set of industrial methods used to extract nickel from its ores and turn it into usable forms for various industries, including stainless steel, batteries, and alloys. Essentially, it’s how raw nickel in rocks becomes the high-purity metal or chemical compounds needed for manufacturing.
Nickel is mined mainly from two types of ores:
- Sulfide ores – Found deep underground, easier to process, high purity.
- Laterite ores – Found near the surface, lower nickel content, more challenging to process.
The Case Of Battery Grade Nickel
In order to be used in an electric vehicle, nickel must first be refined to extremely high purities, creating what’s known as “battery grade” nickel. Following this, it then needs to be dissolved in sulphuric acid to create nickel sulphate, which can then be used to produce battery cathodes.
Nickel’s high energy density, which allows it to hold more charge for less weight, makes high-nickel battery chemistries more desirable in EV batteries. While the first iterations of the lithium-ion battery used equal proportions of nickel, manganese, and cobalt, modern ones use as much nickel as manganese and cobalt combined.
And as technology continues to progress, it’s expected that the ratio will rise to as much as 80% nickel, or even more.
Now here’s a simple breakdown of the processing technologies:
Pyrometallurgy Still Dominates Stainless Steel
High-temperature smelting remains the most common route for nickel extraction. Rotary kiln–electric furnace (RKEF) and flash smelting convert sulfide and laterite ores into ferronickel or nickel pig iron (NPI). These products suit stainless steel, but they consume large amounts of energy and emit significant CO₂.
Notably, NPI and ferronickel continue to anchor global supply.
Hydrometallurgy Powers Battery-Grade Nickel
Hydrometallurgical routes, especially high-pressure acid leaching (HPAL), are becoming critical for EV batteries. HPAL converts laterite ores into mixed hydroxide precipitate (MHP) and then into nickel sulfate for cathodes.
Refining and Recycling Gain Momentum
Electrorefining and solvent extraction deliver high-purity Class 1 nickel. Refined products made up around 60% of the nickel market in 2024. Recycling is also rising as a low-carbon supply source.
In short, nickel processing is splitting into two markets: low-cost NPI for steel and high-purity nickel for batteries. This divide is reshaping supply chains, investment flows, and decarbonization strategies across the metals industry.
The Volatile Nickel Price Cycle
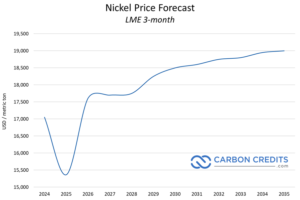
Unlike lithium, the nickel market is much more complex. The metal sits at the crossroads of geopolitics, industrial demand, and changing battery technology. Over the past five years, nickel prices have been highly volatile.
For example, during the 2022 LME squeeze, prices spiked above $100,000 per tonne. Then they dropped sharply to around $13,900 per tonne in early 2025.
- Since then, they have started to recover, reaching about $17,200 per tonne by February 2026.
This volatility shows how sensitive nickel is to supply, demand, and global events. As EV demand grows, the nickel market will continue to face swings.
This volatility reflects a structural mismatch between supply expansion and shifting demand patterns. Massive Indonesian production growth has flooded the market, while battery chemistry trends toward lithium iron phosphate (LFP) have reduced nickel intensity in mass-market EVs. At the same time, premium EVs and aerospace applications continue to rely heavily on Class 1 nickel, creating a bifurcated market structure.
For investors, policymakers, and corporates, nickel represents a critical test case for the energy transition economy. Understanding its supply chain, macro drivers, and long-term price scenarios is essential for navigating the next decade of critical minerals markets.
Global Nickel Supply: Indonesia’s Dominance and Market Impact
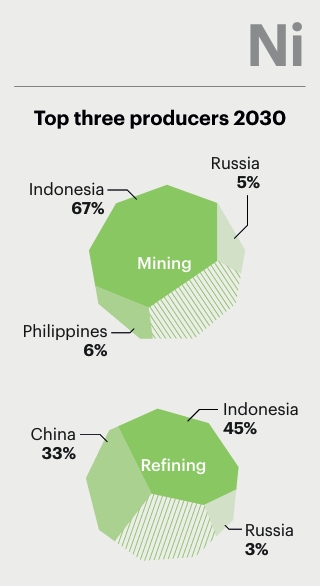
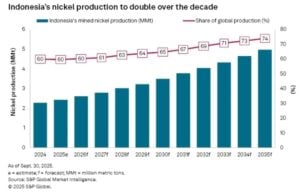
Indonesia has reshaped the global nickel market more than any other country. In 2024, its nickel in mine production was 2.2 million tonnes (mt), an increase of 158% over the previous five years. Its rise was fueled by a combination of raw-ore export bans, massive Chinese-backed investments in downstream processing, and the rapid deployment of high-pressure acid leach (HPAL) facilities for battery-grade nickel.
By consolidating both mining and smelting, Indonesia has established a vertically integrated nickel ecosystem capable of supplying both stainless steel and battery markets at low cost.
Policy Controls and Quota Management
Despite its dominance, Indonesia’s nickel supply faces tightening government controls in 2026. The government sharply reduced the nickel ore production quota (RKAB) to 250–260 million wet metric tonnes (wmt), down from 379 million wmt in 2025 and 298 million wmt initially approved for 2025—a cut of roughly 34%.
The move aims to align ore output with domestic smelter capacity, curb oversupply, and support prices. Following the announcement, LME nickel prices surged past $18,000/t before stabilizing near $17,200/t in February 2026.
Delays in RKAB approvals have already halted operations at mines such as PT Vale Indonesia, signaling enforcement risks for the policy. Meanwhile, demand growth is tempered by slower stainless steel uptake and the structural shift toward LFP batteries, which has helped sustain a global surplus forecast of 261–288 kt in 2026 despite production cuts.
Indonesia’s strategic approach—resource nationalism, controlled expansion, and downstream integration—has fundamentally altered global nickel pricing. Low production costs and government-backed industrial policy allow Indonesian producers to remain profitable even during periods of weak prices.
- However, S&P Global noted that, “Indonesia is still projected to more than double its production over the next decade to an estimated 4.97 MMt by 2035.”
China’s Role in the Nickel Supply Chain
China continues to dominate the processing of nickel intermediates and battery materials. Chinese firms have financed and built much of Indonesia’s upstream infrastructure, including HPAL plants and mixed hydroxide precipitate (MHP) facilities.
It is also the single largest consumer of nickel, driven by domestic stainless steel production and battery manufacturing. Policy shifts, stimulus measures, and industrial planning decisions in China have an outsized impact on global nickel markets, influencing both price and supply chain dynamics.
Other Global Producers
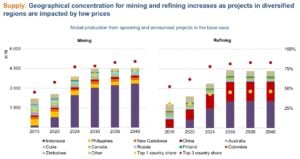
Beyond Indonesia and China, major nickel-producing countries include Russia, the Philippines, Canada, Australia, and New Caledonia. However, many high-cost producers have struggled to compete with Indonesia’s integrated, low-cost production model. For example, BHP suspended operations at its Nickel West facility in Western Australia amid persistent low prices, highlighting the competitive pressures faced by high-cost producers.
This dynamic has accelerated consolidation in the global nickel industry, with strategic repositioning focused on securing downstream processing and high-grade nickel for energy transition applications.
Nickel Demand Dynamics: Stainless Steel vs. Batteries
Stainless Steel: The Legacy Anchor
Stainless steel remains the primary driver of nickel demand, accounting for roughly two-thirds of consumption. Demand is closely tied to construction, infrastructure, and manufacturing activity. China, the world’s largest stainless steel producer, remains a key macro driver for nickel demand globally.
Class 1 Nickel: Powering the EV Boom
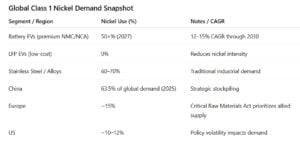
Nickel demand for batteries has grown fast over the past decade. Class 1 nickel, with purity above 99.8%, is key for high-energy NMC and NCA batteries. These batteries power premium EVs, giving longer driving ranges and lighter, more efficient vehicles. Advanced cathodes now contain 60–80% nickel, with some designs targeting 90%+ nickel content.
By 2030, nickel-heavy batteries could reach 1,320 MWh globally, covering about 80% of all EV lithium-ion batteries. Battery demand is expected to use over 50% of Class 1 nickel by 2027, growing at 12–15% per year. The average EV battery now contains 28–30 kg of nickel.
But there are risks:
-
LFP batteries, which contain no nickel, are growing in lower-cost EVs, especially in China. Nickel intensity per vehicle has fallen nearly one-third since 2020.
-
Policy differences affect supply: China held 63.5% of global nickel demand in 2025, Europe prioritizes allied supply, and US policies are less stable.
The Lights Are Green for Nickel
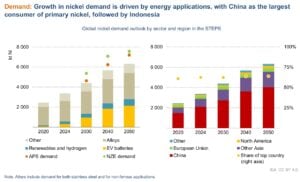
Forecasts from the International Energy Agency (IEA) project nickel demand more than doubling by 2035 under current pledges, potentially tripling in net-zero scenarios driven by EVs and storage.
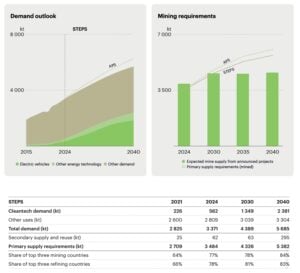
IEA also projects that nickel use in EV batteries, renewables, and stainless steel is projected to push nickel demand above 5.5 Mt by 2035. As Indonesia tightens output and China dominates downstream processing, Western economies face rising exposure to supply disruptions and geopolitical leverage. Even conservative outlooks show 8-9x EV battery demand growth by 2050, despite late-decade plateaus from chemistry shifts.
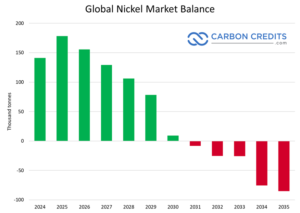
Long-Term Supply Outlook: From Oversupply to Potential Deficit
As per INSG last year, supply vastly outpaced demand, hitting 209-212 kt global surplus. Recently, S&P Global projected a 156,000-tonne surplus in 2026. However, the same analysis also says that today’s surplus will not last forever.
The report projects that global nickel stocks will peak around 2028. After that, inventories will begin to fall as demand improves and supply growth slows. By the early 2030s, the market balance will flip.
By 2031, S&P Global expects the primary nickel balance to turn negative. EV battery demand will grow as electrification expands. Stainless steel consumption will recover alongside global manufacturing. Significantly, Indonesian supply growth will slow as easy expansions may run out, and regulatory risks can increase.
Once inventories drop below comfortable weeks-of-consumption levels, prices respond quickly. S&P Global points to nickel prices rising toward $25,000 per tonne or higher, especially for Class 1 material.
Policy and Geopolitics: Resource Nationalism and Market Fragmentation
Indonesia exemplifies modern resource nationalism. The government’s export bans, production quotas, and mine suspensions aim to capture downstream value and stabilize prices.
Western governments are responding with critical minerals strategies, including subsidies, domestic mining support, and restrictions on Chinese supply chains. This could fragment the global nickel market into competing blocs, heightening geopolitical risk for downstream industries.
Most importantly, the Trump administration sees developing U.S. nickel supply chains as key to reducing dependence on foreign sources and boosting the domestic industry. Efforts include promoting new mining projects, speeding up permits for critical mineral operations, and exploring tariffs or other trade measures to support local production. One major example is a copper-nickel project in Minnesota, led by a joint venture between Glencore and Teck Resources.
Macro Drivers: Energy Transition, Industrial Demand, and Monetary Policy
Nickel is highly sensitive to macroeconomic and policy conditions. Industrial demand tracks global manufacturing cycles, while battery demand depends on EV adoption rates, subsidies, and consumer behavior.
Interest rates, inflation, and currency fluctuations affect nickel through speculative flows and production financing costs. Meanwhile, energy transition policies, carbon pricing, and ESG mandates are reshaping supply chains, pushing automakers and battery manufacturers to secure long-term nickel supply agreements.
Nickel’s Role in Carbon Markets and Net-Zero Strategies
Nickel’s importance extends beyond industrial use. Battery supply chains are central to decarbonization, embedding nickel demand in national net-zero strategies. Companies increasingly link nickel sourcing to ESG frameworks, carbon disclosure requirements, and sustainability-linked financing.
At the same time, nickel production drives greenhouse gas (GHG) emissions. According to a disclosure from the International Finance Corporation (World Bank Group), under a scenario accounting for declining ore grades and cleaner grids, emissions could rise 90% from 2020 to 2050. Additionally, a lack of decarbonization could push emissions to 164%.
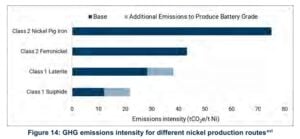
Most emissions come from processing rather than mining. Pyrometallurgical routes for Class 2 nickel (used in stainless steel) are coal-intensive, while Class 1 battery-grade nickel has lower emissions. Shifting to EV-focused, Class 1 production can help limit emissions growth.
Thus, cleaner processing, low-carbon production, and recycling could give automakers and battery makers a competitive edge, while decarbonized electricity is key to controlling nickel emissions as production rises.
Top 3 Nickel Producers Signal Tight Supply Heading into 2026
The global nickel market entered 2026 with cautious signals from its largest producers. Industry analysts revealed that mining output stayed broadly flat, disruptions persisted, and companies focused more on battery-grade processing than expanding supply. This reinforced expectations of a structurally tight nickel market.
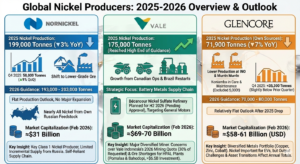
Nornickel
Norilsk Nickel, or Nornickel, reported stable but slightly lower production in 2025. The company produced 199,000 tonnes of nickel, down 3% year-on-year, mainly due to a shift toward lower-grade disseminated ore. Production recovered in the fourth quarter, rising 9% quarter-on-quarter to 58,000 tonnes after scheduled maintenance in Q3. Nearly all nickel came from the company’s own Russian feedstock, highlighting its self-reliant supply chain.
For 2026, Nornickel guided nickel output between 193,000 and 203,000 tonnes, signaling flat production with no major expansion plans. Nornickel’s market capitalization stood at about $31 billion as of February 2026, underscoring its role as a major global supplier despite geopolitical constraints.
The lack of growth from one of the world’s key Class 1 nickel producers suggests limited incremental supply from Russia.
Vale
Brazil’s Vale continued to position itself as a strategic player in the battery metals supply chain. The company plans a nickel sulfate refinery in Bécancour, Québec, with deliveries to General Motors targeted for the second half of 2026, pending regulatory approvals. This move highlighted Vale’s push toward high-purity battery materials rather than bulk nickel mining.
Vale’s market capitalization was around $69–70 billion in early 2026, making it one of the largest diversified miners with significant nickel exposure. It produced 175,000 tonnes of nickel in 2025, reaching the high end of its guidance. Growth came from Canadian operations in Sudbury and Long Harbour and restarts in Brazil.
Looking ahead, Vale Indonesia warned its 2026 mining quota won’t meet demand for new nickel smelters. The approved quota is only about 30% of what the company requested, raising concerns that upcoming processing plants could face ore shortages.
Vale and partners are building three HPAL plants for EV battery nickel. The Pomalaa plant, starting in August 2026, will need 21 million tonnes of limonite ore per year, while Bahodopi will require 10.4 million tonnes annually. These projects represent over $6.5 billion in investment and highlight the growing pressure on Indonesia’s nickel supply.
Glencore
Glencore’s 2025 Full‑Year Production Report showed nickel output from its own sources at 71,900 tonnes, down about 7% from 82,300 tonnes in 2024. This decline was driven by lower production at both Integrated Nickel Operations (INO) and the Murrin Murrin operations. The reported figure excludes 5,000 tonnes from the Koniambo project, which is in care and maintenance.
In the fourth quarter of 2025, nickel production (including third‑party feed) was around 35,300 tonnes, slightly below the prior quarter. Glencore also gave 2026 nickel guidance of 70,000–80,000 tonnes, reflecting a relatively flat outlook after the 2025 drop.
Its nickel business is part of a broader diversified metals portfolio, with the company also producing copper, zinc, cobalt, coal, and other commodities. Nickel remains important to its strategy, especially given rising EV battery demand, but output challenges and asset transitions affected annual totals.
As of February 2026, Glencore’s market capitalization is widely reported to be around $58–61 billion (USD) based on its London Stock Exchange listing and share price.
This positions Glencore as a major diversified mining and commodity trading company, though smaller in market value than some of its peers like Rio Tinto or BHP. The company’s valuation reflects its breadth across metals, energy, and marketing operations, and its prospects are often shaped by commodity price swings and operational performance.
Risks and Opportunities for Investors and Policymakers
The top nickel producers showed limited growth in mining output while accelerating investments in battery-grade processing. Ore quality challenges, regulatory delays, and operational disruptions continued to constrain supply. At the same time, electric vehicle demand and energy transition needs kept rising.
The lack of aggressive supply expansion from major producers suggests the nickel market could remain structurally tight through the late 2020s, especially for high-purity Class 1 nickel required in batteries.
This is why nickel stocks present a unique combination of risks and opportunities. Supply concentration, policy interventions, and technological disruption create price volatility. Conversely, long-term demand from electrification, aviation, and hydrogen infrastructure provides structural upside.
Investors must navigate cyclical price swings, while policymakers balance industrial policy with market stability. Strategic supply agreements, diversification, and technology adoption will be crucial for managing risk.
Conclusion: Nickel’s Strategic Decade Ahead
Nickel is entering a decisive decade. The metal is so vital for the global energy transition, but faces structural uncertainty from supply expansion and evolving battery technology.
The next ten years will determine whether nickel becomes a stable metal of clean energy supply chains or a cautionary case study in commodity oversupply and industrial policy missteps. For institutions, understanding nickel’s macro dynamics, supply chains, and policy risks is essential. The metal’s trajectory will shape not only battery markets but also the geopolitics of the global energy transition.
Live Nickel Spot Price
The post The Ultimate Guide to Nickel: Supply, Demand, and Nickel Prices for 2026 and Beyond appeared first on Carbon Credits.

The U.S. Department of Energy is intensifying efforts to secure critical minerals as global supply risks rise. In a new collaboration, the DOE’s Ames National Laboratory and the Critical Materials Innovation Hub have joined hands with Amazon to recover high-value materials from waste.
The partnership focuses on extracting battery-grade graphite and key minerals from discarded textiles and electronic waste. This move reflects a broader U.S. strategy—reduce import dependence, build domestic capacity, and create a circular supply chain for critical materials.
Assistant Secretary of Energy (EERE) Audrey Robertson, leading DOE’s Office of Critical Materials and Energy Innovation, said:
“At scale, the recovery of critical minerals from end-of-life technologies and textile waste has the potential to transform our domestic critical materials supply chains. This pioneering work, made possible by an exciting new partnership with Amazon, supports the Trump Administration’s efforts to reduce our reliance on foreign imports and strengthen our national security.”
U.S. Aims for Domestic Graphite Supply
The collaboration combines materials science with artificial intelligence. Ames Lab and CMI bring decades of expertise in metals refining and advanced materials. Amazon contributes AI, logistics, and large-scale supply chain capabilities.
Ames Laboratory Director Karl Mueller also noted,
“This is an excellent match for Ames National Laboratory’s deep expertise in materials science. For decades, Ames Lab has led the nation in metals refining, purification, and critical materials research—and applying that strength to real-world challenges.”
Turning Textiles into Battery-Grade Graphite
A major project aims to convert discarded textiles into battery-grade graphite. This is significant because graphite is essential for lithium-ion batteries used in electric vehicles (EVs) and energy storage systems.
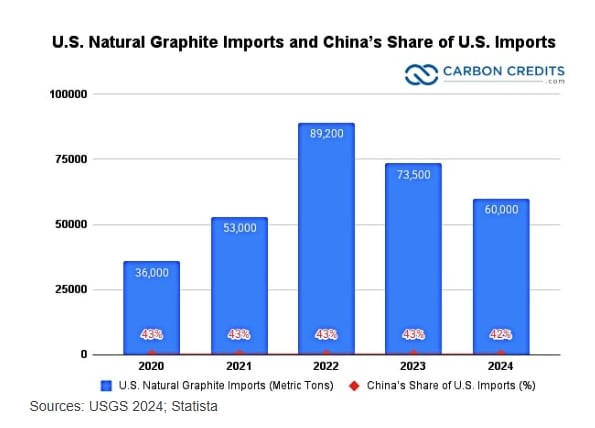
Today, the U.S. remains heavily dependent on imports for graphite. In fact, more than 90% of global battery-grade graphite processing is concentrated in China, creating a major supply risk.
- As of 2024, the U.S. imported about 60,000 metric tons of natural graphite, down from roughly 84,000 tons in 2023.
- China remained the largest supplier, accounting for around 67.6% of all natural graphite imports by value.
This is worth roughly $375 million. It represents a slight decrease in volume but still a dominant share of the market.
By extracting graphite from waste, the U.S. can reduce both landfill pressure and foreign dependence. This approach aligns with the DOE’s push to secure materials from “secondary sources” such as waste streams.
AWS Powers AI-Driven Mineral Recovery
A second initiative focuses on recovering minerals like gallium from end-of-life IT hardware. Gallium is a critical input for semiconductors, power electronics, and defense technologies.
The importance of this effort is clear. In recent years, China has restricted exports of gallium and germanium, disrupting global supply. These restrictions effectively removed up to 90% of global gallium supply from international markets, exposing major vulnerabilities.
Here, Amazon Web Services will deploy AI tools to map supply chains, identify recovery opportunities, and assess economic feasibility. At the same time, CMI researchers will develop efficient extraction and refining methods.
This fusion of AI and materials science could transform recycling. Instead of being discarded, old electronics could become a reliable domestic source of critical minerals.
A Fragile Supply Chain: Why the U.S. Is Acting Now
Critical minerals are the core of modern industries—from EVs and renewable energy to semiconductors and defense systems. However, U.S. supply chains remain highly vulnerable.
According to recent industry analysis:
- The U.S. is 100% import-reliant for at least 13 critical minerals
- Over 20 additional minerals have an import dependence above 50%
- The country exports much of its raw materials for processing overseas due to limited domestic capacity
China dominates refining and processing, backed by decades of industrial policy. This concentration creates risks of supply disruptions, price spikes, and geopolitical leverage.
To address this, the U.S. government is mobilizing large-scale investments. In 2025, the DOE announced nearly $1 billion in funding to strengthen domestic critical mineral supply chains, with a strong focus on battery materials processing and recycling.
Additionally, new initiatives such as strategic stockpiles and international partnerships are being developed to secure long-term supply.
CMI Hub Leads the Shift to Circular Supply Chains
The Amazon–DOE partnership reflects a major shift in strategy. Traditionally, supply security depended on mining new resources. Now, recycling and “urban mining” are becoming equally important.
The CMI Hub is leading this transition through research in:
- Expanding material supply sources
- Developing substitutes for scarce minerals
- Recovering materials from waste
- Accelerating the commercialization of new technologies
Recycling offers several advantages. It is faster to deploy than mining, less environmentally damaging, and often more cost-effective in the long run. For example, the U.S. has already committed funding to advanced graphite recycling projects to build domestic battery supply chains.
CMI Hub Director Tom Lograsso
“This collaboration is a natural extension of the expertise that CMI Hub was created to deliver. CMI’s mission is to move breakthrough materials technologies from the laboratory into real-world applications on timelines that meet industry’s needs. Working with Amazon gives us the opportunity to apply our capabilities at scale—combining CMI’s materials science expertise with Amazon’s AI to turn innovations into practical solutions that strengthen the nation’s critical materials supply chains.”
Public–Private Partnerships Drive Scale
This collaboration also highlights a broader trend—closer ties between government research institutions and private companies.
Amazon brings AI, data analytics, and global logistics. Ames Lab and CMI contribute scientific expertise and research infrastructure. Together, they aim to move solutions from the lab to real-world deployment at scale.
Such partnerships are critical because the challenge is not just technical. It also involves economics, infrastructure, and supply chain coordination. By combining strengths, these collaborations can accelerate innovation and reduce risks.
Conclusion: A Strategic Shift With Global Impact
The U.S. is clearly redefining its critical minerals strategy. Instead of relying only on mining, it is tapping into waste as a new resource base.
This approach offers strong advantages:
- Waste streams are abundant and underutilized
- Recycling reduces environmental impact
- Domestic recovery improves supply security
However, challenges remain. Domestic processing capacity is still limited, and scaling recycling technologies will require sustained investment and policy support.
At the same time, AI is emerging as a key enabler. It can optimize recovery processes, improve efficiency, and reduce costs. As adoption grows, it could become a critical tool in securing mineral supply chains.
And the partnership between the DOE, Ames Lab, CMI, and Amazon marks a turning point in how the U.S. approaches critical minerals.
- READ MORE: DOE Launches $500M Funding Drive to Strengthen U.S. Battery Supply Chains and Critical Minerals Processing
- LATEST: AI Solutions from Microsoft and NVIDIA Power DOE’s Nuclear Energy Genesis Mission • Carbon Credits
The post DOE and Amazon Partner to Secure Critical Minerals Through AI-Driven Recycling appeared first on Carbon Credits.
Carbon Footprint
Google Expands SAF Strategy with Amex GBT and Shell Aviation to Cut Aviation Emissions
Google is stepping up its climate strategy with a deeper commitment to sustainable aviation fuel (SAF). In a new long-term agreement with American Express Global Business Travel and Shell Aviation, the tech giant will source SAF environmental attribute data through the Avelia registry.
This move highlights a bigger trend. Corporations are no longer just offsetting emissions—they are actively shaping clean fuel markets. For Google, SAF is becoming a critical tool to cut emissions from business travel, one of the hardest sectors to decarbonize.
Vrushali Gaud, Global Director of Climate Operations, Google, said:
“Sustainable aviation fuel represents a critical unlock for decarbonizing the hard-to-abate aviation sector and we recognize the importance of long-term agreements to increase demand and expand its availability. We view this as a key opportunity to support the broader ecosystem through this book and claim effort, while making progress towards reducing our own aviation emissions.”
How “Book and Claim” Is Changing the Future of Aviation Fuel
SAF offers a clear advantage. It can reduce lifecycle greenhouse gas emissions by up to 80% compared to traditional jet fuel. That makes it one of the most promising solutions for aviation, a sector with limited low-carbon alternatives.
Google’s participation in the Avelia platform shows how corporate demand can drive supply. Avelia uses a “book and claim” system, allowing companies to claim emissions reductions even if SAF is not physically used on their specific flight. Instead, SAF is added elsewhere in the fuel network, and the environmental benefits are tracked digitally using blockchain.
This system solves a major problem—limited fuel availability. SAF supply is still concentrated in a few locations, while demand is global. By separating physical fuel use from emissions accounting, Avelia expands access and encourages broader adoption.
The platform has already made measurable progress:
- Over 64 million gallons of SAF have been supplied globally
- More than 590,000 tonnes of CO₂ emissions avoided
- Participation from 66 companies and airlines
These numbers signal growing momentum. More importantly, they show how digital infrastructure can accelerate climate solutions in traditional industries.
Beyond Flights: Google’s Broader Transport Strategy to Achieve Carbon-Neutral by 2030
Google’s SAF investment is only one part of a larger plan to cut transport emissions. The company is actively reducing the carbon footprint of both employee commuting and logistics.
Low-Carbon Commutes with EVs
It promotes low-carbon commuting by offering shuttle services, encouraging carpooling, and supporting public transit, cycling, and walking. At its campuses, Google is also investing heavily in electric mobility. By 2024, it had installed over 6,000 EV charging ports across the U.S. and Canada. In India, electric vehicles already make up nearly a quarter of its internal commuter fleet.
At the same time, Google is investing directly in SAF production. In 2024, it joined the United Airlines Ventures Sustainable Flight Fund, a $200+ million initiative supporting next-generation fuel technologies. The fund backs companies like Viridos and Svante, which are working on advanced fuel and carbon capture solutions.
Google is also a member of the Sustainable Aviation Buyers Alliance, further strengthening its role in shaping demand for cleaner aviation fuels.
The Reality Check: SAF Growth Faces Real Barriers
Despite strong corporate interest, SAF still faces significant challenges. Global production is rising fast, but not fast enough.
Production increased 24 times since 2021 and is expected to reach around 713 million gallons by the end of 2025. However, this still represents less than 1% of total jet fuel demand.
Even more concerning, growth may slow in 2026. According to the International Air Transport Association (IATA), production is expected to rise only modestly, reaching about 2.4 million metric tons. At the same time, costs remain high—SAF can be two to five times more expensive than conventional fuel.
This price gap creates a major burden for airlines. In 2025 alone, SAF-related costs could reach $3.6 billion globally. Without stronger policy support, scaling production will remain difficult.
Policy and Market Shifts: A Fragmented Landscape
Policy support plays a crucial role in SAF growth, but global approaches remain uneven.
In the U.S., incentives are weakening. The Clean Fuel Production Tax Credit (45Z) will drop significantly in 2026, reducing financial support for SAF producers. This could slow investment and limit supply growth.
In contrast, Europe is pushing ahead. The ReFuelEU Aviation mandate requires a 2% SAF blend, while countries in Asia, including Singapore and Thailand, are introducing their own mandates starting in 2026.
This divergence creates uncertainty. Companies and producers must navigate different regulations across regions, making long-term planning more complex.
The Feedstock Challenge: The Biggest Bottleneck
Analysts say technology is not the main constraint for SAF—feedstock is.
SAF relies on low-carbon raw materials such as waste oils, agricultural residues, and synthetic fuels. These resources are limited and already in demand from other sectors like renewable diesel and bioenergy.
As competition intensifies, sustainability standards are also becoming stricter. Producers must prove that their feedstocks are traceable and truly low-carbon. This means rapid expansion is unlikely in the short term. Instead, companies are expected to focus on gradual capacity growth and flexible production strategies.
Considering all the above factors, 2026 will not deliver a breakthrough but it will test the foundation of the SAF market. Three factors will define progress:
- Policy credibility: Governments must provide stable, long-term incentives
- Feedstock strategy: Companies need reliable and sustainable supply chains
- Procurement innovation: Airlines and corporations must adopt smarter purchasing models
Momentum is building, but it remains selective. Only companies that align these elements will succeed as the market evolves.
Looking Ahead: Strong Demand Signals for 2030 and Beyond
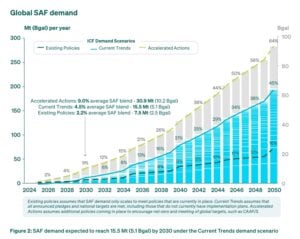
Despite the challenges, SkyNRG’s SAF Market Outlook gives optimistic long-term projections. It highlights that the demand could reach 15.5 million metric tons by 2030 under current trends.
These numbers highlight one key point: demand is not the problem. The challenge lies in scaling supply efficiently and affordably. Nonetheless, sustainable aviation fuel holds real promise. It offers one of the few viable paths to reduce emissions in aviation without redesigning aircraft.
Google’s latest move shows how large corporations can accelerate this transition. But the road ahead remains complex. High costs, limited supply, and policy uncertainty continue to slow progress.
The bottom line is clear: SAF is not scaling overnight. But with the right mix of corporate demand, policy support, and innovation, it could become a cornerstone of clean aviation in the decades ahead.
- ALSO READ: Greening the Aviation: Lufthansa and Airbus Team Up to Cut Business Travel Emissions Using SAF
The post Google Expands SAF Strategy with Amex GBT and Shell Aviation to Cut Aviation Emissions appeared first on Carbon Credits.
Carbon Footprint
History Repeating Itself: Why Middle East Conflict at the Pump Should Be a Wake-Up Call for North America

Disseminated on behalf of Surge Battery Metals.
Every time instability erupts in the Middle East, North Americans feel it where it hurts most—at the gas pump. It happened in 1979, when the Iranian Revolution sent shockwaves through global energy markets. Oil supplies tightened. Prices surged, and inflation followed. Entire economies slowed under the pressure.
For millions of households, the crisis’s impact was personal. It showed up in longer lines at gas stations and rising costs across daily life.
Nearly five decades later, the pattern is repeating.
Renewed tensions across key oil-producing regions are once again tightening global supply. Prices are rising. Consumers are feeling the impact. And once again, events unfolding thousands of miles away are shaping the cost of energy at home.
This pattern suggests a persistent structural vulnerability in North America’s exposure to global oil‑supply shocks. The region still depends heavily on global oil markets. That means supply disruptions, no matter where they occur, can quickly ripple through the system.
The result is a familiar cycle: geopolitical instability leads to supply concerns, which drive up prices, which then feed directly into the cost of living.
A Cycle Consumers Know All Too Well
When prices spike, households adjust. Commuters rethink travel. Businesses absorb higher costs or pass them on. Inflation pressures build. The impact spreads far beyond the energy sector.
With average gasoline prices currently around $4 per gallon in the US ($5.50 in California), or roughly $1.05 US per liter ($1.45 in California), the connection between global events and local fuel prices is no longer theoretical – it is a lived experience. This is why energy security is increasingly framed as both a policy concern and a kitchen‑table issue.
The events of 1979 were a warning. Today’s rising prices are another. The difference is that North America now has more options than it did back then.
Electric vehicles, battery storage, and renewable power systems are no longer future concepts. They are already part of the energy mix. And for those who have made the shift, the experience is very different, and the transition is already complete.
Instead of watching fuel prices climb, they are plugging in.
Graham Harris, Chairman of Surge Battery Metals, has spoken openly about this shift in practical terms. While rising oil prices create uncertainty at the pump, he charges his electric vehicle at home.
The contrast between gasoline dependency and electrification is becoming more visible.
When oil prices rise, gasoline costs follow. But electricity prices tend to be more stable, especially when supported by domestic generation and renewable sources. That difference is simple but powerful. It changes how people experience energy volatility.
One system is exposed to global shocks. The other is increasingly tied to domestic infrastructure. This contrast highlights how the energy transition is reshaping exposure to global price shocks.
Some analysts increasingly frame the energy transition not only as a climate imperative but also as a strategy to reduce exposure to external risk. It relates to questions of control over where energy comes from, how it is produced, and how stable it is over time.
And at the center of that transition is one critical material: lithium.
Lithium: The Foundation of Energy Independence
Lithium is the core component of modern battery technology. It powers electric vehicles, supports grid-scale energy storage, and plays a growing role in advanced defense systems.
As electrification expands, demand for lithium is rising across multiple sectors.
But here is the challenge: much of today’s lithium supply still comes from outside the United States. This creates a familiar dynamic.
Just as oil dependency has long exposed North America to geopolitical risk, reliance on foreign lithium supply introduces a new layer of vulnerability. The commodity is different, but the structure is similar.
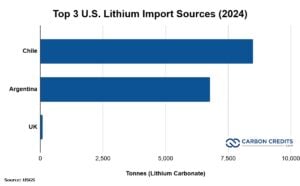
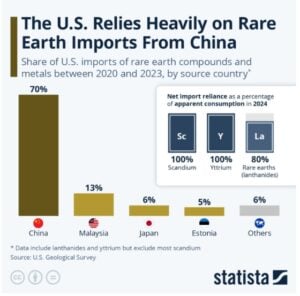
The United States imported the majority of its lithium from Chile and Argentina in 2024. Together, they accounted for roughly 98% of the total supply. Smaller volumes were sourced from the UK, France, and China.
That is why domestic production is becoming a central focus of energy and industrial policy.
In March 2025, Donald Trump signed an executive order titled “Immediate Measures to Increase American Mineral Production.” The directive called for faster permitting, expanded development, and reduced reliance on foreign supply chains for critical minerals.
The message of the order was clear: building domestic capacity is now a strategic priority.
- RELATED: Live Lithium Prices Today
A Domestic Resource Takes Shape in Nevada
Within this broader shift, projects like Surge Battery Metals’ (TSX-V: NILI | OTCQX: NILIF) Nevada North Lithium Project (NNLP) are gaining attention.
NNLP hosts a measured and indicated resource of 11.24 million tonnes of lithium carbonate equivalent (LCE) at an average grade of 3,010 ppm lithium, based on company disclosures. This makes it the highest-grade lithium clay resource identified in the United States to date.
A 2025 Preliminary Economic Assessment (PEA) outlines the project’s scale:
- After-tax NPV (8%): US$9.21 billion
- Internal Rate of Return (IRR): 22.8%
- Mine life: 42 years
- Average annual production: ~86,300 tonnes LCE
- Employment: ~2,000 construction jobs and ~350 long-term operational roles
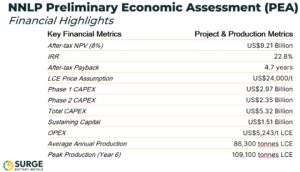
These figures indicate potential in terms of scale, longevity, and the ability to contribute to domestic supply if the project moves forward. At full production, NNLP has the potential to rank among the larger lithium-producing assets globally, based on third-party analysis.
Recent drilling results announced by Surge Battery Metals have further strengthened NNLP’s profile as a standout asset. In February 2026, step-out drilling found a 31-meter intercept with 4,196 ppm lithium from surface. This is much higher than the project’s average of 3,010 ppm Li. It also extends high-grade mineralization nearly 640 meters beyond the current resource boundary.
Infill drilling showed a steady, thick, high-grade core. It included intercepts like 116 meters at 3,752 ppm Li and 32 meters at 4,521 ppm Li. These results support future resource expansion. They also highlight the project’s scale, quality, and technical readiness as it prepares for a Pre-Feasibility Study.
Beyond the project itself, it reflects a broader policy and industry shift toward building more domestically anchored energy systems.
From Oil Dependency to Mineral Security
The connection between oil and lithium is not always obvious at first glance. Oil fuels internal combustion engines, while lithium supports batteries and energy‑storage systems, with distinct technologies and supply chains.
But the underlying issue is the same. Dependence on external sources creates exposure to external risk.
In the case of oil, that risk has played out repeatedly over decades. Supply disruptions, price shocks, and geopolitical tensions have all shaped the market.
With lithium, the industry is earlier in its development. But the stakes are rising quickly.
Global demand for lithium grew about 30 % in 2024, driven mainly by batteries for electric vehicles and energy storage, according to IEA data. Demand in 2025 continued at high rates, and under current policies, lithium demand is projected to grow fivefold by 2040 compared with today.
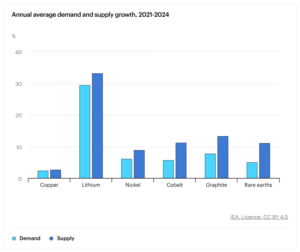
At the same time, supply growth is struggling to keep pace with demand forecasts. These trends show that ensuring a stable, secure supply is becoming just as important as expanding production.
That is where domestic projects come in, such as Surge Battery Metals’ NNLP.
They may not eliminate global market dynamics, but they can reduce exposure to them. They can provide a buffer against volatility. And they can support a more stable, self-reliant energy system.
A Turning Point – or Another Warning?
While history does not repeat in the same way, similar patterns can be observed.
The oil shocks of the 1970s revealed a vulnerability that shaped energy policy for decades. Today’s market signals are pointing to a similar challenge—this time at the intersection of oil dependency and critical mineral supply.
The difference is that the range of policy and technological options available today is broader. Electrification is already underway. Battery technology is advancing. Domestic resource development is gaining policy support. The pieces are in place.
Data from the International Energy Agency’s Global EV Outlook 2025 shows that global battery demand reached a historic milestone of 1 terawatt-hour (TWh) in 2024. This surge was mainly due to the growth of electric vehicles (EVs).
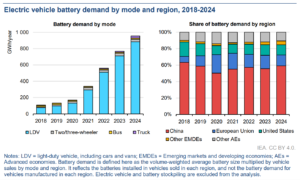
By 2030, demand is expected to more than triple, exceeding 3 TWh under current policies. This reflects not only rising EV adoption but also expanding stationary storage demand. Both of which rely on critical minerals like lithium.
Electric vehicles continue to displace traditional oil use as well. The same IEA analysis shows that by 2030, EVs will replace over 5 million barrels of oil daily. This is about the size of a major country’s transport sector, highlighting how electrification is changing energy markets.
What remains uncertain is the pace at which these changes will occur.
Will rising fuel prices once again fade as markets stabilize? Or will they serve as a catalyst for deeper structural shifts?
That question matters not just for policymakers or investors, but for everyday consumers.
Because at the end of the day, energy transitions are not measured in policy papers. They are measured in daily decisions—how people power their homes, fuel their vehicles, and respond to rising costs.
DISCLAIMER
New Era Publishing Inc. and/or CarbonCredits.com (“We” or “Us”) are not securities dealers or brokers, investment advisers, or financial advisers, and you should not rely on the information herein as investment advice. Surge Battery Metals Inc. (“Company”) made a one-time payment of $75,000 to provide marketing services for a term of three months. None of the owners, members, directors, or employees of New Era Publishing Inc. and/or CarbonCredits.com currently hold, or have any beneficial ownership in, any shares, stocks, or options of the companies mentioned.
This article is informational only and is solely for use by prospective investors in determining whether to seek additional information. It does not constitute an offer to sell or a solicitation of an offer to buy any securities. Examples that we provide of share price increases pertaining to a particular issuer from one referenced date to another represent arbitrarily chosen time periods and are no indication whatsoever of future stock prices for that issuer and are of no predictive value.
Our stock profiles are intended to highlight certain companies for your further investigation; they are not stock recommendations or an offer or sale of the referenced securities. The securities issued by the companies we profile should be considered high-risk; if you do invest despite these warnings, you may lose your entire investment. Please do your own research before investing, including reviewing the companies’ SEDAR+ and SEC filings, press releases, and risk disclosures.
It is our policy that information contained in this profile was provided by the company, extracted from SEDAR+ and SEC filings, company websites, and other publicly available sources. We believe the sources and information are accurate and reliable but we cannot guarantee them.
CAUTIONARY STATEMENT AND FORWARD-LOOKING INFORMATION
Certain statements contained in this news release may constitute “forward-looking information” within the meaning of applicable securities laws. Forward-looking information generally can be identified by words such as “anticipate,” “expect,” “estimate,” “forecast,” “plan,” and similar expressions suggesting future outcomes or events. Forward-looking information is based on current expectations of management; however, it is subject to known and unknown risks, uncertainties, and other factors that may cause actual results to differ materially from those anticipated.
These factors include, without limitation, statements relating to the Company’s exploration and development plans, the potential of its mineral projects, financing activities, regulatory approvals, market conditions, and future objectives. Forward-looking information involves numerous risks and uncertainties and actual results might differ materially from results suggested in any forward-looking information. These risks and uncertainties include, among other things, market volatility, the state of financial markets for the Company’s securities, fluctuations in commodity prices, operational challenges, and changes in business plans.
Forward-looking information is based on several key expectations and assumptions, including, without limitation, that the Company will continue with its stated business objectives and will be able to raise additional capital as required. Although management of the Company has attempted to identify important factors that could cause actual results to differ materially, there may be other factors that cause results not to be as anticipated, estimated, or intended.
There can be no assurance that such forward-looking information will prove to be accurate, as actual results and future events could differ materially. Accordingly, readers should not place undue reliance on forward-looking information. Additional information about risks and uncertainties is contained in the Company’s management’s discussion and analysis and annual information form for the year ended December 31, 2025, copies of which are available on SEDAR+ at www.sedarplus.ca.
The forward-looking information contained herein is expressly qualified in its entirety by this cautionary statement. Forward-looking information reflects management’s current beliefs and is based on information currently available to the Company. The forward-looking information is made as of the date of this news release, and the Company assumes no obligation to update or revise such information to reflect new events or circumstances except as may be required by applicable law.
The post History Repeating Itself: Why Middle East Conflict at the Pump Should Be a Wake-Up Call for North America appeared first on Carbon Credits.


A Lesson for America from West Africa
Virginia Republicans Want Tax Relief to Ease Gas Costs. There’s Also Electric Vehicles.
EPA Flags Microplastics as ‘Priority’ Water Contaminants, but the Move Doesn’t Guarantee Regulation
-
Greenhouse Gases8 months ago
Guest post: Why China is still building new coal – and when it might stop
-
Climate Change8 months ago
Guest post: Why China is still building new coal – and when it might stop
-

 Greenhouse Gases2 years ago
嘉宾来稿:满足中国增长的用电需求 光伏加储能“比新建煤电更实惠”
-
Climate Change2 years ago
Bill Discounting Climate Change in Florida’s Energy Policy Awaits DeSantis’ Approval
-

 Climate Change2 years ago
嘉宾来稿:满足中国增长的用电需求 光伏加储能“比新建煤电更实惠”
-
Climate Change Videos2 years ago
The toxic gas flares fuelling Nigeria’s climate change – BBC News
-

 Renewable Energy5 months ago
Sending Progressive Philanthropist George Soros to Prison?
-

 Carbon Footprint2 years ago
US SEC’s Climate Disclosure Rules Spur Renewed Interest in Carbon Credits