

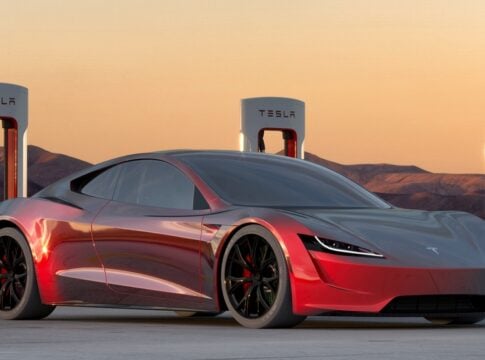
Tesla has reclaimed the global electric vehicle (EV) sales crown, overtaking BYD in early 2026. In the first quarter of 2026, Tesla delivered 358,023 EVs worldwide. This figure edged out BYD’s 310,389 EV deliveries, giving Tesla back the lead in pure battery electric vehicle (BEV) sales and sending stock slightly upward.
Tesla’s sales in this period rose about 6.3% year‑over‑year, showing a rebound from slower parts of 2025. This shift matters because the EV giant lost the annual global BEV sales lead in 2025.
Last year, BYD’s annual pure electric vehicle sales were higher than Tesla’s, largely due to China’s strong EV demand and policy changes.
The recent growth in Tesla’s sales shows high demand for its main models. The Model Y and Model 3 made up most of the deliveries in Q1 2026.
Battle of the EV Titans: Tesla vs. BYD
Competition between Tesla and BYD has become one of the defining stories in global EV markets.
BYD expanded rapidly over the past few years. It has a broad lineup of EVs and plug‑in hybrids and benefits from strong domestic sales in China. In 2025, BYD reported high sales growth as it strengthened its footprint outside China.

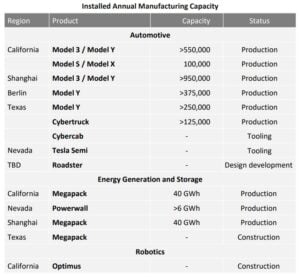
Tesla, by contrast, focuses on a narrower range of pure EVs but scales production efficiently. It has manufacturing plants in the United States, China, and Europe. These facilities help cut costs and serve major markets more quickly.
The rivalry pushes both companies to improve pricing, technology, and production capacity. Tesla’s price cuts in some markets and BYD’s aggressive growth have kept competition tight.
The EV Boom: Markets on Overdrive
The global EV market keeps growing strongly. According to the International Energy Agency (IEA), electric car sales reached more than 17 million units globally in 2024. EVs made up more than 20% of total new car sales that year — up from earlier levels.
Data from the IEA’s Global EV Outlook 2025 shows that electric light‑duty vehicle sales are expected to reach about 40% of total vehicle sales by 2030 under current policy trends.
The stock of EVs on the road is also growing. The global EV fleet could expand to around 245 million vehicles by 2030 under stated policies.
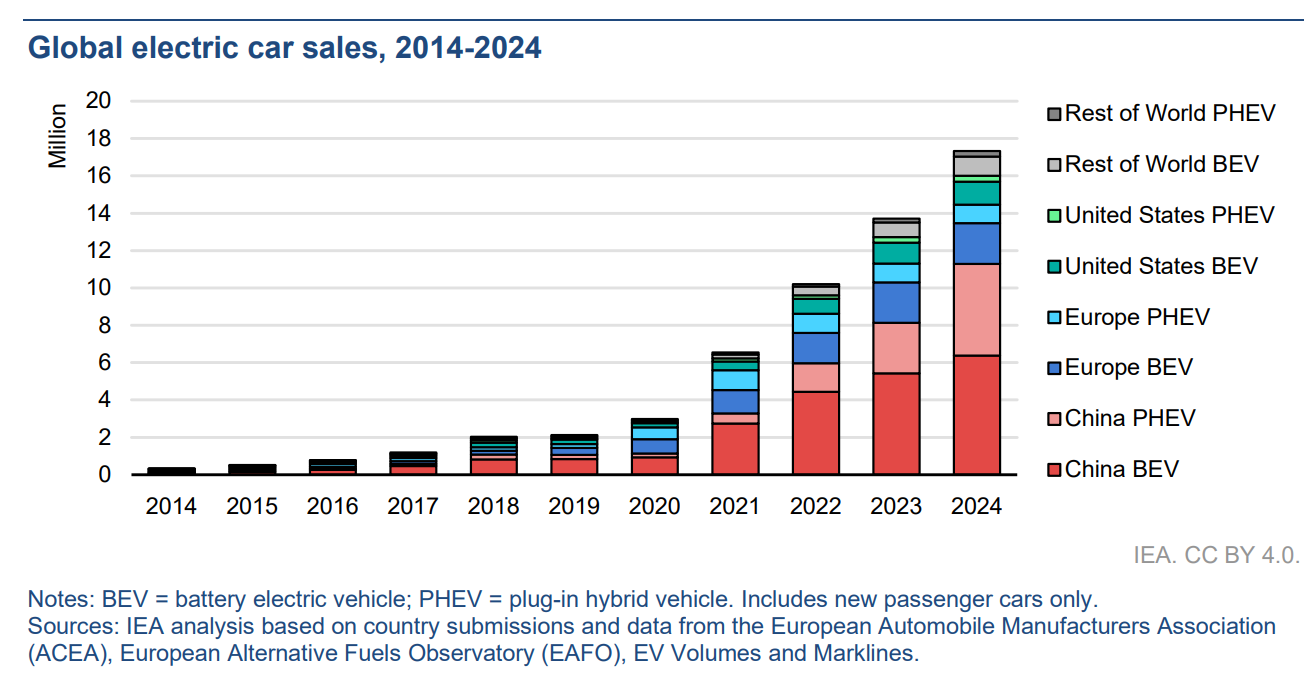
Growth is strongest in China, Europe, and the United States. China remains the largest EV market, accounting for more than half of global EV sales in recent years.
Battery cost declines also fuel adoption. Average lithium‑ion battery prices have fallen significantly over the past decade, making electric vehicles more affordable. Governments around the world are also boosting EV uptake with incentives and stricter emissions standards.
Tesla’s Playbook: Scale, Tech, and Price Moves
Tesla’s return to the top reflects its focus on production scale and cost efficiency. The company has reduced vehicle prices in key markets to stay competitive. These price cuts helped increase demand, though they also put pressure on profit margins.
Elon Musk’s EV company continues to invest in manufacturing technology. Its “gigafactories” use advanced automation and large casting techniques to reduce production costs. Newer facilities in the U.S. and abroad help Tesla maintain output even as demand shifts.
The company is also developing next‑generation vehicles. These include plans for more affordable EV models designed to attract a wider range of buyers.
Tesla is expanding its energy business as well. This includes battery storage systems and solar products that align with the company’s broader clean energy goals.
Software remains a strength for Tesla. Features like over‑the‑air updates and driver assist systems add value for customers and differentiate Tesla’s vehicles from competitors.
Wall Street Watches, TSLA Reacts
Tesla’s stock, traded as TSLA, has shown volatility in response to sales news.
After Tesla’s delivery numbers in Q1 2026 showed the company regaining the BEV sales lead, its shares saw some short‑term gains. However, the stock has remained volatile. Broader concerns about pricing pressure, excess inventory, and competition have kept investor sentiment cautious.
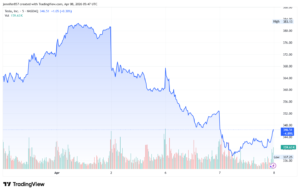
In early 2026, shares pulled back after production exceeded deliveries and analysts noted weaker-than-expected margins. Tesla produced 408,386 vehicles in Q1 2026 but delivered 358,023, leaving some inventory unsold. This gap contributed to stock pressure.
Despite these swings, Tesla remains one of the highest‑valued automakers in the world. Its market capitalization continues to reflect expectations about future EV adoption and the company’s role in clean energy.
Market watchers note that Tesla’s ability to maintain leadership in BEV sales affects its valuation. Strong delivery figures help support confidence in Tesla’s long‑term strategy, even as competition increases.
Beyond sales and competition, Tesla’s EVs also play a key role in the global effort to reduce carbon emissions and fight climate change.
EVs Fighting Climate Change, One Mile at a Time
Electric vehicles help cut carbon emissions from transport. Road transport is a major source of energy‑related emissions. In recent years, EVs made up more than 20% of global car sales, according to the IEA.
EVs reduce oil demand and lower emissions. The global EV fleet could rise to nearly 245 million vehicles by 2030 under stated policy scenarios, significantly displacing traditional gasoline and diesel cars.

As EV adoption grows, the carbon intensity of the electricity grid becomes more important. EVs charged with cleaner power produce larger net emission benefits.
Even with mixed grid emissions, EVs still reduce lifetime greenhouse gas output compared with internal combustion vehicles.
Governments around the world support EV adoption with stricter fuel standards, tax incentives, and expanded charging networks. These policies help ensure electric vehicles contribute to global decarbonization and climate goals.
Outlook: Growth, Competition, and Innovation
The EV market is expected to grow strongly in the coming years. Demand is supported by climate goals, advancing technology, and consumer interest in cleaner mobility.
Tesla’s return to the top in early 2026 shows that it remains a central player in the electric transition. Its focus on pure electric vehicles, global scale, and continuous innovation continues to fuel its position.
However, the gap between Tesla and competitors like BYD is narrowing. BYD’s strong EV growth, especially in China and expanding export markets, shows that competition remains intense.
Future leadership in the EV industry will depend on cost, technology, charging infrastructure, and the ability to scale production efficiently. Companies that balance these factors well will shape the next phase of the global EV market.
For now, Tesla’s rebound highlights both the rapid growth of the sector and the increasing intensity of competition among the world’s leading EV makers.
The post Tesla Reclaims EV Sales Crown from BYD in Q1 2026, Heating Up the EV Race appeared first on Carbon Credits.

Nature-based carbon investments deserve consideration when they address a specific business dependency and produce outcomes you can measure. Imagine Moonbucks, a global coffee roaster planning next season’s espresso blend. It is considering natural Grade 4 coffee from Jimma, in southwestern Oromia, Ethiopia. Its sourcing decisions affect the roasting schedule and the cash tied up in coffee purchases. Moonbucks needs to understand which measures could protect that supply, what they would cost and how it would judge the results.
1. Define the sourcing problem before choosing a project
Moonbucks needs a dependable component for its espresso blend. Its procurement team wants continuity of volume and an agreed cup profile. Replacing a shipment at short notice could require new sample approval and changes to the blend, and given the schedules for cultivation, processing, and freight delivery, is practically impossible. Moonbucks needs to get this right, and its initial concern is inconsistent deliveries. It commissions an assessment of the supplying farms and post-harvest chain. The questions cover land condition, harvest availability and whether drying or storage problems are affecting saleable lots.
This distinction changes the investment brief. A tree-planting proposal cannot be assumed to fix drying problems. Better storage cannot restore eroded land. The team must establish which problem exists before selecting the response.
CCC’s guide to finding nature-based solutions in your supply chain explains where to look. Here, the next task is to turn a broad concern into a testable proposal.
2. Develop nature-based carbon investments around the actual supply chain
The assessment would trace Moonbucks’ purchases back through the exporter and supplying producer groups. Which farms supply the contracted lots? Who controls land-management decisions? How long does the buyer expect to maintain the purchasing relationship?
Furthermore, Jimma natural Grade 4 cannot be treated as interchangeable with every Ethiopian coffee. Moonbucks would need to test any substitute against its own blend and quality requirements.
Suppose Moonbucks’ assessment identifies an opportunity to maintain shade trees and restore vegetation along exposed streambanks. The IPCC describes agroforestry as a way to store carbon in vegetation and soil, with potential benefits for erosion control and water quality.1 Moonbucks would need local advice on species, growing conditions and maintenance before deciding how these measures fit its sourcing plan.
The proposal now has a defined sourcing connection and a candidate intervention. The next steps are to test its effect on production, assess carbon eligibility and build the financial case.
3. Compare the proposal with other ways to protect supply
WBCSD’s Nature-based Solutions Blueprint recommends comparing nature-based options with other responses across their benefits and costs.2 For Moonbucks, that means evaluating the landscape proposal alongside drying improvements, storage controls and alternative sourcing arrangements.
The product’s natural-process designation matters. Moonbucks should examine the drying and dry-milling chain alongside land conditions. Its team would check storage practices, contamination risks and incoming-lot quality to see whether problems arise before or after the coffee leaves the farms.
The revised proposal might combine land stewardship with separate post-harvest controls. Each component needs its own purpose and budget. A sustainability label should not obscure which activity is expected to solve which problem.
The project develops as the evidence improves. Its scope should follow the diagnosis rather than preserve the first idea unchanged.
4. Establish what the carbon outcome could count toward
Moonbucks’ sustainability team now tests the proposed carbon case separately from the sourcing case. Is the objective a measurable change in Moonbucks’ value-chain emissions, verified credits for separate voluntary use, or distinct outcomes under carefully defined arrangements?
Scope 3 covers value-chain emissions. A purchasing relationship alone does not prove that a farm intervention can be included in Moonbucks’ inventory. The team needs an applicable accounting method, defensible boundaries and evidence supporting attribution.
SBTi’s FLAG Guidance (forest, land and agriculture), version 1.2, says purchased credits used as offsets cannot meet near-term FLAG or energy and industry targets. Eligible land-based removals are subject to accounting requirements.3 Moonbucks needs to test its proposal against those rules before including an outcome in its targets.
For Moonbucks’ Jimma proposal, maintaining existing trees and establishing new vegetation could involve different carbon questions. Specialists must examine the baseline and additionality, meaning what changes because the project proceeds. They must also assess measurement and the risk that stored carbon is lost. CCC’s MRV and additionality article introduces those tests.
Until that work is complete, Moonbucks should not budget an assumed Scope 3 reduction or credit-sale receipt. Direct emissions reductions remain the priority.
5. Build a financial case that survives weaker assumptions
Moonbucks’ finance team would now build a multi-year budget. UNEP’s State of Finance for Nature 2023 compares current finance with the investment needed to meet climate, biodiversity and land-restoration goals.4 The company would cost its proposed activities, farmer participation and ongoing monitoring. Verification, where required, is a separate expense. Maintenance and responsibility for replacing failed plantings must remain visible after the initial establishment budget ends.
Operational benefits need equally careful treatment. If fewer rejected lots reduce emergency purchasing, count that saving once. Do not add “supply resilience” as another financial benefit when it represents the same avoided cost.
Moonbucks should compare a base case with slower benefits, higher implementation costs and no carbon revenue. It should also distinguish production outcomes from quality and shipment outcomes. A single good harvest would not prove that the landscape intervention caused better delivery performance.
A project can remain worth funding even when its carbon case needs more work. That decision must rest on the operational evidence and the company’s objectives, without unsupported environmental claims.
6. Fund a pilot with a clear expansion decision
Moonbucks’ first approval would fund a bounded pilot, rather than commit the entire sourcing program. Before spending, Moonbucks would agree on participating farms, responsibilities and the evidence needed at review.
Its scorecard could track farmer participation, implementation costs and plant survival, alongside accepted coffee volumes and lot-quality results. Carbon measurements would follow the selected method. Farm-level traceability must connect the intervention to the actual sourcing relationship.
Suppose Moonbucks’ review later finds that storage changes explain most quality improvements, while the land measures need longer observation. Those findings would shape the next decision: expand the proven component, adjust the landscape work or pause further spending. They would not justify crediting all improvements to tree planting.
This gives nature-based carbon investments a practical place in a multi-year strategy. Funding increases as the evidence supports it, and the project can change direction before a larger commitment.
Discuss a sourcing opportunity with CCC
Carbon Credit Capital’s nature-based supply-chain investment service uses its Dual-Value Model to examine supply-chain economics alongside potential sustainability outcomes.
Schedule a consultation to discuss your sourcing exposure and the questions to resolve before allocating capital.
Sources
- Intergovernmental Panel on Climate Change (IPCC), Climate Change 2022: Mitigation of Climate Change, Chapter 7, Agriculture, Forestry and Other Land Uses, section 7.4.3.3 (Agroforestry).
- World Business Council for Sustainable Development (WBCSD), Nature-based Solutions Blueprint, 5 June 2024.
- Science Based Targets initiative (SBTi), Forest, Land and Agriculture Science-Based Target-Setting Guidance, version 1.2, March 2026, section 3.1.4, pp. 37–38.
- United Nations Environment Programme (UNEP), State of Finance for Nature 2023, 2023.
A plastic credit funds the collection of plastic waste in places where no formal system exists to collect it. Each credit represents a measured, independently audited quantity of plastic taken out of the environment or returned to use, tracked on a public registry.

EU carbon credit claims changed on 27 September 2026, the day the Directive (EU) 2024/825 began to apply across the European Union. The change is narrow. It changes how a company can talk about the credits it buys. A product can no longer be called neutral on the strength of compensation alone; however, every specific, evidenced statement about what a company measured, reduced, and funded stays fully available.




